
12 posts tagged with "sales-strategy"

View All Tags

The Cost of Inaction in Sales: How to Build Real Urgency and Close More Deals

Β· 11 min read
MarketBetter Team
Content Team, marketbetter.ai

Your biggest competitor isn't the other vendor on the shortlist. It's the status quo.

Every quarter, billions of dollars in pipeline evaporate β€” not because a rival swooped in with a better demo, but because someone on the buying committee said, "Let's revisit this next quarter," and nobody on the selling side had a compelling answer for why that was a terrible idea.

If you've been in B2B sales for more than a cycle, you've felt this. The deal that went dark after a "great" demo. The champion who stopped returning calls. The CFO who said the budget "shifted." These are all symptoms of the same disease: you never made the cost of doing nothing concrete enough to act on.

Here's the uncomfortable truth most sales training skips: finding pain isn't enough. Every AE on the planet can uncover a problem. The ones who consistently close above quota are the ones who can put a dollar figure on what happens if that problem persists for another 30, 60, or 90 days.

This is the discipline of building the cost of inaction β€” and it's the single most underleveraged skill in modern B2B sales.

Why "Do Nothing" Keeps Winning​

Let's start with the psychology. Nobel laureate Daniel Kahneman showed us that humans feel losses roughly twice as intensely as equivalent gains. But here's the catch: that only works when the loss is visible. If your buyer can't see what they're losing by waiting, the status quo feels safe. Comfortable. Free.

It isn't free. It just looks that way.

Consider a mid-market SaaS company with 15 SDRs. Their current prospecting stack takes each rep about 90 minutes a day just to build lists, research accounts, and figure out who to call. That's 22.5 hours per day across the team β€” roughly three full-time employees' worth of labor β€” spent on manual research instead of conversations.

Every week that passes without fixing that? Another 112 hours of selling time burned. Another $45,000 in fully loaded rep cost allocated to Googling LinkedIn profiles instead of booking meetings.

But in the deal, nobody said that number out loud. The AE showed a slick demo of their AI-powered prospecting tool, quoted a price, and asked if there were "any questions." The VP of Sales nodded politely and said she'd "circle back after Q2 planning."

That deal is dead, and the AE doesn't even know why.

The Five-Step Framework for Quantifying Inaction​

There's a structured way to do this. It's not manipulative β€” it's clarifying. You're helping your buyer see what they already know but haven't quantified. As Chris Orlob puts it, the best closers make the invisible costs visible.

Here's the framework, expanded with examples from real B2B selling scenarios:

Step 1: Find the Metric That's Bleeding​

Every business problem maps to a number. Your job in discovery is to find the specific metric that's suffering right now β€” not theoretically, not "could be better," but actively deteriorating.

The question that unlocks this: "What metric is suffering as a result of that problem?"

This isn't a soft question. It's surgical. It forces the buyer to stop talking in generalities ("Yeah, our outbound could be better") and start talking in specifics ("Our reply rates dropped from 8% to 3% over the last two quarters").

Good metrics to hunt for:

  • Revenue leaked per month (deals lost, pipeline that went dark, churned accounts)
  • Time wasted per week (hours spent on manual work that could be automated)
  • Customer churn per quarter (and the revenue attached to those logos)
  • Cost per lead or cost per meeting (and how it's trending)
  • Ramp time for new hires (weeks from start date to first closed deal)

The key is specificity. "We're losing deals" is a feeling. "We lost 14 deals worth $820K last quarter to no-decision" is a number you can work with.

Step 2: Reverse-Engineer the Cost of Waiting​

Once you have the metric, run the clock forward. What does another month of this problem cost?

This is where most AEs bail out. They hear the pain, they nod sympathetically, and they pivot to the demo. Don't. Stay in the math.

Example β€” Martech Stack Consolidation:

A marketing ops leader tells you they're running 11 different tools for email, enrichment, intent, and analytics. They spend $8,200/month across subscriptions, plus their ops team burns 20 hours/week on integrations and data cleanup.

The cost of waiting one quarter:

  • $24,600 in redundant SaaS spend
  • 260 hours of ops labor (~$19,500 at fully loaded cost)
  • Unknown data quality degradation affecting campaign targeting

That's $44,100 in hard costs per quarter β€” before you even quantify the downstream impact of bad data on pipeline quality.

Now compare that to the price of your platform. Suddenly, the "budget isn't there" objection looks absurd. The budget is already being spent β€” just on the wrong things.

Example β€” SDR Team Without Intent Signals:

An SDR leader has 8 reps cold-calling from static lists. Their connect rate is 4%, and their meeting-to-opportunity conversion is 22%. Each rep makes 60 dials a day.

Without intent data prioritizing who's actually in-market, roughly 96% of those dials are wasted on accounts with zero buying intent. That's 460 wasted dials per day across the team. At an average of 3 minutes per attempt (including research, dial, and voicemail), that's 23 hours of daily labor producing nothing.

Per month: 460 hours of wasted SDR time. At $35/hour fully loaded, that's $16,100/month lighting itself on fire. And that's just the direct cost β€” it doesn't account for the demoralization of reps who spend all day getting voicemail, or the pipeline they would have generated if they'd been calling buyers who were actively researching their category.

Step 3: Do the Math Out Loud​

This is the tactical move that separates average sellers from elite ones. Don't send the math in a follow-up email. Do it live, in the call, with the buyer.

"So let me make sure I understand. You've got 8 reps making 60 dials a day, and about 96% of those are going to accounts that aren't in-market. That's roughly 460 wasted dials daily. At 3 minutes each, that's 23 hours a day β€” nearly 500 hours a month β€” of your team's time going to voicemail. At your fully loaded cost, that's north of $16,000 a month. Over a quarter, that's almost $50,000. Does that math track?"

Two things happen when you do this:

  1. The buyer validates or corrects you. Either way, they're now co-authoring the business case. It's not your number anymore β€” it's their number.
  2. The cost becomes real. Abstract pain ("outbound isn't working great") becomes a concrete, undeniable dollar figure that they'll carry into every internal conversation about budget and priority.

Step 4: Show the Compound Cost​

A one-month cost is easy to rationalize away. "We'll deal with it next quarter." But costs compound, and showing that compounding effect is what creates genuine urgency.

The 90-day lens:

  • Month 1: $16,100 in wasted SDR labor
  • Month 2: $16,100 more, plus the pipeline deficit from Month 1 starts showing up as a revenue gap
  • Month 3: $16,100 more, plus two months of compounded pipeline deficit, plus the top-performing rep who just got recruited by a competitor because she was tired of calling dead lists

By Day 90, you're not just $48,300 down in wasted labor. You're staring at a pipeline gap that will take two quarters to recover from, and you're short one A-player who will cost $30K to replace and 4 months to ramp.

That's the real cost of "let's revisit next quarter."

This works because it mirrors how costs actually behave in business. Problems don't pause politely while the buying committee debates. They accelerate. Showing the acceleration curve is what turns a "nice to have" into a "we need to move on this."

Step 5: Connect Cost to Power​

Once you've built the cost of inaction, you have something more valuable than a compelling slide: you have a story that your champion can tell the CFO, the CEO, or whoever controls the budget.

The question "What metric is suffering?" doesn't just give you ammunition β€” it opens doors to the economic buyer. When your champion walks into the executive meeting and says, "We're burning $50K per quarter on wasted SDR time and it's compounding into a pipeline gap that threatens next year's number," that's a conversation the C-suite has to engage with.

Compare that to the champion who walks in and says, "The sales team found a cool tool for outbound. Can we get $40K in budget?" One of these gets approved. One gets tabled.

The AI Advantage: Making Invisible Costs Visible at Scale​

Here's where the game has fundamentally changed in the last 18 months.

The framework above has always worked β€” smart sellers have been quantifying inaction for decades. But there was always a gap: you could only quantify the costs you could see. And in B2B sales, most of the cost of inaction is invisible.

How many buyers visited your website this week and left without a trace? How many accounts in your TAM are actively researching your category right now β€” reading competitor reviews, searching for solutions β€” while your reps cold-call accounts that won't buy for another 18 months?

That's the new cost of inaction: the signals you're not seeing and the deals your competitors are closing because they saw them first.

This is the problem MarketBetter was built to solve. When your platform identifies the actual companies and people visiting your site, surfaces real-time intent signals showing who's in-market, and delivers a daily playbook that tells each rep exactly who to call and why β€” you're not just making your outbound more efficient. You're eliminating an entire category of invisible cost.

Think about it through the cost-of-inaction lens:

  • Without visitor identification: 85-95% of your website traffic is anonymous. If you're getting 5,000 monthly visitors and converting 2%, that's 4,900 potential buyers you know nothing about. Even if only 10% are ICP-fit, that's 490 warm accounts your competitors might be reaching first.
  • Without intent signals: Your reps are calling accounts at random, hoping to catch someone in a buying cycle. The math we ran earlier β€” 96% of dials wasted β€” isn't hypothetical. It's the default for any team working without signal-driven prioritization.
  • Without a daily playbook: Even reps who have access to intent data spend 60-90 minutes a day figuring out what to do with it. The operational tax of turning raw signals into a prioritized call list is its own hidden cost.

Stack those up over a quarter and you're looking at six figures of wasted motion, missed pipeline, and deals that went to whoever showed up first with a relevant message.

Your competitors are already responding to buyer signals you're missing. That's not a scare tactic β€” it's arithmetic. If a buyer is on your website at 10 AM and your competitor reaches out by 10:15 because their visitor ID flagged the account, you've lost the first-mover advantage before your rep finishes their morning coffee.

Putting It Into Practice​

Here's a challenge for this week: take your three most important open deals and run the cost-of-inaction exercise on each one.

  1. Identify the bleeding metric. If you don't know it, you haven't done deep enough discovery. Go back and ask.
  2. Quantify one month of inaction. What does it cost the buyer β€” in dollars, hours, or missed opportunities β€” to wait 30 more days?
  3. Project the compound cost to 90 days. Include second-order effects: the pipeline gap, the rep attrition risk, the competitive ground lost.
  4. Do the math live on your next call. Say it out loud. Let the buyer validate the numbers.
  5. Arm your champion. Give them the story, the numbers, and the 90-day projection. Make it impossible for the executive team to rationalize delay.

The deals you lose to "no decision" aren't lost because the buyer didn't feel pain. They're lost because no one translated that pain into a number that made waiting feel more expensive than buying.

That translation β€” from vague discomfort to quantified urgency β€” is the skill that separates closers from demo jockeys. And in a world where AI can now surface the signals that make the invisible costs visible, there's never been a better time to master it.


Ready to see what your invisible costs look like? MarketBetter shows you exactly who's on your site, what they care about, and how to reach them β€” before your competitors do. Start your free trial β†’

We Analyzed 20+ Studies on AI in B2B Sales: Here's What's Actually Working in 2026

Β· 12 min read
sunder
Founder, marketbetter.ai

Everyone has an opinion about AI in sales. Vendors say it's magic. Skeptics say it's hype. SDR teams caught in the middle are just trying to figure out what to buy.

So we did something different. Instead of running another survey or publishing another vendor comparison, we analyzed 20+ independent studies, industry reports, and data sets from Salesforce, Deloitte, McKinsey, Gartner, Martal Group, MarketsandMarkets, SuperAGI, HubSpot, and others β€” covering hundreds of thousands of data points across B2B sales organizations.

The goal: cut through the noise and answer three questions that actually matter.

  1. What's genuinely working?
  2. What's just vendor hype?
  3. Where should sales leaders invest next?

Here's what the data says.

AI adoption statistics in B2B sales 2026

The State of AI Adoption: Near-Universal, Unevenly Applied​

Let's start with the baseline. AI in B2B sales is no longer experimental β€” it's mainstream. But "mainstream" doesn't mean "effective."

The headline numbers:

  • 89% of revenue organizations now use AI in some form β€” up from 34% in 2023 (Martal Group, Forrester)
  • 88% of businesses report regular AI use in at least one function, up from 78% a year ago (Sopro)
  • 87% of sales organizations use AI for prospecting, forecasting, lead scoring, or drafting emails (Salesforce State of Sales 2026)
  • 92% of sales teams plan to increase AI investment in 2026 (HubSpot)

That looks like universal adoption. But dig deeper and you find a critical gap.

Deloitte Digital's February 2026 study of 1,060 B2B suppliers and buyers found that while 45% of suppliers say they use AI in sales, only 24% have touched agentic AI β€” the autonomous, workflow-driving kind that actually replaces manual processes. Two-thirds of those not using agentic AI said they plan to. But planning isn't doing.

The data tells us: everyone has AI. Almost nobody has deployed it effectively.

The Performance Gap: AI-Enabled Teams Are Pulling Away​

Here's the number that should keep every sales leader up at night.

83% of sales teams using AI saw revenue growth in the past year, versus 66% of teams without AI (Salesforce). That's a 17-percentage-point gap in revenue growth β€” and it's widening.

More data points from across the studies:

MetricAI-Enabled TeamsNon-AI TeamsGap
Revenue growth83% saw growth66% saw growth+17 pts
Productivity improvementUp to 40%Baseline+40%
Sales cycle length25% shorterBaseline-25%
Revenue increase13-15%Baseline+13-15%
Sales ROI improvement10-20%Baseline+10-20%
ROI within first year86%N/Aβ€”

Sources: Salesforce State of Sales 2026, McKinsey, Sopro, MarketsandMarkets

Deloitte found an even starker divide. Digitally mature B2B suppliers exceeded annual sales growth targets by 110% more than low-maturity competitors. These mature organizations were five times more likely to use AI extensively and five times more likely to use agentic AI at all.

The takeaway: AI isn't a nice-to-have. It's creating a two-tier system in B2B sales. Teams with effective AI implementations are compounding their advantages while everyone else debates whether to adopt.

The AI SDR Paradox: Volume Up, Quality Down​

This is where the data gets uncomfortable for AI SDR vendors.

The AI SDR market is exploding β€” projected to grow from $4.12 billion in 2025 to $15.01 billion by 2030 at a 29.5% CAGR (MarketsandMarkets). An estimated 22% of sales teams have fully replaced their human SDR function with AI. Another 55% are running AI-augmented workflows.

But here's the paradox the vendors won't tell you:

AI SDR tools churn at 50-70% annually β€” roughly double the turnover rate of the human reps they replace (UserGems). And Gartner predicts over 40% of agentic AI projects will be abandoned by 2027.

The root cause? A quality gap:

  • AI SDRs process 1,000+ contacts per day vs. 50-80 for a human rep (SuperAGI)
  • But AI SDRs convert meetings to opportunities at just 15% vs. 25% for human SDRs β€” a 40% performance gap (SuperAGI)
  • Response to inbound: AI responds in seconds. First responder wins deals at 5x the rate of slower competitors
  • Follow-up: 44% of human reps give up after one attempt. AI never stops following up

So AI wins on volume and consistency but loses on conversion quality. The teams getting the best results? They're not choosing one or the other.

AI SDR maturity spectrum in 2026

The Winning Formula: Augmentation Beats Replacement​

Across every study we analyzed, one pattern emerges consistently: AI-augmented teams outperform both fully automated and fully manual teams.

The adoption spectrum breaks down like this:

Approach% of TeamsPerformance
Full AI replacement22%High volume, lower quality
AI-augmented (human + AI)~55%Highest overall performance
AI-assisted (copilot only)~15%Moderate improvement
No AI~8%Falling behind

Source: Autobound AI SDR Buying Guide 2026, cross-referenced with Salesforce and Topo.io data

The augmented model works because it pairs AI's strengths with human strengths:

Where AI excels (let it run):

  • Prospect identification and research (synthesizing SEC filings, hiring data, social activity in seconds vs. 30-60 minutes per prospect for humans)
  • Consistent follow-up cadences (AI never forgets, never has a bad day)
  • After-hours and surge inbound handling
  • Lead scoring and signal prioritization
  • Data enrichment and contact discovery

Where humans still win (keep them in the loop):

  • Complex objection handling
  • Relationship building and trust development
  • Nuanced multi-stakeholder negotiations
  • Creative problem-solving for unique prospect situations
  • Reading tone and emotional context

The SignalFire team put it perfectly after testing AI SDR tools in production: "The most successful sales organizations of the future won't be the ones that replace their SDRs with AI. They'll be the ones who empower them with it."

What's Actually Delivering ROI: The Signal-First Approach​

Here's where the data gets prescriptive. Not all AI sales investments deliver equal returns.

Tier 1: Proven ROI (Invest Now)​

Intent signals + lead prioritization

  • Conversion rates rise 20-30% when companies integrate predictive AI into their marketing and sales workflows (Sopro)
  • Only 24% of teams with intent data report exceptional ROI β€” the difference is activation quality, not data quality (Autobound)
  • Signal-based prospecting generates 5.4x more pipeline with 33% fewer calls (from our prior signal quality analysis)

AI-powered research and personalization

  • AI research agents that surface job changes, funding events, and buying signals allow SDRs to write genuinely relevant outreach β€” not template spam
  • This is where the highest-performing AI-augmented teams invest first: give humans better information, not better email templates

Chatbots for inbound qualification

  • The most straightforward and valuable use case according to multiple studies
  • Responds to every inbound lead instantly, qualifies, and books meetings 24/7
  • Some teams report 25-30% uplift in conversion just from better lead qualification and scoring

Tier 2: Promising But Conditional (Pilot Carefully)​

AI-generated email sequences

  • Volume is up. Deliverability is down. The inbox is a battleground.
  • Generic mass-personalized emails (name swap + company swap) get deleted immediately
  • What works: AI that researches THEN personalizes, not AI that templates at scale
  • Rule of thumb: if the AI writes the email AND sends it without human review, expect lower quality meetings

AI cold calling / voice agents

  • Latency and robotic feel remain issues
  • The winning pattern: AI makes the dial, AI qualifies interest, then transfers to a human immediately upon positive signal
  • Legal risks (TCPA, consent, autodialer definitions) remain significant

Tier 3: Overhyped (Proceed With Caution)​

Full SDR replacement

  • The 50-70% churn rate tells you everything
  • The 40% meeting-to-opportunity quality gap means you're trading SDR salary for lower-quality pipeline
  • Works only for very specific use cases: high-volume, low-ACV, simple sales motions

AI forecasting as a standalone tool

  • Garbage in, garbage out. AI forecasting is only as good as your CRM hygiene
  • Most teams don't have clean enough data to make AI forecasting meaningful
  • Better to fix pipeline stage definitions first, then add AI on top

AI vs human SDR performance comparison 2026

The ERP Problem Nobody Talks About​

Deloitte's research surfaced a finding that most AI sales articles completely ignore.

87% of B2B suppliers are currently upgrading, preparing to begin, or planning ERP modernization within the next year. These projects are multi-million-dollar, multi-year initiatives that absorb the IT bandwidth that AI projects need.

As Deloitte's Paul do Forno noted: "They literally don't have the time. They need to get through the ERP running their business."

This means even when sales leaders want to deploy sophisticated AI, internal IT constraints are the real bottleneck β€” not budget, not skepticism, not technology readiness. The suppliers pulling ahead are the ones who pair AI deployment with (not after) their ERP modernization, building tighter front-to-back integration.

For sales teams at mid-market companies: don't wait for IT to finish the ERP migration before starting your AI pilot. Choose tools that sit alongside your existing stack rather than requiring deep integration. Start with standalone signal tools and AI research assistants that don't need CRM integration to deliver value.

The Conversion Math Most Teams Get Wrong​

Here's a framework from the data that most sales leaders miss.

The median B2B conversion rate across all industries is 2.9%, with most falling between 2.0% and 5.0% (Martal Group). But the real bottleneck isn't top-of-funnel β€” it's the middle.

MQL-to-SQL conversion: only ~15% of marketing-qualified leads convert to sales-qualified leads.

This means pouring more AI-generated leads into the top of your funnel without fixing the qualification gap just creates more waste. The highest-ROI AI investment for most teams isn't generating more leads β€” it's better qualifying the leads you already have.

This is where signal-based selling changes the equation:

  1. Visitor identification tells you WHO is on your site
  2. Intent signals tell you WHAT they care about
  3. A daily playbook tells your SDR exactly WHAT TO DO about it

Most AI sales tools give you step 1 and maybe step 2. Very few connect the signal to the action. That connection is where the 20-30% conversion lift actually comes from.

What to Do Monday Morning​

Based on our meta-analysis, here's the priority stack for sales leaders who want to be on the winning side of the AI divide:

If you're spending nothing on AI sales tools:

  1. Start with an AI chatbot for your website (instant ROI, low risk)
  2. Add a signal/intent tool to prioritize your existing pipeline
  3. Use AI research tools to enrich prospect profiles before outreach

If you're already using AI but not seeing results:

  1. Stop measuring emails sent. Start measuring meetings booked and pipeline generated
  2. Move from full automation to human-in-the-loop augmentation
  3. Invest in signal quality over outreach volume
  4. Fix your MQL-to-SQL conversion gap before adding more top-of-funnel

If you're seeing good results and want to scale:

  1. Build a daily SDR playbook that converts signals into specific next actions
  2. Layer first-party intent (website visitors, chatbot conversations) with third-party signals
  3. Consolidate your tool stack β€” the average SDR uses 7-12 tools, but the best teams use 3-4 integrated ones

The Bottom Line​

AI in B2B sales isn't hype β€” the 17-point revenue growth gap between AI-enabled and non-AI teams is real and widening. But how you deploy AI matters more than whether you deploy it.

The data is clear:

  • Augmentation beats replacement. Human + AI outperforms AI-only and human-only.
  • Signal quality beats outreach volume. Better leads beat more leads, every time.
  • Implementation quality is the variable. The technology works. The question is whether your team can operationalize it.
  • Start with signals, not sequences. Know who's buying before you decide what to send.

The teams winning in 2026 aren't the ones with the most sophisticated AI. They're the ones using AI to put the right signal in front of the right rep at the right time β€” and then letting the human do what humans do best.


Want to see signal-based selling in action? MarketBetter turns intent signals into a daily SDR playbook that tells your team exactly who to contact, how to reach them, and what to say. Book a demo β†’


Sources​

  1. Salesforce, State of Sales 2026
  2. Deloitte Digital, B2B Supplier Digital Maturity Study (Feb 2026)
  3. Martal Group, B2B Sales Statistics and Benchmarks 2026
  4. Sopro, 75 Statistics About AI in Sales and Marketing (2025)
  5. MarketsandMarkets, AI SDR Market Report (Aug 2025)
  6. Gartner, Strategic Predictions for 2026
  7. McKinsey, AI in Sales Performance (2025)
  8. HubSpot, State of AI in Sales (2025)
  9. SuperAGI, AI vs Traditional SDRs Performance Analysis
  10. Autobound, AI SDR Buying Guide 2026
  11. UserGems, Are AI SDRs Worth It? (2025)
  12. SignalFire, Expert Picks: AI SDR Tools (2026)
  13. Landbase, 35 B2B Sales Statistics (2026)
  14. Topo.io, AI SDR Adoption Survey (2025)
  15. Forrester, B2B Buyer Behavior (2026)
  16. Digital Commerce 360 / Deloitte Digital (Feb 2026)
  17. MarketsandMarkets / Fortune Business Insights projections
  18. Salesmate, AI Agent Adoption Statistics by Industry (2026)
  19. PwC, 2026 AI Business Predictions
  20. Netguru, AI Adoption Statistics (2025)

We Priced Out Every B2B Sales Stack in 2026 β€” Here's What Teams Actually Pay

Β· 14 min read
sunder
Founder, marketbetter.ai

B2B GTM stack cost breakdown for 2026

The average B2B SDR uses 4 to 10 different tools every day (Source: UpLead, 2025). That's 4–10 logins, 4–10 tabs, 4–10 invoices.

But here's the number nobody talks about: what does all of that actually cost?

Not the "starting at $49/mo" from landing pages. The real number β€” after annual commitments, per-seat fees, credit overages, add-ons, and the enterprise pricing wall that shows up the moment you ask for a demo.

We did the math. We pulled real pricing data from 15+ sales tools across six categories β€” CRM, sales engagement, intent data, enrichment, dialers, and AI SDR platforms β€” and calculated the true total cost of ownership (TCO) for SDR teams of different sizes.

The results aren't pretty.


The Six Categories Every SDR Stack Needs​

Before we get into the numbers, here's what a modern B2B sales development stack typically includes:

  1. CRM β€” Where deals live (HubSpot, Salesforce, Pipedrive)
  2. Sales Engagement β€” Sequence automation, email cadences (Outreach, SalesLoft, Apollo)
  3. Intent Data / Signals β€” Who's in-market right now (6sense, Bombora, MarketBetter)
  4. Data Enrichment β€” Contact info, firmographics (ZoomInfo, Cognism, Clearbit)
  5. Dialer β€” Calling at scale (Orum, Nooks, MarketBetter Smart Dialer)
  6. AI SDR / Automation β€” AI-assisted prospecting and outreach (11x, Artisan, MarketBetter AI)

Most teams cobble together one tool from each category. Some use two. A few brave souls try to use all-in-ones.

Let's price out each layer.


Layer 1: CRM β€” The Foundation You Can't Skip​

ToolStarting PriceMid-Market (5 Seats)Notes
HubSpot Sales Hub$20/user/mo (Starter)$500/mo (Professional)Professional tier required for sequences, automation
Salesforce Sales Cloud$25/user/mo (Essentials)$825/mo (Professional)Most teams need Professional at $165/user/mo
Pipedrive$14/user/mo$250/mo (Professional)Good value, but limited enterprise features
Close$49/user/mo$495/mo (Professional)Built-in calling β€” reduces dialer need

Realistic CRM cost for a 5-SDR team: $250–$825/mo

The gotcha with CRM pricing is that the "Starter" tier almost never has the features SDR teams need. Sequences, workflow automation, reporting dashboards β€” all gated behind Professional or Enterprise tiers. HubSpot's jump from $20/user to $100/user at Professional is the most dramatic.


Layer 2: Sales Engagement β€” Where the Bills Start Climbing​

This is where most SDR budgets blow up. Sales engagement platforms handle email sequences, call tasks, and multi-touch cadences.

ToolPer Seat/Month5-Seat Annual CostOur Deep Dive
Outreach$100–$150/user/mo$6,000–$9,000/yrFull pricing breakdown β†’
SalesLoft$83–$125/user/mo$5,000–$7,500/yrFull pricing breakdown β†’
Apollo$49–$79/user/mo$2,940–$4,740/yrFull pricing breakdown β†’
Instantly$30–$78/user/mo$1,800–$4,680/yrFull pricing breakdown β†’
Lemlist$32–$79/user/mo$1,920–$4,740/yrFull pricing breakdown β†’
SmartLead$39–$94/user/mo$2,340–$5,640/yrFull pricing breakdown β†’

Realistic sales engagement cost for a 5-SDR team: $250–$750/mo

The hidden cost here isn't the seat price β€” it's the annual commitment. Outreach and SalesLoft don't offer monthly contracts. You're signing a 12-month deal on day one, and renewal increases of 10–20% are standard.

Apollo is the budget-friendly option, but once you need advanced features (AI scoring, dialer, advanced analytics), you're back to $79/user/mo β€” which puts it on par with the "expensive" platforms.


Layer 3: Intent Data β€” The Most Expensive Layer Nobody Budgets For​

Intent data is where the sticker shock hits. These platforms tell you which accounts are actively researching solutions like yours. The problem? They price like it.

ToolStarting PriceMid-Market AnnualOur Deep Dive
6sense$25,000+/yr$40,000–$100,000/yrFull pricing breakdown β†’
Bombora$25,000+/yr$36,000–$60,000/yrEnterprise-only, no self-serve
ZoomInfo + Intent$15,000+/yr (base)$30,000–$60,000/yrFull pricing breakdown β†’
Common RoomCustom pricing$24,000–$48,000/yrFull pricing breakdown β†’
Warmly$700/mo$8,400–$15,000/yrFull pricing breakdown β†’
MarketBetter$500/mo$6,000–$18,000/yrBook a demo β†’

Realistic intent data cost for a 5-SDR team: $700–$5,000+/mo

Here's the uncomfortable truth about intent data pricing: you're paying for the signal, not the seat. 6sense and Bombora don't scale with your team size β€” they scale with your TAM size, data volume, and integration requirements. A 5-person SDR team at a mid-market company easily spends $40K–$60K/year on intent data alone.

This is also the category with the most buyer's remorse. According to G2 reviews, the #1 complaint about 6sense and Bombora is "hard to prove ROI." You're paying enterprise prices for data that your SDRs may or may not act on.

The consolidation opportunity is massive here. Tools like MarketBetter bundle visitor identification, intent signals, AND the SDR playbook that tells reps what to do with those signals β€” starting at a fraction of the standalone intent data cost. Learn more in our Complete Guide to B2B Intent Data.


Layer 4: Data Enrichment β€” The Credit Trap​

Enrichment tools provide contact details (emails, phone numbers, firmographics). They all look affordable until you run out of credits.

ToolStarting PriceReal Cost (5 SDRs)Our Deep Dive
ZoomInfo$15,000/yr (3 seats)$30,000–$60,000/yrFull pricing breakdown β†’
CognismCustom (est. $15K+/yr)$20,000–$40,000/yrMarketBetter vs Cognism β†’
Clearbit (now Breeze)Bundled with HubSpot$0 (if HubSpot) or $12K+/yr standaloneMarketBetter vs Clearbit β†’
ApolloIncluded in platform$2,940–$4,740/yrCredits-based, overages common
Clay$149–$800/mo$1,788–$9,600/yrFull pricing breakdown β†’

Realistic enrichment cost for a 5-SDR team: $250–$2,500/mo

ZoomInfo is the gorilla here. At $15K minimum (annual-only contracts), it's often the single most expensive tool in an SDR's stack. And that's the starting price β€” real-world costs typically land between $30K and $60K once you factor in credit overages and add-ons.

The credit model is designed to upsell. You start with 5,000 credits, burn through them in month two, and suddenly you're negotiating a mid-contract upgrade. Every enrichment vendor does this.


Layer 5: Dialer β€” Calling Isn't Dead, But It's Expensive​

SDR teams that do phone outreach (and the data says you should β€” cold calls convert at 2.0–3.5%) need a dedicated dialer.

ToolPer Seat/Month5-Seat AnnualNotes
Orum$200–$300/user/mo$12,000–$18,000/yrAI parallel dialer, premium tier
Nooks$150–$250/user/mo$9,000–$15,000/yrVirtual sales floor + dialer
PhoneBurner$127–$152/user/mo$7,620–$9,120/yrPower dialer, lower-end
Close (built-in)$0 extraIncluded with CRMBasic power dialer
MarketBetter Smart DialerIncluded$0 extraIncluded in platform β†’

Realistic dialer cost for a 5-SDR team: $0–$1,500/mo

Dialers are the category where consolidation pays off the most. If your CRM or sales engagement platform includes one, you save $9K–$18K/year. If you're paying for a standalone parallel dialer like Orum on top of Outreach on top of ZoomInfo... your per-SDR tooling cost is going to be eye-watering.

Check out our Best Sales Dialers for SDR Teams for a deeper comparison.


Layer 6: AI SDR Platforms β€” The New (Expensive) Category​

AI SDR tools promise to automate prospecting, personalization, and outreach. They're also the most aggressively priced category in 2026.

ToolStarting Price5-SDR EquivalentOur Deep Dive
11x (Alice)$50,000+/yr$50,000+/yrFull pricing breakdown β†’
Artisan (Ava)$750+/mo$9,000+/yrFull pricing breakdown β†’
MonacoCustomEst. $24,000+/yrMarketBetter vs Monaco β†’
UnifyCustomEst. $18,000+/yrMarketBetter vs Unify β†’
MarketBetter$500/mo$6,000/yrBook a demo β†’

Realistic AI SDR cost: $500–$4,000+/mo

The AI SDR category is the Wild West of pricing. 11x charges $50K+ per year for a single AI agent β€” roughly the cost of a junior human SDR. Artisan is more accessible but still commands $9K+ annually. Most of these tools are so new that pricing changes quarter to quarter.

The key question isn't "can AI replace my SDRs?" β€” it's "does the AI tool integrate with my existing stack, or is it yet another silo?" More on this in our Best AI SDR Tools comparison.


The Total: Three Real-World GTM Stacks, Priced Out​

GTM stack tier comparison β€” Budget vs Mid-Market vs Enterprise

Here's what it actually costs to equip a 5-SDR team in 2026, across three common configurations:

Stack A: "Bootstrap Budget" β€” $1,200–$2,400/mo​

CategoryToolMonthly Cost
CRMHubSpot Starter or Pipedrive$100–$250
Sales EngagementApollo or Instantly$200–$400
Intent DataMarketBetter (includes visitor ID + signals)$500
EnrichmentApollo (included) or Clay Starter$0–$150
DialerIncluded with MarketBetter$0
AI AutomationMarketBetter (included)$0
Total$800–$1,300/mo
Per SDR$160–$260/mo

This stack works for seed-stage and early Series A companies. The trade-off: you're running lean, which means your SDRs are doing more manual work β€” but your tooling cost per rep is under $260/mo.

Stack B: "Mid-Market Standard" β€” $3,500–$5,500/mo​

CategoryToolMonthly Cost
CRMHubSpot Professional or Salesforce$500–$825
Sales EngagementOutreach or SalesLoft$500–$750
Intent DataWarmly or MarketBetter Growth$700–$1,500
EnrichmentZoomInfo (basic) or Cognism$1,250–$2,000
DialerIncluded with Outreach or standalone$0–$500
AI AutomationNone or basic$0
Total$2,950–$5,575/mo
Per SDR$590–$1,115/mo

This is where most Series B and established mid-market companies land. The jump from Stack A is dramatic β€” enrichment alone can add $15K–$25K annually. And notice: no AI SDR automation. Most companies at this tier can't afford to layer AI on top of their existing stack.

Stack C: "Enterprise Full-Send" β€” $8,500–$15,000+/mo​

CategoryToolMonthly Cost
CRMSalesforce Enterprise$1,650+
Sales EngagementOutreach + Gong$1,500–$2,500
Intent Data6sense or Bombora$2,000–$5,000
EnrichmentZoomInfo Advanced$2,500–$5,000
DialerOrum or Nooks$1,000–$1,500
AI Automation11x or custom$1,000–$4,000
Total$9,650–$19,000/mo
Per SDR$1,930–$3,800/mo

Enterprise stacks routinely hit $100K–$200K+ per year for a 5-person SDR team. That's before headcount. A fully-loaded SDR (salary + tools + management overhead) at this tier costs the company $150K–$200K annually.

Read our outbound sales strategy guide for how to actually make this investment pay off.


The Tool Sprawl Tax: What Nobody Measures​

SDR tool sprawl β€” the hidden cost of too many tabs

Beyond the dollar cost, there's a productivity cost that's almost impossible to measure:

Context switching. Every time an SDR Alt-Tabs between ZoomInfo, Outreach, Salesforce, and Gong, they lose focus. Research from the American Psychological Association estimates that task-switching can consume up to 40% of productive time.

At the Optifai benchmark of 8–10 qualified meetings per month for a median SDR, that means 3–4 meetings per month are lost to tool friction alone.

Here's what that looks like in practice:

  • Step 1: Check intent signals in 6sense (Tab 1)
  • Step 2: Enrich the contact in ZoomInfo (Tab 2)
  • Step 3: Build a sequence in Outreach (Tab 3)
  • Step 4: Log the activity in Salesforce (Tab 4)
  • Step 5: Review the last call recording in Gong (Tab 5)
  • Step 6: Update the deal stage in your CRM (back to Tab 4)

Six steps, four tools, zero flow state.

This is why the industry is moving toward consolidation. Platforms that combine signals + engagement + dialer into one workflow β€” like what we've built at MarketBetter β€” eliminate the tab-switching tax and let SDRs stay in one place.

Our SDR Playbook Template Guide shows exactly how a consolidated workflow operates.


The Consolidation Math: Where the Real Savings Are​

Here's the financial case for stack consolidation, using real numbers:

Fragmented stack (Mid-Market Standard):

  • 5 tools Γ— 5 SDRs = 25 licenses to manage
  • Annual cost: $35,000–$67,000
  • Admin overhead: 1 RevOps person managing integrations (~$80K/yr fully loaded)
  • Total annual cost: $115K–$147K

Consolidated platform approach:

  • 1-2 tools Γ— 5 SDRs = 5–10 licenses
  • Annual cost: $10,000–$25,000
  • Admin overhead: Minimal (one platform, native integrations)
  • Total annual cost: $10K–$25K

Annual savings: $90K–$120K β€” enough to hire another SDR.

This isn't theoretical. Only 19% of companies increased SDR headcount in 2025 (Source: SaaStr), the lowest growth rate across all sales functions. Teams are consolidating tools and doing more with less.

The question isn't "which is the best tool in each category?" It's "which platform eliminates the most categories?"


Our Take: The Stack That Wins in 2026​

Based on our analysis of pricing across 15+ tools, here's what we'd recommend for a 5-SDR team targeting $500K–$5M ACV deals:

The essentials (pick your approach):

  1. CRM: HubSpot Professional ($500/mo) or Salesforce Professional ($825/mo) β€” you need a CRM, period
  2. Everything else: A consolidated platform that combines signals + engagement + dialer + AI

Why "everything else" should be one platform:

  • Intent data as a standalone category is dying. Bombora's third-party intent data is being questioned by the very teams that buy it
  • Sales engagement platforms (Outreach, SalesLoft) are adding AI features, but they don't have their own intent signals
  • Enrichment providers (ZoomInfo) are adding engagement features, but they're bolted on, not native
  • The winner is whoever combines signal detection + recommended action + execution in a single workflow

This is exactly what MarketBetter's Daily SDR Playbook does: identifies who's on your site, enriches the contact, surfaces the intent signal, and tells your SDR exactly what to do next β€” all in one screen. No tab-switching. No context loss. No $60K ZoomInfo invoice.

Start with our Best Sales Prospecting Tools guide to see how we compare across every category.


Methodology​

This analysis used pricing data from the following sources:

  • Official pricing pages (accessed February–March 2026)
  • Vendr marketplace data for enterprise negotiated rates
  • G2 and Capterra reviews mentioning specific price points
  • Reddit r/sales threads with real user-reported costs
  • Our own published pricing breakdowns (linked throughout)

All prices are in USD. "Per seat" pricing assumes annual billing unless noted. Enterprise quotes are estimated ranges based on multiple sources β€” actual quotes vary by company size, use case, and negotiation leverage.

For tool-specific deep dives, visit our pricing breakdown series:


Ready to Simplify Your Stack?​

If your SDR team is drowning in tools and your per-rep tooling cost is north of $1,000/mo, there's a better way.

MarketBetter combines visitor identification, intent signals, the daily SDR playbook, smart dialer, AI chatbot, and email automation β€” starting at $500/mo. One platform. One login. One invoice.

Book a demo β†’

Signal Quality vs. Speed to Lead: Why Calling First Doesn't Mean Closing First [2026]

Β· 12 min read
sunder
Founder, marketbetter.ai

Signal quality vs. speed: what actually predicts closed-won deals

Every sales leader has heard the stat: 78% of customers buy from the first company that responds.

It's cited in every speed-to-lead article, every sales enablement deck, and every cold calling training. It's become gospel.

But here's the problem with gospel β€” nobody questions it.

What if I told you that the obsession with speed-to-lead is creating a generation of SDR teams that are fast but blind? Teams that respond in under 5 minutes to every lead β€” including the ones that were never going to buy?

The real data tells a more nuanced story. Speed matters, but only when paired with signal quality. And most teams have the equation backwards.

The Speed-to-Lead Data Everyone Cites (And What It Actually Means)​

Let's start with what we know from the research:

  • 78% of customers buy from the first responder (MIT/InsideSales.com Lead Response Management Study)
  • Responding within 5 minutes = 21x more likely to qualify vs. 30 minutes (Harvard Business Review)
  • 391% more conversions when you respond within 1 minute vs. waiting (Velocify)
  • Average B2B response time: 42 hours (Drift/InsideSales.com)
  • 55% of companies take 5+ days to respond (Drift Lead Response Report)
  • 30% of leads never get contacted at all (Voiso)

These stats are real, well-sourced, and important. The speed-to-lead gap is massive β€” most companies are embarrassingly slow.

But they're missing context. Here's what the same research doesn't tell you:

What was the signal quality of those leads?

The MIT study measured response time against inbound demo requests β€” leads who explicitly raised their hand. Of course speed matters when someone says "I want to talk to you right now." That's peak intent.

But what about the lead who downloaded a whitepaper three weeks ago? The contact who visited your pricing page once at 2 AM? The MQL that marketing auto-scored because they opened two emails?

When you treat all leads the same β€” and race to respond to every single one in under 5 minutes β€” you create a different problem entirely.

The Hidden Cost of Speed Without Signals​

Here's what the speed-to-lead orthodoxy produces in practice:

The SDR Productivity Crisis​

According to Salesforce's State of Sales report and multiple industry benchmarks:

  • SDRs spend only 18-30% of their time actually selling (Salesforce)
  • 70% of rep time goes to administrative tasks, data entry, research, and internal meetings (Gartner)
  • 43% of reps report administrative work consuming 10-20 hours per week (HubSpot, 2024 Sales Trends)
  • 83.4% of SDRs fail to consistently hit quota (SaleSo SDR Productivity Report, 2025)
  • Only 57% of reps reached targets in 2024 β€” the lowest in five years (SaleSo)

The median SDR books 15 meetings per month. Top 25% hit 12-15 meetings/month, while the median sits at 8-10 (Optifai Pipeline Study, 2026, N=939 companies).

That means your average SDR is making 50-80 calls per day, sending 30-50 emails, and booking less than one meeting every two days.

The question isn't "how do we make them faster?" It's "how do we make them smarter about who they spend time on?"

Spray and pray vs. signal-first selling

The Signal Quality Framework: What Actually Predicts Close​

Speed to lead measures how fast you respond. Signal quality measures who you respond to and why. The best teams optimize for both.

Here's a framework based on how high-performing SDR teams (the ones consistently in the top 25%) actually prioritize their day:

Tier 1: Active Buying Signals (Respond in Under 5 Minutes)​

These are the leads where speed genuinely determines the outcome:

  • Demo requests and pricing inquiries β€” Someone explicitly asking to talk
  • Multiple stakeholders from the same account visiting your site in the same week
  • Champion job changes β€” A former customer just started at a new company
  • Return visitors hitting pricing + product pages in the same session
  • Chatbot conversations where the prospect asks about implementation or pricing

For Tier 1 signals, the 5-minute rule absolutely applies. These buyers are in active evaluation mode. Every minute of delay is a gift to your competitor.

Benchmark: Tier 1 signals should convert to meetings at 40-60% when contacted within 5 minutes.

Tier 2: Warm Intent Signals (Respond Within 1 Hour)​

These prospects are researching but haven't declared intent:

  • Repeat website visits over 2+ weeks (visitor identification data)
  • Email engagement spikes β€” opening 3+ emails in a sequence within 24 hours
  • Content consumption patterns β€” downloading case studies, ROI calculators, comparison guides
  • Social engagement β€” commenting on, sharing, or saving your posts
  • Technology evaluation signals β€” visiting integration pages, API docs, or security/compliance pages

For Tier 2, speed still matters but signal richness matters more. An SDR who calls within 30 minutes but references the specific case study the prospect downloaded will outperform one who calls in 2 minutes with a generic pitch.

Benchmark: Tier 2 signals should convert to meetings at 15-25% with personalized outreach within 1 hour.

Tier 3: Passive Signals (Next Business Day, Sequenced)​

These are early-stage awareness signals that most platforms incorrectly score as high-priority:

  • Single website visit with no return
  • One email open without a click
  • Downloaded a generic whitepaper (often just for the content, not for buying)
  • Liked a LinkedIn post once
  • Visited your blog from an organic search (researching the topic, not necessarily your product)

Chasing Tier 3 signals with immediate phone calls is where most SDR teams waste the majority of their day. These prospects aren't ready for a sales conversation. A multi-touch nurture sequence is the correct play.

Benchmark: Tier 3 signals convert to meetings at 2-5% regardless of speed. Don't burn your best reps here.

Tier 4: Noise (Don't Contact)​

Some "leads" in your CRM aren't leads at all:

  • Bot traffic triggering visitor identification
  • Competitors researching your product
  • Job seekers looking at your careers page
  • Students downloading content for research papers
  • Recycled leads that have been contacted 5+ times with no response

Filtering noise before it reaches your SDRs is one of the highest-leverage investments a sales team can make. Every minute spent on a non-lead is a minute stolen from a Tier 1 signal.

The Math That Changes Everything​

Let's model two SDR teams with identical resources β€” 5 reps, 40 hours/week each.

Team A: Speed-First (Typical Approach)​

  • Responds to every lead in under 5 minutes
  • Makes 60 calls/day per rep (industry average)
  • No signal prioritization β€” first in, first out
  • Connect rate: 8% (industry average for cold/warm blend)
  • Meeting conversion: 10% of connects

Monthly output: 5 reps Γ— 60 calls Γ— 20 days Γ— 8% connect Γ— 10% convert = 48 meetings

But wait β€” those 48 meetings include Tier 3 and Tier 4 leads. When you factor in meeting quality:

  • 40% are qualified (fit ICP and have budget/authority) = 19 qualified meetings
  • Pipeline from qualified meetings at $25K ACV Γ— 30% close rate = $142,500/month

Team B: Signal-First (Prioritized Approach)​

  • Responds to Tier 1 signals in under 5 minutes (20% of volume)
  • Responds to Tier 2 within 1 hour (30% of volume)
  • Sequences Tier 3 via automation (40% of volume)
  • Filters out Tier 4 entirely (10% of volume)
  • Makes 40 calls/day per rep (fewer calls, but targeted)
  • Connect rate: 18% (higher because prospects are warmer)
  • Meeting conversion: 22% of connects (higher because signal context enables personalization)

Monthly output: 5 reps Γ— 40 calls Γ— 20 days Γ— 18% connect Γ— 22% convert = 158 meetings

With better targeting, meeting quality jumps:

  • 65% are qualified = 103 qualified meetings
  • Pipeline: $25K ACV Γ— 30% close rate = $772,500/month

Team B generates 5.4x more pipeline with 33% fewer calls. The difference isn't speed. It's signal intelligence.

Why the MQL-to-SQL Gap Is Actually a Signal Quality Problem​

Remember the stat from the Martal Group benchmarks: only 15% of MQLs convert to SQLs. This is the single largest drop-off point in the B2B sales funnel.

Most teams diagnose this as a "qualification criteria" problem. They tighten lead scoring rules, adjust point thresholds, or add more demographic filters.

But the real issue is simpler: most MQLs are Tier 3 and Tier 4 signals being treated as Tier 1.

When a prospect downloads a whitepaper (Tier 3), marketing scores them as an MQL. The SDR calls within 5 minutes. The prospect is confused β€” they were just reading an article. The call goes nowhere. The MQL gets dispositioned as "not qualified."

The MQL wasn't bad. The prioritization was.

A signal-first approach would have:

  1. Noted the whitepaper download as a Tier 3 signal
  2. Added the prospect to a nurture sequence
  3. Waited for a Tier 2 signal (return visit, email engagement spike)
  4. Triggered SDR outreach only when the prospect showed genuine evaluation behavior

This single change β€” routing based on signal tier instead of lead score β€” can push MQL-to-SQL conversion from 15% to 30%+ by simply matching the right outreach to the right buyer stage.

Building a Signal-First SDR Operation​

If you're convinced that signal quality matters more than raw speed, here's how to operationalize it:

Step 1: Audit Your Current Signal Stack​

Map every signal source your team uses today:

Signal SourceSignal TypeCurrent PriorityShould Be
Demo formTier 1High βœ…High βœ…
Whitepaper downloadTier 3High ❌Low (sequence)
Website visit (1x)Tier 3Medium ❌Low (sequence)
Pricing page + product page same sessionTier 1Medium ❌High βœ…
Multi-stakeholder visits from same accountTier 1Not tracked ❌Highest βœ…
Champion job changeTier 1Not tracked ❌High βœ…
Email 3+ opens in 24hTier 2Not tracked ❌Medium βœ…
Competitor page visitTier 2Not tracked ❌Medium βœ…

Most teams will find that their highest-value signals aren't being tracked at all, while their lowest-value signals are generating the most SDR activity.

Step 2: Build Your Daily Playbook Around Signal Tiers​

Instead of a chronological call list, structure each SDR's day around signal priority:

First 2 hours: Tier 1 signals only β€” these are your money calls. Prepare personalization (30 seconds per call to review signal context), then dial immediately.

Next 2 hours: Tier 2 signals β€” slower, more consultative outreach. Reference their specific browsing behavior or content engagement. Send hyper-personalized emails that prove you know what they're evaluating.

Afternoon: Review and iterate β€” check which Tier 3 sequences are generating Tier 2 signals. Refine messaging based on morning conversations. Update your signal audit.

Automation handles: All Tier 3 nurture sequences and Tier 4 filtering β€” no human time spent.

Step 3: Measure Signal-Adjusted Metrics​

Stop measuring raw speed-to-lead as a single number. Break it down by signal tier:

MetricTier 1 TargetTier 2 TargetTier 3 Target
Response time<5 min<1 hourAutomated (same day)
Connect rate25%+15%+N/A (sequenced)
Meeting rate40%+15%+3-5% (from sequence)
Qualified rate60%+40%+20%+
Pipeline/meeting$30K+$20K+$15K+

This gives you a clear picture of where your pipeline actually comes from β€” and it's almost always Tier 1 and Tier 2 signals driving 80%+ of qualified revenue.

SDR daily playbook powered by intent signals

Step 4: Invest in Signal Infrastructure, Not More Reps​

The typical response to "we need more pipeline" is "hire more SDRs." But the data shows that adding reps to a broken prioritization system just multiplies the waste.

Instead, invest in the signal stack:

  • Website visitor identification β€” Know which companies are on your site and what pages they're viewing
  • Multi-stakeholder tracking β€” Detect when multiple people from the same company are researching you (this is the strongest buying signal in B2B)
  • Champion tracking β€” Get alerts when former customers or engaged contacts change jobs
  • Email intent analysis β€” Move beyond open rates to engagement pattern detection
  • AI-powered signal routing β€” Automatically tier signals and surface the right leads to the right reps at the right time

A single platform that handles signal detection, prioritization, and SDR workflows eliminates the biggest productivity drain: context switching between 7+ tools just to figure out who to call next.

The Bottom Line: Speed Is Table Stakes. Signal Intelligence Is the Advantage.​

The speed-to-lead research isn't wrong β€” it's incomplete.

Yes, you should respond to high-intent signals in under 5 minutes. Absolutely. The data on that is ironclad.

But treating all leads as equally urgent β€” blasting through a chronological call list as fast as possible β€” is the reason 83% of SDRs miss quota, 70% of their day is wasted on non-selling activities, and the average MQL-to-SQL conversion sits at a miserable 15%.

The teams that win in 2026 aren't just fast. They're intelligently fast. They use signal quality to decide who gets immediate attention and who goes into a nurture sequence. They build their daily playbook around buyer behavior, not lead score thresholds.

The shift from speed-first to signal-first isn't incremental. It's the difference between 19 qualified meetings a month and 103.

The first responder doesn't always win. The first informed responder does.


See Signal-First Selling in Action​

MarketBetter's Daily SDR Playbook automatically tiers your signals, surfaces your highest-priority prospects, and tells your reps exactly what to do next β€” before they open 20 browser tabs.

Book a demo β†’


Sources​

  • MIT/InsideSales.com Lead Response Management Study (Dr. James Oldroyd)
  • Harvard Business Review, "The Short Life of Online Sales Leads"
  • Velocify Lead Response Research
  • Drift/InsideSales.com Lead Response Report
  • Salesforce State of Sales Report
  • Gartner Sales Productivity Research
  • HubSpot 2024 Sales Trends Report
  • SaleSo SDR Productivity Report, 2025
  • Optifai Pipeline Study, 2026 (N=939 companies)
  • Martal Group B2B Sales Benchmarks, 2026
  • Voiso Lead Response Time Research

The AI SDR Due Diligence Checklist: 10 Questions That Separate $50K Mistakes from Pipeline Machines [2026]

Β· 13 min read
sunder
Founder, marketbetter.ai

The AI SDR market will hit $15 billion by 2030. Venture capital has poured over $400 million into AI SDR startups in the last two years alone. Every vendor claims their platform will "revolutionize your pipeline."

Here's the number they don't put on their landing page: 50-70% of AI SDR tools churn within a year β€” roughly double the turnover rate of the human reps they're supposed to replace.

That's not a market with a product problem. That's a market with a buying problem. Teams are evaluating AI SDRs on demo polish, feature checklists, and pricing instead of the questions that actually predict whether the tool will generate pipeline 12 months from now.

This checklist is built from patterns we've observed across dozens of B2B sales teams evaluating AI SDR platforms. It's designed to cut through vendor hype and surface the structural differences that determine whether you'll renew or churn.

AI SDR Due Diligence Checklist

Why Most AI SDR Evaluations Fail​

The typical evaluation process looks like this:

  1. VP of Sales sees a LinkedIn post about AI SDRs
  2. Team evaluates 3-4 vendors based on demos
  3. Signs an annual contract based on the best presentation
  4. Three months later, SDRs hate it, adoption stalls, meetings booked are garbage
  5. Churn at renewal

The root cause is almost always the same: the evaluation focused on what the tool does instead of what it produces.

A platform can send 10,000 emails a day. That's not a capability worth paying for β€” that's a liability. The question isn't volume. The question is: does it generate qualified meetings that close?

Here are the 10 questions that answer that.


Question 1: What Signals Does the Platform Actually Ingest?​

Why it matters: The quality of your outreach is capped by the quality of your signals. A platform that only uses static firmographic data (company size, industry, job title) is just a fancy email blaster. You need behavioral and intent signals.

What to ask:

  • Does it identify companies visiting your website? At what match rate?
  • Does it track individual-level behavior (pages viewed, time on site, return visits)?
  • Does it ingest third-party intent data (G2, Bombora, TrustRadius)?
  • Can it detect champion job changes (a key account contact moves to a new company)?
  • Does it monitor email engagement signals (opens, clicks, replies) in real time?

Red flag: If the vendor can't explain where their signals come from or says "we use AI to find intent," push harder. Intent data has a specific supply chain β€” Bombora panels, publisher co-ops, website pixel data. Vague answers mean vague signals.

Green flag: The platform layers multiple signal types (website visits + email engagement + third-party intent + job changes) and lets your team weight them based on your ICP.


Question 2: What Happens Between the Signal and the Action?​

This is the single most revealing question in any AI SDR evaluation. Most platforms stop at surfacing signals. They show you a dashboard of companies visiting your website or accounts showing intent. Then your SDR has to figure out what to do about it.

What to ask:

  • When a high-intent signal fires, what does the SDR see? A dashboard notification? A prioritized task? An auto-drafted email ready to send?
  • How does the platform prioritize which signals matter most today?
  • Does the SDR get a daily playbook β€” a ranked list of exactly who to contact, how, and why?
  • Or is it "here are your signals, good luck"?

Red flag: If the answer is "we surface the data and your team takes action," you're buying a dashboard, not an SDR platform. Dashboards don't book meetings. Workflows do.

Green flag: The platform converts signals into specific, sequenced actions β€” call this person, send this email, follow up on LinkedIn β€” ranked by likelihood to convert. Your SDR opens the app and knows exactly what to do for the next 8 hours.

The fundamental question: Does this platform tell my SDRs WHO to contact, or does it tell them WHO to contact AND WHAT TO DO NEXT?

Red Flags vs Green Flags in AI SDR Evaluation


Question 3: How Does Personalization Actually Work?​

Every AI SDR platform claims "hyper-personalization." This word has been beaten into meaninglessness. You need to understand the mechanics.

What to ask:

  • Show me a real email the platform generated. Not a cherry-picked example β€” pull one from a live campaign.
  • What data inputs does personalization draw from? (Company website? LinkedIn profile? Recent funding rounds? Technographic data? Or just {first_name} and {company}?)
  • Can the platform personalize based on the specific page a prospect visited on our website?
  • How does it handle accounts where enrichment data is thin?

Red flag: If "personalization" means inserting the prospect's name, company, and industry into a template, that's mail merge with a markup. GPT-4 can do that for $0.002 per email.

Green flag: Personalization is contextual β€” it references why you're reaching out (they visited your pricing page three times this week), what you can solve for them (based on their tech stack or hiring patterns), and how to frame the message (based on their role and the problems that role typically faces).


Question 4: What's the Real Match Rate on Visitor Identification?​

Website visitor identification is table stakes in 2026. But match rates vary wildly β€” from 15% to 70% β€” depending on the vendor's data partnerships, IP resolution methodology, and enrichment depth.

What to ask:

  • What's your average company-level match rate? (Honest answer: 30-65% depending on traffic mix)
  • What's your individual-level match rate? (Honest answer: 15-40%)
  • How do you handle VPN and remote worker traffic? (This is where most vendors' numbers collapse)
  • Can I run a match rate test on my own traffic before signing?

Red flag: A vendor claiming 90%+ match rates is either lying or counting "partial matches" (identified the ISP but not the company). Ask for a test on your traffic β€” not their demo data.

Green flag: The vendor is transparent about match rate ranges, explains their methodology, and offers a proof-of-concept on your actual website traffic. They should be able to tell you exactly how many of your monthly visitors they can identify.


Question 5: How Does the Dialer Work β€” and Do They Have One?​

Here's a dirty secret of the AI SDR market: most platforms don't have a dialer. They handle email and maybe LinkedIn. But research shows that responding to leads within 5 minutes makes you 21x more likely to qualify them. And phone is still the fastest channel for high-intent follow-up.

What to ask:

  • Does the platform include a built-in dialer, or do I need a separate tool?
  • Is the dialer connected to the same signal data that triggers emails and tasks?
  • Can my SDR see website visit history and email engagement before picking up the phone?
  • Does it support local presence dialing, call recording, and CRM logging?

Red flag: "We integrate with Aircall/Dialpad/RingCentral." Integration means context switching. Your SDR sees a signal in one tool, opens the dialer in another, and loses 3 minutes of context per call. Over a day, that's an hour of wasted time.

Green flag: The dialer is native to the platform, connected to the same signal and contact data that powers email sequences. When your SDR calls a prospect, they can see that the prospect visited the pricing page yesterday, opened the last email twice, and their company is on a G2 comparison page right now. That's a 45-second call prep instead of a 5-minute research session.


Question 6: What's the Actual Cost Per Meeting?​

Annual contract price is a vanity metric. Cost per qualified meeting is the number that matters.

What to calculate:

ComponentHow to Calculate
Platform costAnnual contract Γ· 12
SDR time costHours spent on platform Γ— fully-loaded hourly rate
Data costsAdditional enrichment, intent data, or dialer costs not included
Integration costsTime spent maintaining CRM sync, Zapier flows, etc.
Total monthly costSum of above
Qualified meetings/monthAsk vendor for customer benchmarks (not projections)
Cost per meetingTotal cost Γ· qualified meetings

What to ask:

  • What's the average cost per qualified meeting for customers in my segment?
  • Can you connect me with 3 references who will share their actual numbers?
  • What's the median time to first meeting booked?
  • What percentage of meetings booked through your platform progress to opportunity stage?

Red flag: If a vendor can't or won't share cost-per-meeting benchmarks from real customers, they either don't track it (bad) or the numbers aren't good (worse).

Green flag: The vendor shares real ROI data β€” not projections, not "potential" β€” from customers with similar team sizes and sales motions. The best vendors will confidently tell you: "Our average customer books X meetings per month at $Y per meeting."

ROI Calculation Framework for AI SDR Investment


Question 7: What Happens When a Key Contact Changes Jobs?​

Champion tracking is one of the highest-ROI capabilities in B2B sales. When a VP who championed your deal at Company A moves to Company B, that's a warm lead at a new account β€” but only if you catch it within the first 30 days.

What to ask:

  • Does the platform monitor job changes for contacts in my CRM?
  • How frequently is this data refreshed? (Daily? Weekly? Monthly?)
  • What happens when a change is detected? Does the SDR get a task, a drafted email, or just a notification?
  • Can it detect not just the contact who left, but the new person filling their role at the original company?

Red flag: "We integrate with LinkedIn Sales Navigator for job change alerts." That's not a feature β€” that's a browser tab.

Green flag: Champion tracking is built into the platform's signal engine. When a job change fires, the SDR gets a prioritized task with context: who moved, where they went, what they bought from you before, and a personalized outreach draft. The best platforms also flag the replacement hire at the original account as a retention risk.


Question 8: How Does the Platform Handle Email Deliverability?​

You can build the most personalized, signal-driven outreach in the world. If it lands in spam, it's worthless. Email deliverability is infrastructure, not a feature β€” and most AI SDR platforms treat it as an afterthought.

What to ask:

  • Does the platform manage domain warm-up and sender reputation?
  • How does it handle send limits across multiple mailboxes?
  • Does it support custom tracking domains to avoid shared domain blacklists?
  • What's the average inbox placement rate across your customer base?
  • If my domain gets flagged, what's the remediation process?

Red flag: If the vendor sends from a shared domain or shared IP pool, your deliverability is at the mercy of every other customer on that pool. One bad actor β€” or one customer blasting 10,000 cold emails a day β€” and your domain reputation tanks.

Green flag: The platform manages dedicated sending infrastructure per customer, includes warm-up automation, monitors bounce rates and spam complaints in real time, and automatically throttles send volume when deliverability signals degrade.


Question 9: What Does the SDR's Daily Experience Actually Look Like?​

This question is the adoption killer. If your SDRs don't use the platform every day, nothing else matters. And the reason most SDRs abandon AI tools isn't capability β€” it's UX.

What to ask:

  • Walk me through a typical SDR's first 30 minutes in the platform.
  • How many clicks does it take to go from "I just opened the app" to "I'm doing productive outreach"?
  • Can my SDRs do everything in one tab, or do they need to jump between your platform, CRM, dialer, and LinkedIn?
  • What does the daily playbook look like? Is it a list of prioritized tasks, or a dashboard they have to interpret?

Red flag: If the demo shows 6 different tabs, 3 dashboards, and a "powerful but flexible" interface that "your team can customize to their workflow" β€” your SDRs will use it for 2 weeks and go back to spreadsheets.

Green flag: The SDR opens the app, sees a ranked list of exactly what to do today (call this person, email this person, follow up on LinkedIn with this person), and can execute every action without leaving the platform. One tab. One workflow. Zero interpretation required.

The measure of a great SDR platform isn't what it can do. It's how little your SDR has to think about what to do next.


Question 10: What Breaks at Scale?​

Every platform works beautifully with 2 SDRs and 500 prospects. The question is what happens at 10 SDRs and 50,000 contacts.

What to ask:

  • How does the platform handle territory deduplication? (Two SDRs targeting the same account)
  • What happens when multiple SDRs have overlapping prospect lists?
  • How does it manage send volume across 10+ mailboxes without triggering deliverability issues?
  • Can I see reports broken down by SDR, territory, and campaign β€” not just aggregate numbers?
  • How does the platform handle multi-threading β€” multiple contacts at the same account getting sequenced simultaneously?

Red flag: "We handle dedup at the contact level." Contact-level dedup is table stakes. Account-level coordination is what matters. If two SDRs are simultaneously emailing different people at the same company with different messages, you look uncoordinated β€” and the prospect notices.

Green flag: The platform coordinates outreach at the account level, not just the contact level. It knows that SDR A is calling the VP of Sales at Acme while SDR B is emailing the Director of Marketing, and it spaces those touches to create a coordinated buying experience instead of an email barrage.


The 60-Second Evaluation Scorecard​

Before your next vendor call, rate each area 1-5:

QuestionScore (1-5)Notes
1. Signal quality and sources
2. Signal-to-action workflow
3. Personalization depth
4. Visitor ID match rate
5. Native dialer
6. Cost per meeting data
7. Champion tracking
8. Email deliverability infrastructure
9. SDR daily experience
10. Scale and coordination
Total/50

40-50: Strong contender. Move to pilot. 30-39: Decent platform with gaps. Negotiate pricing to reflect missing capabilities. 20-29: You'll be buying additional tools to fill gaps. Factor total cost of ownership. Below 20: Walk away. This platform will churn.


The Bottom Line​

The AI SDR market is flooded with tools that demo well and deliver poorly. The 50-70% annual churn rate isn't because AI doesn't work for sales β€” it's because most teams buy the wrong tool for the wrong reasons.

The right AI SDR platform doesn't just send more emails. It tells your SDRs exactly who to contact, why, and what to say β€” every single day. It turns signals into sequenced actions. It connects email, phone, and LinkedIn into a single workflow. And it produces a cost per meeting that justifies every dollar you spend.

Use this checklist. Score every vendor. Trust the math over the demo.

Your pipeline depends on it.


Want to see how MarketBetter scores against these 10 questions? Book a demo β†’

The B2B Dark Funnel: How to Capture the 73% of Buyers You Can't See [2026]

Β· 12 min read
sunder
Founder, marketbetter.ai

Your pipeline isn't broken. Your visibility is.

Right now, three out of four companies researching solutions like yours will never fill out a form, request a demo, or click your chatbot. They'll visit your pricing page at 11pm, read three comparison posts, check your G2 reviews, ask ChatGPT about your product β€” and then either buy from a competitor who spotted them first, or ghost entirely.

This invisible buying behavior is called the dark funnel. And in 2026, it's where the vast majority of your revenue lives.

The B2B Dark Funnel β€” Most of the buyer journey happens below the surface

The Data: Your Buyers Are Already Here (You Just Can't See Them)​

The gap between what B2B buyers actually do and what sellers can track has never been wider. Here's what the latest research reveals:

Buyers research anonymously longer than ever:

  • 73% of the B2B buying journey happens anonymously before a buyer ever contacts a vendor (6sense/Green Hat APAC Research)
  • 61% of B2B buyers prefer a completely rep-free buying experience (Gartner, 2025)
  • 83% of buyers fully define their purchase requirements before ever speaking with sales (6sense, 2025)
  • 92% of B2B buyers start their journey with at least one vendor already in mind (6sense, 2025)

AI is accelerating the invisible buying phase:

  • 94% of B2B buyers now use large language models (LLMs) during their buying process (6sense, 2025)
  • 72% of buyers encountered Google's AI Overviews during research, and 90% clicked through to at least one cited source (TrustRadius, 2025)
  • 35% of B2B buyers consult external influencers during their journey, expected to reach 50% by end of 2025 (Forrester, 2024)

And yet most companies still wait for form fills:

  • The average B2B lead response time is 42 hours β€” nearly two full business days (Kixie, 2025)
  • 78% of customers buy from the company that responds first (Gitnux, 2026)
  • Responding within 5 minutes makes you 21x more likely to qualify a lead versus waiting 30 minutes (InsideSales)

The math is devastating: 73% of buying happens where you can't see it, 83% of requirements are set before you're invited, and when a buyer finally does raise their hand, most teams take 42 hours to respond β€” by which point the buyer has already chosen someone faster.

What Exactly Is the Dark Funnel?​

The dark funnel is every interaction a potential buyer has with your brand β€” or your competitors' brands β€” that your marketing and sales tools can't track.

It includes:

  • Anonymous website visits β€” someone from a target account browses your pricing page, reads three blog posts, and leaves without filling anything out
  • AI-powered research β€” a VP of Sales asks ChatGPT to "compare the top SDR platforms for mid-market B2B companies" and your product either appears or it doesn't
  • Peer conversations β€” a Slack community, LinkedIn DM, or dinner conversation where someone says "we switched to X and our meetings booked doubled"
  • Review site browsing β€” reading G2, TrustRadius, and Capterra reviews without creating an account or clicking a CTA
  • Social media lurking β€” scrolling past your LinkedIn posts, watching your team's content, absorbing positioning without engaging
  • Content consumption β€” downloading ungated PDFs, watching YouTube videos, reading comparison articles on third-party sites

Traditional analytics captures maybe 27% of the journey: the form fills, demo requests, direct inquiries, and tracked email clicks. The other 73%? Completely invisible to most sales teams.

Why the Dark Funnel Is Growing (Not Shrinking)​

Three forces are making the dark funnel larger every year:

1. Buyers Trust AI More Than Sales Reps​

With 94% of buyers using LLMs during their research, the role of the sales rep has fundamentally shifted. Buyers don't need someone to explain features β€” they've already asked Claude or ChatGPT to compare your product against five alternatives. They show up to sales calls pre-convinced (or pre-rejected), having formed opinions in channels you never see.

This means the selling often happens before you know a deal exists.

2. Buying Committees Are Now Buying Networks​

The old model of a defined buying committee (economic buyer, technical evaluator, end user) has been replaced by fluid buying networks. A 6sense study found that decision dynamics have evolved β€” stakeholders pull in peers from different departments, external advisors, and AI agents to inform their choices.

These conversations happen in private Slack channels, on LinkedIn, in industry communities, and during peer dinners. Your CRM will never log them.

3. Privacy Regulations Remove Traditional Tracking​

GDPR, CCPA, and the slow death of third-party cookies have systematically eliminated the tracking mechanisms that marketers relied on for a decade. Retargeting pools are smaller. Attribution is muddier. The easy days of pixel-based tracking are over.

The Signal Stack: How to See Into the Dark Funnel​

You can't track every buyer interaction. But you can build a signal stack that illuminates enough of the dark funnel to act on.

The B2B Signal Stack β€” Layers of buyer intelligence

Think of it as three layers:

Layer 1: Website Visitor Identification (Foundation)​

This is the most actionable signal you can capture. When a company visits your website, visitor identification technology reveals who they are β€” even without a form fill.

What you learn:

  • Which companies are on your site right now
  • Which pages they're visiting (pricing, competitor comparisons, case studies)
  • How many people from the same company are visiting
  • Whether they're returning or visiting for the first time

Why it matters: A company visiting your pricing page three times in a week is a buying signal as strong as a demo request β€” you just never see it without visitor ID.

The key differentiator: Most visitor ID tools stop at identification. The best ones tell you what to do next β€” which accounts to prioritize, what message to send, and when to reach out. Identification without action is just a more interesting dashboard.

Layer 2: Intent Signals (Context)​

Visitor ID tells you WHO is looking. Intent signals tell you WHY.

Sources of intent data:

  • First-party intent: Pages visited, time on site, content downloaded, return frequency
  • Third-party intent: Content consumption across the web on topics related to your product category
  • Technographic signals: Tech stack changes, job postings, and funding events that indicate buying readiness
  • Champion tracking: When a previous customer or champion changes jobs, they often bring their preferred tools to the new company

Layering intent on top of visitor ID transforms a generic "Acme Corp visited your site" into "Acme Corp's VP of Sales visited your pricing page, read your competitor comparison with Outreach, and their company posted three SDR job listings this week."

Layer 3: Action Triggers (Execution)​

Signals without action are just noise. The top layer of the stack turns intelligence into specific, timed outreach:

  • Daily prioritized playbook: Instead of sorting through 200 accounts, your team gets the 10 accounts most likely to buy today, ranked by signal strength
  • Automated sequences: When a high-fit account hits a signal threshold (visited pricing + read comparison + returning visitor), trigger a personalized outreach sequence automatically
  • Real-time alerts: When a champion changes jobs, when a target account returns to your site, or when a competitor's customer shows dissatisfaction β€” your team knows immediately

Signal-Based Selling vs. Traditional Response

The Math That Changes Everything​

Let's put real numbers to the dark funnel problem:

Typical B2B SaaS website:

  • 10,000 monthly visitors
  • 2% form fill rate = 200 known leads
  • 9,800 visitors leave anonymously

With website visitor identification (40-60% match rate):

  • 10,000 monthly visitors
  • 200 form fills (same)
  • 4,000-6,000 companies identified from anonymous traffic
  • 20-30x more pipeline opportunities

With signal-based prioritization:

  • Of those 4,000-6,000 identified companies, maybe 200-400 show genuine buying signals (multiple visits, pricing page views, competitive research patterns)
  • Each of those is as qualified as a form fill β€” often more so, because they've done deeper research

Now apply speed-to-lead data:

  • Responding to these signals in under 5 minutes makes you 21x more likely to qualify them
  • 78% of buyers choose the vendor that responds first
  • Reducing response from 42 hours to under 1 hour increases conversions by 7x

The compound effect: 20x more opportunities Γ— 7x better conversion rate = a fundamentally different pipeline.

5 Plays to Capture Dark Funnel Revenue Today​

Play 1: Deploy Visitor Identification on Day One​

If you're running a B2B website without visitor identification, you're flying blind. This is the single highest-ROI investment in your go-to-market stack.

What to look for in a solution:

  • Match rate above 40% (anything below isn't worth the investment)
  • Company-level AND contact-level identification
  • Integration with your CRM and outreach tools
  • Actionable output β€” not just data, but recommended next steps

Common mistake: Buying visitor ID and treating it like another analytics dashboard. If your reps aren't acting on the data within 24 hours, it's wasted.

Play 2: Build a Signal-Based Daily Playbook​

Kill the "spray and pray" outreach model. Instead of giving SDRs a static list of 200 accounts and saying "go call," build a signal-based daily playbook that prioritizes the 10-15 accounts showing active buying behavior.

The playbook should answer three questions every morning:

  1. Who should I contact first? (ranked by signal strength)
  2. What should I say? (context from their research behavior)
  3. Which channel should I use? (email, phone, LinkedIn β€” based on engagement patterns)

Teams using signal-based playbooks consistently report 2x higher meeting-booked rates because reps are calling companies that are actually in-market, not just on a list.

Play 3: Win the AI Visibility War​

94% of your buyers are using AI to research solutions. If your product doesn't show up in AI-generated answers, you're invisible during the fastest-growing phase of the buyer journey.

Tactical steps:

  • Publish comprehensive, data-rich content that AI models cite (original research, comparison guides, "best X tools" lists)
  • Ensure your product appears on review sites (G2, TrustRadius, Capterra) with recent, authentic reviews β€” AI models heavily weight these
  • Monitor what AI says about your product. Ask ChatGPT, Claude, and Gemini "What are the best [your category] tools?" regularly and see where you rank
  • Create content specifically for the "messy middle" β€” comparison pages, pricing breakdowns, alternative lists β€” because that's what buyers ask AI about

Play 4: Activate Champion Tracking​

When someone who used your product at their previous company changes jobs, they're the warmest possible lead at their new company. This signal is pure gold, and most teams ignore it entirely.

Set up alerts for:

  • Job changes from current customers to new companies
  • LinkedIn activity from power users at churned accounts
  • Hiring patterns at target accounts (posting for roles that indicate need for your product)

A champion at a new company converts 3-5x faster than a cold prospect because trust already exists. The dark funnel conversation happened before they even changed jobs β€” they were already telling their new team about you.

Play 5: Compress Response Time to Under 5 Minutes​

Even after you identify dark funnel signals, most teams still take hours to act on them. That delay is the last leak in your pipeline.

Implement:

  • Automated alerts when high-value accounts hit signal thresholds
  • Pre-built outreach templates that reference the buyer's actual research behavior (not generic "I noticed you visited our website")
  • Round-robin routing that instantly assigns identified accounts to available reps
  • AI-powered chatbots that engage returning visitors in real-time, even outside business hours

Remember: reducing response time from 24 hours to 1 hour increases SaaS conversions by 360%. From 8 hours to under 5 minutes? The numbers get even more dramatic.

The Bottom Line: You Don't Have a Lead Gen Problem​

If you're getting 10,000 monthly website visitors but only 200 leads, you don't have a traffic problem or a lead generation problem. You have a visibility problem.

73% of your buyer's journey is happening right now β€” on your website, in AI conversations, on review sites, in peer networks β€” and you can't see any of it.

The companies that will win in 2026 aren't the ones with the biggest ad budgets or the most SDRs. They're the ones that can see into the dark funnel and act before anyone else does.

The technology exists today. The data proves it works. The only question is whether you'll implement it before your competitors do.


Ready to see who's actually on your website? MarketBetter identifies anonymous visitors, surfaces buying signals, and tells your SDRs exactly who to contact and what to say β€” every morning. Book a demo β†’

B2B Outbound Sales Strategy Guide for 2026: The Playbook That Actually Works

Β· 12 min read
sunder
Founder, marketbetter.ai

B2B outbound sales strategy for 2026 β€” the complete guide

Outbound sales isn't dying. Bad outbound is dying.

The spray-and-pray era is officially over. In 2026, sending 500 generic emails per day and hoping for 2 replies isn't a strategy β€” it's spam. Cold calling from a random list without context isn't prospecting β€” it's harassment.

But signal-driven, multi-channel outbound? It's generating more pipeline than ever for teams who do it right.

This guide is the playbook we've seen work across hundreds of B2B SDR teams. Not theory β€” execution.

Why Most Outbound Strategies Fail in 2026​

Before we build the playbook, let's autopsy the ones that don't work:

Failure mode 1: Volume over relevance​

The old way: Buy a list of 10,000 contacts. Blast a 5-email sequence. Celebrate 0.3% reply rate.

Why it fails now: Email deliverability algorithms have evolved. ESPs like Google and Microsoft now use engagement signals (opens, replies, complaints) to determine inbox placement. High-volume, low-engagement sending tanks your domain reputation. Your emails land in spam. Your domain gets blacklisted. Game over.

Failure mode 2: Single-channel dependence​

The old way: Email-only outbound. Maybe LinkedIn InMail as a "multi-channel" afterthought.

Why it fails now: Decision-makers average 300+ emails per day. Your cold email competes with 50 other vendors, 100 internal emails, and an AI assistant that's pre-filtering their inbox. Email alone can't cut through.

Failure mode 3: No signal, all spray​

The old way: Target anyone who matches your ICP. Company size, industry, title β€” that's the targeting.

Why it fails now: ICP fit is necessary but not sufficient. You need timing signals β€” is this person actually in-market right now? Reaching the right person at the wrong time is the same as reaching the wrong person.

Failure mode 4: Manual everything​

The old way: SDRs manually research each prospect, write each email, log each activity, update the CRM, and figure out who to call next.

Why it fails now: An SDR who spends 70% of their time on non-selling activities can't compete with one who spends 70% selling. AI has made the manual approach a competitive disadvantage, not just an inefficiency.


The 2026 Outbound Sales Playbook: 7 Steps​

Step 1: Define Your ICP With Signal Layers​

Your Ideal Customer Profile needs three layers, not one:

Layer 1: Firmographic fit (table stakes)

  • Industry, company size, revenue range, geography
  • Technology stack (what tools do they already use?)
  • Growth stage (funding, hiring velocity, expansion signals)

Layer 2: Behavioral signals (timing)

  • Visiting your website (website visitor identification)
  • Engaging with competitor content
  • Searching for solutions you provide (intent data)
  • Job postings for roles your product supports
  • Champion movement (former customer changed companies)

Layer 3: Contextual triggers (relevance)

  • Recent funding round
  • New executive hire (especially VP Sales, CRO, CMO)
  • Merger/acquisition
  • Conference attendance
  • Product launch or expansion into new markets

Most teams stop at Layer 1. The best teams combine all three to create a dynamic ICP that surfaces prospects who are ready to buy right now β€” not just companies that could theoretically buy someday.

How to implement this:

  • Use a website visitor identification tool (like MarketBetter) to capture Layer 2 signals automatically
  • Set up Google Alerts and LinkedIn Sales Navigator alerts for Layer 3 triggers
  • Score leads based on signal density: firmographic fit + behavioral signal + contextual trigger = highest priority

Step 2: Build a Multi-Channel Sequence Architecture​

The days of "5-email cadence" are over. Modern outbound requires coordinated touches across 3-4 channels:

The Channel Stack:

ChannelStrengthBest For
EmailScale, async, trackableFirst touch, follow-ups, content sharing
PhoneImmediacy, rapportHigh-priority prospects, post-engagement follow-up
LinkedInProfessional context, social proofWarm-up, relationship building, research
Direct mail/giftingMemorability, pattern interruptEnterprise prospects, exec-level outreach

Sequence architecture that works:

Day 1: LinkedIn connection request (personalized note)
Day 2: Email #1 (problem-focused, not product-focused)
Day 3: Phone call #1 (reference the email)
Day 5: LinkedIn comment on their recent post
Day 7: Email #2 (case study or relevant data point)
Day 10: Phone call #2 (voicemail if no answer)
Day 12: Email #3 (direct ask for 15 minutes)
Day 15: LinkedIn message (different angle)
Day 20: Email #4 (breakup email)
Day 25: Phone call #3 (final attempt)

Key principles:

  • Never lead with product. Lead with a problem you've seen in their industry.
  • Each touch adds new information. Don't repeat yourself across channels.
  • Phone follows email. "Hey, I sent you something yesterday about [topic]" is 3x more effective than a cold call with no context.
  • LinkedIn warms up email. Prospects who've seen your LinkedIn activity are 5x more likely to reply to your email.

Step 3: Personalize at Scale (Without Spending 30 Minutes Per Email)​

Personalization at scale is the holy grail of outbound. Here's the framework:

The 3-Layer Personalization Model:

Layer 1: Segment-level (60% of emails)

  • Customized by industry + role + company size
  • Template-based with dynamic variables
  • Takes 0 minutes per email (automated)

Layer 2: Account-level (30% of emails)

  • References specific company news, technology, or pain points
  • Semi-automated with AI research assistance
  • Takes 2-3 minutes per email

Layer 3: Person-level (10% of emails)

  • References individual posts, career moves, mutual connections
  • Fully manual, reserved for highest-value prospects
  • Takes 5-10 minutes per email

The mistake most teams make: Trying to do Layer 3 for every email. That's unsustainable. Instead, batch your prospects:

  • Tier 1 (top 10%): Full Layer 3 personalization β€” these are your dream accounts
  • Tier 2 (middle 30%): Layer 2 personalization β€” good fit, worth the extra effort
  • Tier 3 (bottom 60%): Layer 1 personalization β€” ICP fit but no strong signals yet

This tiered approach lets a single SDR effectively work 200-300 prospects per month while maintaining quality for the highest-value targets.

Step 4: Use AI to Eliminate Non-Selling Activities​

The average SDR spends their day like this:

  • 30% researching prospects
  • 20% writing and personalizing emails
  • 15% logging activities in CRM
  • 10% figuring out who to call next
  • 5% scheduling meetings
  • 20% actually selling (calls, emails, conversations)

That's 80% non-selling activity. AI in 2026 can compress most of that:

AI for research: Tools like MarketBetter's Daily Playbook automatically research prospects and surface relevant talking points. What used to take 15 minutes per prospect now takes 15 seconds.

AI for email personalization: AI drafts personalized emails based on prospect data, company news, and engagement history. SDRs review and send, not write from scratch.

AI for activity logging: Modern platforms auto-log emails, calls, and LinkedIn touches. Zero manual CRM updates.

AI for prioritization: Instead of SDRs deciding who to call, AI scores and ranks prospects based on intent signals, engagement, and fit. The rep opens their dashboard and sees a prioritized task list.

AI for call coaching: Real-time coaching during calls β€” suggest responses, flag competitor mentions, surface relevant case studies.

The result: SDRs flip from 20% selling time to 60%+ selling time. Same headcount, 3x output.

Step 5: Nail Your Messaging Framework​

Most outbound emails fail because they talk about the product instead of the problem. Use the PAS framework:

Problem β†’ Agitation β†’ Solution

Bad email (product-focused):

Hi Sarah, I'm reaching out from [Company]. We offer an AI-powered sales platform with visitor identification, email automation, and a smart dialer. Would you like to see a demo?

Good email (problem-focused):

Hi Sarah, I noticed [Company] has 8 open SDR positions. Scaling from 5 to 13 reps usually means one thing: your current process breaks. The playbooks that worked with 5 reps β€” manual research, gut-feel prioritization, ad-hoc follow-ups β€” fall apart at 13.

We helped [Similar Company] go through the same transition. They went from 20 tabs per rep to a single daily task list. Reply rates went up 40% while the team doubled.

Worth 15 minutes to see how they did it?

The difference: The first email tells Sarah about you. The second email tells Sarah about Sarah. Prospects don't care about your features β€” they care about their problems.

Messaging frameworks by buyer persona:

PersonaPrimary PainMessage Angle
VP SalesSDR productivity, pipeline coverage"Your SDRs spend 70% of their time NOT selling"
SDR ManagerRep ramp time, activity quality"New reps at full productivity in 2 weeks, not 2 months"
RevOpsData quality, tool sprawl"Replace 5 tools with one platform"
CROPipeline predictability, CAC"Cut cost-per-meeting by 40%"

Step 6: Measure What Matters (Not What's Easy)​

Most SDR teams measure the wrong things:

Vanity metrics (stop tracking these):

  • Emails sent per day
  • Calls made per day
  • LinkedIn connections per week
  • Activities logged

Leading indicators (track these daily):

  • Positive reply rate (not just reply rate β€” a "no thanks" isn't a win)
  • Conversations started (two-way exchanges, not one-way sends)
  • Meetings booked per rep per week
  • Meeting show rate
  • Pipeline created from outbound ($)

Efficiency metrics (track these weekly):

  • Activities per meeting booked (lower is better)
  • Time from first touch to meeting (shorter is better)
  • Sequence completion rate (are reps actually running the full cadence?)
  • Channel conversion rates (which channels drive meetings for YOUR ICP?)

The north star metric: Cost per qualified meeting

This single number captures everything β€” rep efficiency, targeting accuracy, messaging effectiveness, and tool investment. Calculate it:

(SDR salary + tool costs + data costs) / meetings booked per month = cost per meeting

If you're spending $10,000/mo (loaded SDR cost) and booking 15 qualified meetings, your cost per meeting is $667. The best teams get this under $300.

Step 7: Build Feedback Loops That Compound​

The difference between good and great outbound teams is their speed of iteration:

Weekly sequence reviews:

  • Which sequences have the highest positive reply rates?
  • Which email in the sequence gets the most engagement?
  • Where do prospects drop off?
  • What objections keep coming up?

Monthly ICP validation:

  • Are the meetings we're booking converting to pipeline?
  • Which segments have the highest conversion rates?
  • Should we expand or narrow our targeting?

Quarterly strategy reviews:

  • Is our cost per meeting trending down?
  • Are new channels worth testing?
  • How has the competitive landscape shifted?
  • Do we need to adjust our messaging framework?

The compounding effect: Teams that run weekly sequence reviews for 6 months typically see 2-3x improvement in reply rates. Each iteration makes the next one more effective.


The Outbound Tech Stack for 2026​

The minimum viable outbound tech stack:

CategoryToolPurpose
SDR PlatformMarketBetterDaily playbook, visitor ID, email, dialer
CRMHubSpot or SalesforceSystem of record
DataApollo or ZoomInfoContact enrichment when needed
LinkedInSales NavigatorAccount research, social selling

The ideal stack eliminates category overlap. If your SDR platform includes a dialer, don't buy a separate dialer. If it includes email sequences, don't layer on Outreach. Tool sprawl is the enemy of SDR productivity.

For a deeper comparison of SDR tools, see our guide to the best AI SDR tools for 2026.


Common Outbound Mistakes (And How to Fix Them)​

Mistake 1: Giving up too early​

The data: 80% of deals require 5+ touches before a prospect engages. Most SDR teams give up after 3.

The fix: Build sequences with 10+ touches across multiple channels. The breakup email (touch 8-10) often gets the highest reply rate because it creates urgency.

Mistake 2: Same sequence for everyone​

The data: Segmented sequences outperform generic ones by 38% in reply rates.

The fix: Build at least 3 sequence variants β€” one per tier/persona. A VP Sales doesn't respond to the same message as an SDR Manager.

Mistake 3: Ignoring warm signals​

The data: Prospects who visited your website are 7x more likely to take a meeting than cold prospects.

The fix: Build a separate, accelerated sequence for warm prospects (website visitors, content engagers, event attendees). These should get touches within hours, not days.

Mistake 4: Not aligning outbound with marketing​

The data: Companies with aligned sales and marketing teams see 38% higher win rates.

The fix: Share marketing's content calendar with the SDR team. When marketing runs a campaign about [topic], SDRs should be reaching out to prospects interested in that topic.

Mistake 5: Hiring more SDRs instead of enabling existing ones​

The data: Improving SDR efficiency by 30% is equivalent to adding 3 reps to a team of 10 β€” without the salary, ramp time, or management overhead.

The fix: Before hiring, maximize the output of your current team with better tools, better data, and better processes. Often, 5 enabled SDRs outperform 10 unsupported ones.


The Bottom Line​

Outbound sales in 2026 rewards precision over volume, signals over spray, and AI-augmented reps over brute-force headcount. The playbook is:

  1. Layer your ICP with firmographic fit + behavioral signals + contextual triggers
  2. Coordinate across channels β€” email, phone, LinkedIn, gifting
  3. Personalize in tiers β€” deep for dream accounts, efficient for the rest
  4. Deploy AI for the 80% that isn't selling
  5. Lead with problems, not products
  6. Measure cost per meeting, not activities
  7. Iterate weekly on sequences, messaging, and targeting

The teams that win at outbound in 2026 aren't sending more emails. They're sending better emails to the right people at the right time.


Ready to see how AI-powered outbound actually works? Book a demo with MarketBetter and see how the Daily SDR Playbook turns intent signals into booked meetings β€” automatically.

How to Personalize Sales Gifts That Actually Book Meetings

Β· 10 min read
sunder
Founder, marketbetter.ai

How to personalize sales gifts that actually book meetings

Your prospect's inbox has 127 unread emails. Your cold call went to voicemail. Your LinkedIn connection request is sitting in a queue of 40+ pending invitations.

Then a package arrives at their desk. A book they've been meaning to read β€” one that's eerily relevant to a challenge they mentioned in a recent LinkedIn post. With a handwritten note that references their keynote at last month's conference.

They respond within the hour.

This is the power of personalized sales gifting. Not swag. Not branded mugs with your logo. Not generic gift cards sent to a list of 500 people. Genuinely personalized gifts that demonstrate you've done your homework and care about the person, not just the deal.

It works because of a principle as old as human psychology: reciprocity.

The Psychology of Why Gifting Works in Sales​

The Reciprocity Principle​

Robert Cialdini's research on influence identified reciprocity as one of the six fundamental principles of persuasion. When someone gives us something β€” especially something thoughtful and unexpected β€” we feel a deep, almost unconscious obligation to reciprocate.

In sales, this translates directly:

  • Reachdesk data shows that personalized gifts like champagne or cupcakes can boost close rates by 19% and generate up to 447% more opportunities
  • eGifts (coffee cards, lunch vouchers) increase booked meetings and can boost response rates by 212% (Reachdesk, 2025)
  • Sendoso reports that corporate gifts can accelerate the sales cycle by 50%

The key word is personalized. A $10 Starbucks gift card sent to 500 people triggers no meaningful reciprocity. A $15 book that directly relates to something the prospect cares about creates a genuine connection.

The Endowment Effect​

Once someone receives a physical gift, they own it. The endowment effect means people value things they possess more than identical things they don't. A prospect who has your thoughtful gift on their desk feels a connection to you that a 100-word email can never create.

Pattern Interruption​

In a world of digital-only outreach, a physical gift breaks the pattern. It's unexpected. It demands attention in a way that email #47 from another sales rep doesn't. Your prospect has to physically interact with it β€” open the package, read the note, decide what to do with the gift.

That moment of attention is worth more than 50 cold emails.

When to Send Gifts in the Sales Cycle​

Timing matters more than budget. Here's when gifting creates the most leverage:

1. Pre-Meeting (Highest ROI)​

Goal: Get the meeting booked.

Send a small, personalized gift before asking for time. This is the highest-ROI use of gifting because it transforms a cold outreach into a warm one.

What works:

  • $10-$25 value range
  • eGift cards (coffee, lunch) tied to a personal message
  • A relevant book with a note explaining why you chose it
  • Something related to their hobby or interest (visible from LinkedIn)

Example:

Hi Sarah, I noticed from your LinkedIn that you're a runner training for the Austin Marathon β€” that's awesome. Sent you a $15 credit for [running nutrition brand]. Thought of you when I saw it.

Separately β€” I work with VPs of Marketing at companies like [similar company] who are struggling with [specific problem]. Would love to share what we're seeing. 15 minutes this week?

2. Post-Demo Follow-Up​

Goal: Stay top-of-mind during the evaluation period.

After a good demo or discovery call, a gift reinforces the positive experience and keeps you memorable during the decision process.

What works:

  • $25-$50 value range
  • Something tied to a personal detail from the conversation
  • A "thank you for your time" framing (not transactional)

3. Re-Engagement (Stalled Deals)​

Goal: Restart a conversation that's gone quiet.

When a prospect ghosts after seeming interested, a gift provides a natural reason to re-engage without being pushy.

What works:

  • $15-$30 value range
  • Light, no-pressure framing
  • "Thought of you when I saw this" positioning

4. Celebration Moments​

Goal: Build relationship equity.

Job promotions, company milestones, work anniversaries, and birthdays are natural gifting moments that build goodwill without any sales pressure.

What works:

  • $20-$50 value range
  • Congratulatory framing
  • No sales ask β€” pure relationship building

How to Personalize Gifts That Resonate​

Generic gifts fail. Personalized gifts work. Here's how to personalize at scale:

Step 1: Research the Prospect​

Before choosing a gift, spend 5-10 minutes on research:

LinkedIn profile:

  • Recent posts and articles (what topics do they care about?)
  • Activity (what have they liked or commented on?)
  • About section (personal interests, values)
  • Volunteer experience (causes they care about)
  • Education (alma mater, continuing education)

Twitter/X:

  • Tweets and retweets (interests, opinions, humor style)
  • Bio (hobbies, roles, identities)

Company news:

  • Recent funding, product launches, awards
  • Blog posts they've written
  • Podcast appearances

Step 2: Match Gift to Person​

Based on your research, choose a gift that connects to something personal:

SignalGift IdeaCost
Posts about running/fitnessRunning nutrition, race entry, fitness book$15-$40
Coffee enthusiast (mentions, photos)Specialty coffee subscription (1 month)$15-$25
Recent book recommendationThe book they mentioned wanting to read$15-$30
Dog owner (photos on social)Premium dog treats or toy$15-$25
Foodie (restaurant posts)Gift card to a highly-rated local restaurant$25-$50
Tech/gadget enthusiastInteresting tech accessory$20-$40
Parent (mentions kids)Fun family experience gift card$25-$50
Sustainability advocateEco-friendly brand gift card$15-$30
Just got promotedCongratulatory book on leadership$15-$25
Mentioned a specific challengeBook that addresses that challenge$15-$20

Step 3: Write the Note​

The note matters more than the gift. It should:

  1. Reference something specific (not "I saw your LinkedIn" but "your post about the challenges of scaling a content team really resonated")
  2. Explain why you chose this gift ("thought of you when I saw this because...")
  3. Be genuinely warm (not corporate, not transactional)
  4. Include a soft CTA (not "let's schedule a demo" but "would love to hear your perspective on [topic]")

Good note example:

Sarah β€” Loved your post about the challenges of building a marketing attribution model from scratch. Reminded me of this book (Chris Mercer's "Digital Marketing Measurement") that completely changed how we think about attribution. Hope you enjoy it as much as I did. Would love to pick your brain on how you're approaching it at [Company]. β€” [Your name]

Bad note example:

Hi Sarah, I'm reaching out from [Company]. We help businesses like yours improve marketing performance. I'd love to schedule a demo. Enjoy this gift card. β€” [Your name]

How to Scale Personalized Gifting​

"This sounds great, but I can't research every prospect for 10 minutes and hand-pick a gift."

Fair. Here's how to scale:

Tier Your Accounts​

Not every prospect gets the same treatment:

  • Tier 1 (Top 10-20 accounts): Fully personalized research + custom gift + handwritten note. Spend 15-20 minutes per prospect.
  • Tier 2 (Next 50-100 accounts): Personalized from LinkedIn data + curated gift options + personalized digital note. Spend 5 minutes per prospect.
  • Tier 3 (100+ accounts): AI-personalized recommendations + eGift + templated-but-customized message. Spend 2 minutes per prospect.

Use AI to Speed Up Research​

This is where MarketBetter's GiftDM Copilot transforms the workflow.

How GiftDM Copilot works:

  1. Enter a prospect's name, company, or LinkedIn URL
  2. AI researches the prospect β€” analyzing LinkedIn activity, company context, and public information
  3. Get AI-generated gift recommendations personalized to that specific prospect
  4. Get draft LinkedIn DMs tailored to their interests and role
  5. Send the gift and message with confidence that it'll resonate

What would take 15 minutes of manual research takes 30 seconds with AI.

Gift Fulfillment Platforms​

Once you know what to send, you need a way to send it:

  • Sendoso β€” Largest gifting platform with warehouse fulfillment. Integrates with Salesforce, HubSpot, Outreach. Enterprise pricing ($$$).
  • Reachdesk β€” European-focused gifting with good personalization features. From ~$3/gift.
  • Postal.io β€” Direct mail and gifting platform with marketplace. Plans from $49/month.
  • Tremendous β€” Digital rewards and gift cards at scale. Low per-gift costs.
  • Amazon directly β€” For books and specific items, send directly via Amazon wish list or gift shipment. No platform cost.

For most SDR teams, starting with Amazon + a handwritten note or digital gift cards + a personalized LinkedIn DM is enough. You don't need a $10K/year gifting platform to get started.

Gift Ideas That Work (Organized by Budget)​

Under $15​

  • Coffee gift card ($10 Starbucks/local shop) β€” universal, safe
  • eBook β€” Kindle gift of a relevant book
  • DoorDash/UberEats credit ($10-$15) β€” "lunch is on me"
  • Charity donation in their name (for prospects who value social impact)

$15-$30​

  • Physical book β€” always wins when well-chosen
  • Specialty coffee/tea β€” a step up from Starbucks
  • Desk plant (small succulent) β€” memorable and lasting
  • Quality notebook (Moleskine, Leuchtturm) β€” practical and appreciated

$30-$50​

  • Experience gift β€” cooking class, wine tasting (via platforms like Tinggly)
  • Premium food gift β€” artisanal chocolate, local bakery delivery
  • Personalized item β€” custom bookmark, engraved pen
  • Restaurant gift card to a place near their office

$50+ (Executive/Tier 1 only)​

  • Premium wine or spirits β€” for celebrating milestones
  • Masterclass subscription β€” educational and personal
  • High-quality tech accessory β€” noise-canceling earbuds, wireless charger
  • Curated gift box β€” themed around their interests

Measuring Gifting ROI​

Track these metrics to prove gifting works:

Response Rate Lift​

Compare response rates on gifted vs. non-gifted outreach sequences. Expect a 2-5x improvement.

Meeting Booking Rate​

Track meetings booked per gift sent. Good targets:

  • eGifts ($10-$15): 10-20% meeting rate
  • Physical gifts ($25-$50): 20-35% meeting rate
  • Premium gifts ($50+): 30-50% meeting rate

Pipeline Attribution​

Tag deals in your CRM that started with a gift touchpoint. Track:

  • Pipeline generated from gifting
  • Win rate on gift-sourced deals vs. non-gift deals
  • Average deal size comparison
  • Sales cycle length comparison

Cost Per Meeting​

Calculate: Total gifting spend Γ· meetings booked. If you spend $500 on 25 gifts at $20 each and book 5 meetings, your cost per meeting is $100 β€” likely cheaper than most paid channels.

Common Mistakes to Avoid​

1. Leading with the Gift, Not the Person​

The gift should feel like a natural extension of a genuine interest in the person. If it feels transactional ("here's a gift card, now take my meeting"), it backfires.

2. Over-Spending​

A $100 gift to a stranger can feel uncomfortable or even ethically questionable. Keep initial gifts in the $10-$30 range. Save bigger gifts for established relationships.

3. Generic Swag​

Company-branded merchandise is fine for customers and event attendees. For cold prospects, it screams "I'm trying to sell you something" and goes straight in the trash.

4. No Follow-Up​

A gift without a conversation is wasted. Always follow up within 2-3 days of delivery with a low-pressure message referencing the gift.

5. Ignoring Company Gifting Policies​

Many enterprises have policies about accepting gifts from vendors. Keep values modest and position gifts as "a book recommendation" or "coffee on us" rather than formal corporate gifts to avoid policy friction.

Get Started: Personalize Your First Gift in 60 Seconds​

Pick your most important prospect right now. The one you've been trying to reach for weeks.

Open MarketBetter's GiftDM Copilot β†’

Enter their name and company. In seconds, you'll get:

  • AI-researched insights about the prospect
  • Personalized gift recommendations
  • Draft LinkedIn DMs ready to send

No signup required. Free to use.


Build your complete prospecting workflow: find target companies with our Lookalike Finder, identify buyer contacts with the AI Lead Generator, and personalize your outreach with GiftDM Copilot. All free.

Automating Competitor Intelligence with AI Agents [2026]

Β· 8 min read
MarketBetter Team
Content Team, marketbetter.ai

Your competitors shipped a new feature yesterday. Changed their pricing page last week. Hired a new VP of Sales three days ago.

You probably didn't notice. Neither did your sales team.

By the time your quarterly competitive review catches up, your reps have already lost deals they could have won.

There's a better way.

Competitor Intelligence Dashboard

This guide shows you how to build an AI-powered competitive intelligence system that:

  • Monitors competitor websites, job postings, and content 24/7
  • Analyzes changes and identifies what matters
  • Delivers actionable alerts to your sales team
  • Updates battle cards automatically
  • Costs under $100/month to run

Let's build it.

Why Traditional Competitive Intelligence Fails​

The Quarterly Review Problem​

Most companies do competitive analysis quarterly (if that). By the time insights reach sales, they're stale.

A competitor drops pricing? Your reps find out mid-deal when the prospect mentions it.

A competitor launches a new integration? Your AEs get blindsided on calls.

The "Someone Should Watch This" Problem​

Everyone agrees someone should monitor competitors. Nobody has time. It falls between rolesβ€”not quite marketing, not quite sales enablement, not quite product.

The Tool Problem​

Enterprise competitive intelligence platforms (Crayon, Klue, Kompyte) cost $15-40K annually. For mid-market companies, that's hard to justify.

Meanwhile, the data you need is publicly available. You just need a system to watch it.

The AI Agent Approach​

Instead of paying for enterprise tools or relying on manual monitoring, we'll build an AI agent that:

  1. Scrapes competitor websites on a schedule
  2. Detects changes automatically
  3. Analyzes whether changes matter
  4. Routes insights to the right people
  5. Updates your competitive assets

Total cost: Hosting ($10/month) + AI API calls ($30-80/month)

Competitor Intelligence Automation

What to Monitor​

Tier 1: High-Impact, Low-Noise​

Monitor daily. These changes almost always matter.

SourceWhat to TrackWhy It Matters
Pricing pageAny changesDirect impact on competitive positioning
Product pageNew featuresShapes competitive conversations
LeadershipNew hiresSignals strategic priorities
Funding newsRaises, acquisitionsChanges competitive dynamics

Tier 2: Medium-Impact​

Monitor weekly. Filter for relevance.

SourceWhat to TrackWhy It Matters
Job postingsHiring patternsReveals investment areas
BlogNew contentShows messaging evolution
IntegrationsNew partnershipsMay open/close deals
Customer storiesNew logosValidates market positioning

Tier 3: Context Enrichment​

Monitor monthly. Background intelligence.

SourceWhat to TrackWhy It Matters
Review sitesG2/Capterra reviewsReal user sentiment
Social mediaLinkedIn, TwitterCompany culture, positioning
PatentsNew filingsLong-term product direction
Conference talksSpeaking engagementsThought leadership themes

Architecture: Building the System​

Here's how the pieces fit together:

β”Œβ”€β”€β”€β”€β”€β”€β”€β”€β”€β”€β”€β”€β”€β”€β”€β”€β”€β”€β”€β”€β”€β”€β”€β”€β”€β”€β”€β”€β”€β”€β”€β”€β”€β”€β”€β”€β”€β”€β”€β”€β”€β”€β”€β”€β”€β”€β”€β”€β”€β”
β”‚ MONITOR LAYER β”‚
β”‚ β”Œβ”€β”€β”€β”€β”€β”€β”€β”€β”€β”€β” β”Œβ”€β”€β”€β”€β”€β”€β”€β”€β”€β”€β” β”Œβ”€β”€β”€β”€β”€β”€β”€β”€β”€β”€β”€β”€β”€β”€β”€β”€β”€β”€β” β”‚
β”‚ β”‚ Website β”‚ β”‚ Job Site β”‚ β”‚ News/Social β”‚ β”‚
β”‚ β”‚ Scraper β”‚ β”‚ Scraper β”‚ β”‚ Aggregator β”‚ β”‚
β”‚ β””β”€β”€β”€β”€β”¬β”€β”€β”€β”€β”€β”˜ β””β”€β”€β”€β”€β”¬β”€β”€β”€β”€β”€β”˜ β””β”€β”€β”€β”€β”€β”€β”€β”€β”¬β”€β”€β”€β”€β”€β”€β”€β”€β”€β”˜ β”‚
β””β”€β”€β”€β”€β”€β”€β”€β”Όβ”€β”€β”€β”€β”€β”€β”€β”€β”€β”€β”€β”€β”Όβ”€β”€β”€β”€β”€β”€β”€β”€β”€β”€β”€β”€β”€β”€β”€β”€β”Όβ”€β”€β”€β”€β”€β”€β”€β”€β”€β”€β”€β”˜
β”‚ β”‚ β”‚
β–Ό β–Ό β–Ό
β”Œβ”€β”€β”€β”€β”€β”€β”€β”€β”€β”€β”€β”€β”€β”€β”€β”€β”€β”€β”€β”€β”€β”€β”€β”€β”€β”€β”€β”€β”€β”€β”€β”€β”€β”€β”€β”€β”€β”€β”€β”€β”€β”€β”€β”€β”€β”€β”€β”€β”€β”
β”‚ CHANGE DETECTION β”‚
β”‚ (Compare to previous snapshot) β”‚
β””β”€β”€β”€β”€β”€β”€β”€β”€β”€β”€β”€β”€β”€β”€β”€β”€β”€β”€β”€β”€β”€β”€β”€β”¬β”€β”€β”€β”€β”€β”€β”€β”€β”€β”€β”€β”€β”€β”€β”€β”€β”€β”€β”€β”€β”€β”€β”€β”€β”€β”˜
β”‚
β–Ό
β”Œβ”€β”€β”€β”€β”€β”€β”€β”€β”€β”€β”€β”€β”€β”€β”€β”€β”€β”€β”€β”€β”€β”€β”€β”€β”€β”€β”€β”€β”€β”€β”€β”€β”€β”€β”€β”€β”€β”€β”€β”€β”€β”€β”€β”€β”€β”€β”€β”€β”€β”
β”‚ AI ANALYSIS LAYER β”‚
β”‚ β”Œβ”€β”€β”€β”€β”€β”€β”€β”€β”€β”€β”€β”€β”€β”€β”€β”€β”€β”€β”€β”€β”€β”€β”€β”€β”€β”€β”€β”€β”€β”€β”€β”€β”€β”€β”€β”€β”€β”€β”€β”€β”€β”€β” β”‚
β”‚ β”‚ Claude: Is this change significant? β”‚ β”‚
β”‚ β”‚ If yes β†’ What does it mean? β”‚ β”‚
β”‚ β”‚ β†’ Who should know? β”‚ β”‚
β”‚ β”‚ β†’ How to update battle cards? β”‚ β”‚
β”‚ β””β”€β”€β”€β”€β”€β”€β”€β”€β”€β”€β”€β”€β”€β”€β”€β”€β”€β”€β”€β”€β”€β”€β”€β”€β”€β”€β”€β”€β”€β”€β”€β”€β”€β”€β”€β”€β”€β”€β”€β”€β”€β”€β”˜ β”‚
β””β”€β”€β”€β”€β”€β”€β”€β”€β”€β”€β”€β”€β”€β”€β”€β”€β”€β”€β”€β”€β”€β”€β”€β”¬β”€β”€β”€β”€β”€β”€β”€β”€β”€β”€β”€β”€β”€β”€β”€β”€β”€β”€β”€β”€β”€β”€β”€β”€β”€β”˜
β”‚
β–Ό
β”Œβ”€β”€β”€β”€β”€β”€β”€β”€β”€β”€β”€β”€β”€β”€β”€β”€β”€β”€β”€β”€β”€β”€β”€β”€β”€β”€β”€β”€β”€β”€β”€β”€β”€β”€β”€β”€β”€β”€β”€β”€β”€β”€β”€β”€β”€β”€β”€β”€β”€β”
β”‚ DELIVERY LAYER β”‚
β”‚ β”Œβ”€β”€β”€β”€β”€β”€β”€β”€β”€β”€β” β”Œβ”€β”€β”€β”€β”€β”€β”€β”€β”€β”€β” β”Œβ”€β”€β”€β”€β”€β”€β”€β”€β”€β”€β”€β”€β”€β”€β”€β”€β”€β”€β” β”‚
β”‚ β”‚ Slack β”‚ β”‚ Email β”‚ β”‚ Notion/Docs β”‚ β”‚
β”‚ β”‚ Alerts β”‚ β”‚ Digest β”‚ β”‚ (Battle Cards) β”‚ β”‚
β”‚ β””β”€β”€β”€β”€β”€β”€β”€β”€β”€β”€β”˜ β””β”€β”€β”€β”€β”€β”€β”€β”€β”€β”€β”˜ β””β”€β”€β”€β”€β”€β”€β”€β”€β”€β”€β”€β”€β”€β”€β”€β”€β”€β”€β”˜ β”‚
β””β”€β”€β”€β”€β”€β”€β”€β”€β”€β”€β”€β”€β”€β”€β”€β”€β”€β”€β”€β”€β”€β”€β”€β”€β”€β”€β”€β”€β”€β”€β”€β”€β”€β”€β”€β”€β”€β”€β”€β”€β”€β”€β”€β”€β”€β”€β”€β”€β”€β”˜

Step-by-Step Implementation​

Step 1: Set Up OpenClaw​

OpenClaw is the orchestration layer that keeps everything running.

# Install OpenClaw
npm install -g openclaw

# Initialize workspace
openclaw init competitor-intel

Step 2: Configure Competitors​

Create a configuration file listing what to monitor:

{
"competitors": [
{
"name": "Competitor A",
"monitors": {
"pricing": "https://competitor-a.com/pricing",
"product": "https://competitor-a.com/product",
"blog": "https://competitor-a.com/blog/rss",
"jobs": "https://competitor-a.com/careers"
},
"keywords": ["enterprise", "pricing", "integration"]
},
{
"name": "Competitor B",
"monitors": {
"pricing": "https://competitor-b.com/pricing",
"product": "https://competitor-b.com/features"
},
"keywords": ["startup", "free tier", "API"]
}
],
"schedule": {
"pricing": "daily",
"product": "daily",
"blog": "daily",
"jobs": "weekly"
}
}

Step 3: Build the Monitoring Agent​

Your OpenClaw agent needs instructions for what to do:

## Daily Competitor Check (runs at 8 AM)

1. For each competitor in config:
- Fetch current pricing page
- Compare to stored snapshot from yesterday
- If changed:
a. Use Claude to analyze: "What pricing change was made and why does it matter?"
b. Assess urgency (1-10)
c. If urgency > 5, send immediate Slack alert
d. Update pricing snapshot

2. Fetch current product/features pages
- Compare to stored snapshot
- If changed:
a. Use Claude to analyze: "What new feature was announced? How does it compare to our offering?"
b. Add to weekly digest
c. Flag if it affects any active deals

3. Check for new blog posts
- Summarize any new posts
- Identify messaging themes
- Add to weekly digest

Step 4: Write the Analysis Prompts​

The AI analysis layer is where the magic happens. Here are the prompts:

For pricing changes:

A competitor has changed their pricing page.

OLD VERSION:
[previous snapshot]

NEW VERSION:
[current snapshot]

Analyze:
1. What specifically changed? (prices, plans, features, packaging)
2. Why might they have made this change?
3. How does this affect our competitive positioning?
4. What should sales reps say when this comes up?
5. Urgency score (1-10) for alerting the team

Be specific and actionable.

For feature launches:

A competitor has updated their product page.

OLD VERSION:
[previous snapshot]

NEW VERSION:
[current snapshot]

Analyze:
1. What new feature or capability was added?
2. How does it compare to our equivalent feature?
3. What objections might this create in sales conversations?
4. Suggested talking points for AEs
5. Should we update our battle card? What specifically?

Step 5: Configure Delivery​

Set up how insights reach your team:

Immediate Slack alerts for:

  • Pricing changes
  • Major feature launches
  • Executive departures/hires
  • Funding announcements

Weekly email digest for:

  • New blog posts and messaging themes
  • Job posting patterns
  • Minor product updates
  • Review site sentiment

Auto-updated documents for:

  • Battle cards (append new information)
  • Competitive matrix (update feature checks)
  • Objection handling guides

Step 6: Deploy and Test​

Run the system manually first to verify it works:

# Test the monitoring agent
openclaw run competitor-intel --once

# Check the output
openclaw logs competitor-intel

Then enable scheduled runs:

# Enable daily schedule
openclaw cron add "competitor-intel" --schedule "0 8 * * *"

Real Output Examples​

Pricing Change Alert​

🚨 COMPETITOR PRICING CHANGE: Acme Corp

**What changed:**
- Pro plan increased from $49/user/month to $59/user/month
- Removed "unlimited integrations" from Starter plan (now limited to 3)
- Added new "Enterprise Plus" tier at $199/user

**Why it matters:**
They're pushing mid-market customers toward higher tiers. This creates
an opportunity with prospects who value integration flexibility.

**Talking points:**
- "I noticed Acme just limited integrations on their Starter plan.
How many integrations does your team need?"
- "Our pricing includes unlimited integrations at every tier."

**Urgency: 8/10** β€” Affects active deals in evaluation stage.

Weekly Competitive Digest​

πŸ“Š WEEKLY COMPETITIVE INTEL DIGEST
Week of Feb 1-7, 2026

## Acme Corp
- Published 3 blog posts focused on "enterprise security"
- Hiring: 2 enterprise AEs, 1 solutions architect
- New customer story: Major Financial Corp
- Interpretation: Pushing upmarket, invest in enterprise positioning

## Beta Solutions
- Launched API v2 with webhook support
- Pricing unchanged
- Job postings down 15% vs. last month
- Interpretation: Product investment continues, may be tightening budget

## ACTION ITEMS
1. Update Acme battle card with enterprise security section
2. Review our API docs to highlight webhook capabilities
3. Schedule deep-dive on Acme's new customer win

View full details: [link to detailed report]

Advanced: Competitive Deal Intelligence​

Take it further by connecting competitive intel to active deals:

## Deal-Level Competitive Alerts

When a competitor is mentioned in:
- Meeting notes (from Gong/Chorus integration)
- Email threads (from CRM)
- Deal notes

Trigger:
1. Pull relevant competitive intel for that competitor
2. Generate deal-specific battle card
3. Send to deal owner via Slack
4. Add context to deal record in CRM

Example output:

βš”οΈ COMPETITIVE DEAL ALERT: Acme Corp mentioned

**Deal:** Enterprise Solutions Inc ($125,000)
**Stage:** Evaluation
**Competitor mentioned:** Acme Corp (in latest meeting notes)

**Recent Acme Intel:**
- Raised pricing 20% last month
- New enterprise security features launched
- Lost 2 deals to us in similar segment

**Suggested approach:**
1. Lead with integration flexibility (their new weak point)
2. Emphasize total cost of ownership over 3 years
3. Offer POC to de-risk their decision

**Battle card:** [link]

Cost Breakdown​

ComponentMonthly Cost
OpenClaw hosting (VPS)$10
AI API calls (Claude)$30-50
Web scraping (if needed)$10-20
Total$50-80

vs. Enterprise competitive intelligence: $15,000-40,000/year

Common Pitfalls​

1. Monitoring Too Much​

Start with 3 competitors and 2-3 sources each. Expand only after proving value.

2. Alert Fatigue​

Not every change matters. Train your AI analysis layer to filter aggressively.

3. No Action Items​

Insights without recommended actions get ignored. Every alert should answer "so what?"

4. Stale Battle Cards​

Auto-updating documents sounds good but can create confusion. Use append-only updates with clear timestamps.

Free Tool

Try our Tech Stack Detector β€” instantly detect any company's tech stack from their website. No signup required.

Getting Started This Week​

Day 1: List your top 3 competitors and their key pages Day 2: Set up OpenClaw and configure monitoring Day 3: Write your analysis prompts Day 4: Test with manual runs Day 5: Deploy automated schedule

By Friday, you'll have a competitive intelligence system that works while you sleep.


Your competitors are watching you. Now you can watch them backβ€”automatically.

Want to add visitor identification to your competitive strategy? MarketBetter shows you when competitor customers visit your siteβ€”and what they're researching. Book a demo β†’

10 Actionable Voice of the Customer Examples to Drive Revenue in 2026

Β· 27 min read

Voice of the Customer (VoC) isn't just a collection of quotes; it's a strategic asset. While most companies gather feedback, few know how to turn raw customer comments into tangible actions that improve sales workflows, reduce churn, and directly impact the bottom line. This disconnect between feedback and action often leaves sales teams frustrated and valuable insights buried in spreadsheets.

This guide provides a deep dive into 10 actionable voice of the customer examples, moving beyond surface-level analysis to deliver a strategic blueprint. For each example, we'll break down the original feedback, compare its strategic value against other VoC types, and provide a replicable framework for analysis and action. You will get concrete, step-by-step instructions on how to transform qualitative data into quantifiable results.

You’ll learn not only what to listen for but exactly how to translate that insight into measurable improvements, especially for B2B sales teams drowning in administrative work and disconnected tools. We'll explore how modern platforms like marketbetter.ai use these very signals to create prioritized, context-rich tasks that transform raw feedback into an efficient sales engine. Instead of just collecting data, you'll learn to activate it, making every customer comment a potential catalyst for growth. This listicle is your tactical guide to turning customer sentiment into your most powerful sales and demand generation tool.

1. NPS Comment: Task Inbox Reduces Admin Burden​

Net Promoter Score (NPS) surveys are a powerful Voice of the Customer (VoC) tool, but their true value lies in the qualitative comments that accompany the scores. For SaaS companies like MarketBetter, which offers sales engagement platforms, a comment attached to a high score (9 or 10) provides a direct line into the user's perception of value. This specific example highlights how a feature, the "Task Inbox," directly addresses a critical pain point: administrative overload for Sales Development Representatives (SDRs).

Prioritized task inbox with admin time allocation and a background of multiple open digital documents.

When an SDR writes, "The new task inbox is a game-changer. I’m saving at least an hour a day on admin and can focus on my actual calls," this isn't just feedback; it's a quantifiable ROI statement. It validates the product's "execution-first" workflow and gives marketing and sales teams a powerful, authentic message to use in their campaigns.

Strategic Analysis & Actionable Insights​

Analyzing this type of VoC data goes beyond simple satisfaction tracking. It’s about segmenting feedback to drive targeted improvements and marketing efforts.

  • Actionable Step: Immediately follow up with promoters who leave detailed comments. Ask them, "Could you share a specific example of how this feature saved you time this week?" This turns a general comment into a specific, powerful testimonial you can use in marketing materials.
  • Strategic Comparison: While a CSAT survey might tell you if a user is happy at that moment, an NPS comment reveals the reason for their long-term loyalty. This is more strategically valuable for identifying sticky features that drive retention, unlike a support ticket which often focuses on a point-in-time problem.
  • Feature Adoption & Impact: Track NPS trends immediately following a new feature release. A spike in promoter scores directly linked to comments about that feature confirms successful product-market fit and validates the development roadmap. Use this data to justify further investment in similar workflow enhancements.

Key Takeaway: Treat high-scoring NPS comments as mini-case studies. Follow up with these promoters to gather more detailed testimonials, quantify their success, and understand the core drivers of user retention and advocacy. This is one of the most direct voice of the customer examples you can leverage for growth.

2. Customer Quote: Dialer Integration Solves Adoption Friction​

Direct customer quotes, especially from decision-makers, are goldmines for B2B SaaS companies. They move beyond feature-level feedback to articulate business-level outcomes. For a company like Gong, which provides revenue intelligence, a quote from a VP of Sales isn't just about call recording; it's about solving a core operational challenge: user adoption of new technology. This is one of the most powerful voice of the customer examples because it reframes the product's value proposition.

When a RevOps leader states, "The native Salesforce dialer integration was the key. We saw 90% adoption in the first month because our reps never had to leave their workflow," it elevates the conversation. This quote shifts the focus from a technical feature (a dialer) to a strategic benefit (solving adoption friction). It validates that embedding tools into existing CRMs like Salesforce or HubSpot is critical for driving usage and, ultimately, ROI.

Strategic Analysis & Actionable Insights​

Analyzing this VoC data is about connecting a specific product capability to a high-level business problem. It’s a roadmap for creating targeted sales and marketing collateral.

  • Actionable Step: Turn this quote into a "challenge/solution" slide in your sales deck. The challenge: "Low adoption plagues new sales tools." The solution: "Our native integration drove 90% adoption in 30 days for a customer just like you." This makes the value instantly relatable.
  • Strategic Comparison: This direct quote is far more powerful than an aggregated NPS score. An NPS of +50 is good, but a VP-level quote about 90% adoption provides a concrete business outcome that resonates with economic buyers. It offers proof, whereas survey scores offer a pulse.
  • Sales Enablement Fuel: Equip your sales team with this exact quote. Coach them to use it during discovery calls when a prospect mentions past struggles with tool rollouts. This proactively addresses a common objection with a real-world success story, building immediate credibility.

Key Takeaway: Leverage quotes from leadership personas to create sales assets that speak to business outcomes, not just features. Use their exact words to build trust and demonstrate a deep understanding of the strategic challenges associated with rolling out new sales technology.

3. Support Ticket Excerpt: CRM Data Hygiene as Hidden Value​

While often seen as a cost center, the customer support queue is a goldmine for Voice of the Customer (VoC) data, revealing unexpected product value. For a sales engagement platform like MarketBetter, a support ticket can uncover benefits that go beyond the primary user's experience. This example shows how an inquiry from a Revenue Operations (RevOps) manager about activity logging highlights a critical, often overlooked value proposition: automated CRM data hygiene.

When a RevOps leader submits a ticket stating, "I noticed our Salesforce activity logging is at 98% for reps using MarketBetter, up from 65% with our last tool. This is giving us the cleanest attribution data we’ve ever had," it’s more than a simple query. It’s a powerful testimonial about a secondary, strategic benefit. This feedback validates the product's impact on a critical business function that sales leaders and operations teams care deeply about.

Strategic Analysis & Actionable Insights​

Analyzing support tickets for hidden value allows a company to reposition features and target new, influential personas within a customer’s organization.

  • Actionable Step: Create a system to tag support tickets by "persona" (e.g., SDR, RevOps, Manager) and "theme" (e.g., Data Quality, Feature Request). Once a month, review the "RevOps" tag to identify strategic insights like this one and share them directly with the marketing and product teams.
  • Strategic Comparison: Unlike a formal case study which is a polished, post-hoc narrative, a support ticket is an unfiltered, real-time signal of value. It's more authentic and often reveals benefits you didn't even know to ask about. Use this raw insight as the seed to create a more detailed case study.
  • ROI Quantification: Don't let this data sit in a support system. Model the financial impact. Calculate the cost of poor data (e.g., wasted marketing spend on bad attribution) and create a one-pager: "How 98% data accuracy can save your marketing budget." Use this as a mid-funnel content piece.

Key Takeaway: Scour support tickets for comments from operational roles like RevOps and Sales Ops. These personas often quantify your product's "hidden" value in ways your primary users don't. This specific type of voice of the customer examples can be used to build powerful case studies and sales enablement materials that speak directly to strategic buyers.

4. In-App Feedback: AI Email Quality and Relevance Validation​

As AI-powered tools like MarketBetter become central to sales workflows, capturing VoC directly within the application is critical for building user trust. In-app feedback mechanisms, particularly those focused on the quality of AI-generated content, offer a real-time pulse on whether the technology is truly helping or hindering. This approach validates the platform's core promise of delivering high-quality, account-informed emails that reps feel confident sending.

An AI-generated email with a 5-star rating, referencing a funding round, was sent as-is, building trust.

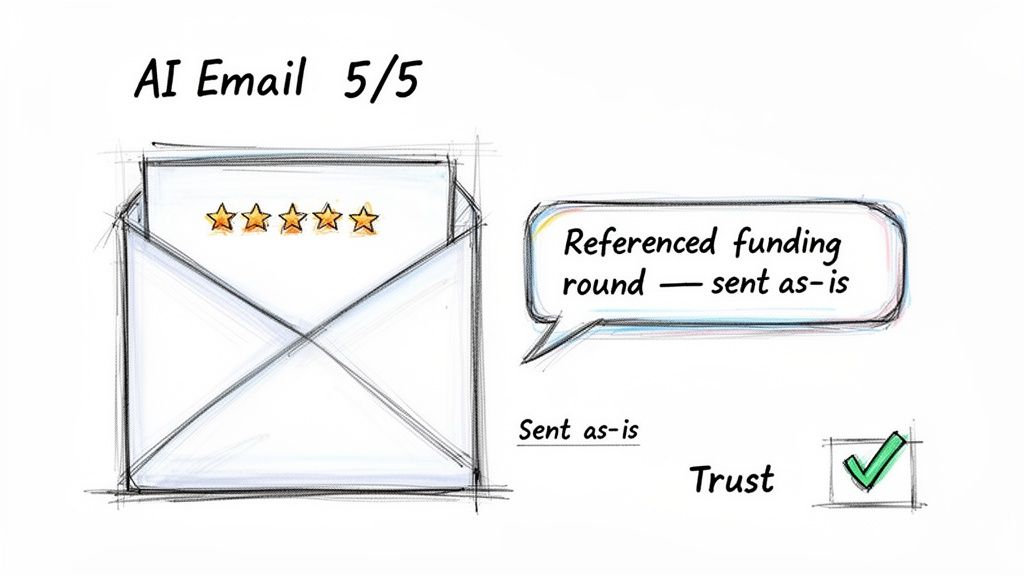
When an SDR rates an AI-generated email 5-stars and sends it without edits, it’s a powerful trust signal. Conversely, a 1-star rating with the comment, "Context was stale; mentioned a funding round from last year," provides an immediate, actionable data point for the product team. This feedback loop is essential for refining the AI models that drive personalization and directly impacts the effectiveness of outreach, which is why understanding these signals is a key step to improve email open rates.

Strategic Analysis & Actionable Insights​

Analyzing in-app AI quality feedback moves beyond simple feature satisfaction. It's about measuring the core trust and reliability of your platform’s intelligence layer.

  • Actionable Step: For every 1-star rating, trigger an automated but personalized follow-up from the product manager. "Thanks for the feedback on the AI email. To help us improve, could you tell us what context was missing?" This turns a negative experience into a collaborative product development session.
  • Strategic Comparison: This method is far more immediate and granular than a quarterly survey. A survey might ask, "How satisfied are you with our AI features?" which is vague. In-app feedback provides a precise, actionable signal on a specific output, allowing for much faster iteration cycles.
  • AI Model Refinement: Use negative feedback to create a direct pipeline for model improvement. A comment like "Account context was stale" can trigger a process to re-evaluate the intent data sources or recency filters for that specific account, turning a single user's experience into a platform-wide enhancement.

Key Takeaway: Treat in-app AI feedback as a direct conversation with your users about your core value proposition. Low ratings are not failures; they are precise, invaluable instructions on where to improve your data and algorithms. This is one of the most dynamic voice of the customer examples for any company leveraging generative AI.

5. Survey Question/Verbatim: Ramp Time and Productivity Lift​

Quantitative survey data is a crucial Voice of the Customer (VoC) channel, especially for measuring operational impact. For companies like MarketBetter, targeting high-turnover sales environments, a key value proposition is reducing the time it takes for new Sales Development Representatives (SDRs) to become fully productive. A targeted survey question asking for ramp time metrics provides concrete evidence of the platform's ROI, moving beyond subjective feedback to hard numbers.

When a sales manager completes a survey and states, "Our average SDR ramp time dropped from 75 days to just 40 days after implementing MarketBetter," it becomes a powerful, quantifiable success story. This data directly validates the platform's ability to streamline workflows, improve onboarding, and accelerate a new hire's path to quota attainment. It provides marketing and sales teams with a compelling metric to build case studies and ROI calculators around.

Strategic Analysis & Actionable Insights​

Analyzing this VoC data is about translating a single metric into a comprehensive value narrative that resonates with VPs of Sales and enablement leaders.

  • Actionable Step: Create a simple ROI calculator on your website based on this data. Let prospects input their number of new SDR hires per year and their average salary. The calculator then shows the potential cost savings based on the 35-day reduction in ramp time. This makes the value tangible and self-service.
  • Strategic Comparison: This quantitative data is the perfect complement to qualitative interview snippets. An interview might reveal how managers feel coaching is better, but this survey data proves the outcome of that better coachingβ€”a 46% faster ramp time. Combining them creates an undeniable narrative.
  • Persona-Targeted Content: Use this data to create hyper-relevant content. For a Head of Sales Enablement, create a webinar titled "How to Cut SDR Ramp Time in Half." For a VP of Sales, publish a blog post, "The Hidden Costs of a 90-Day Ramp Time and How to Avoid Them."

Key Takeaway: Use quantitative survey data on operational metrics like ramp time as the foundation for a compelling ROI story. Follow up with respondents to build detailed case studies, transforming this powerful voice of the customer examples into a tool that directly addresses the financial and productivity concerns of executive buyers.

6. Review Excerpt: Integration Simplicity and Workflow Consolidation​

Third-party review sites like G2, Capterra, and Trustpilot are treasure troves of Voice of the Customer (VoC) data, offering unfiltered feedback that directly influences B2B buying decisions. For a SaaS platform like MarketBetter, a review highlighting its seamless Salesforce integration and workflow consolidation is incredibly potent. It addresses a major pain point for sales teams: the "tool-switching" fatigue that drains productivity and complicates tech stacks.

When a sales manager posts, "Finally, a platform that lives inside Salesforce. We ditched three separate tools because MarketBetter consolidates our task management, dialer, and email sequencing in one place," it's a powerful narrative. This feedback validates the product's core value proposition as a central hub, shifting the conversation from individual features to holistic operational efficiency.

Strategic Analysis & Actionable Insights​

Analyzing review excerpts is about identifying and weaponizing your strategic advantages. This VoC feedback provides the exact language needed to differentiate your product in a crowded market.

  • Actionable Step: Take a screenshot of the G2 review, get permission from the user, and feature it prominently on your product and pricing pages. Add a headline like, "Tired of juggling multiple tools? See why our customers consolidate their tech stack with us."
  • Strategic Comparison: Unlike internal NPS comments, G2 reviews provide public, third-party validation that is highly trusted by prospects. A prospect might be skeptical of your marketing claims, but they are far more likely to believe an unsolicited review from a peer. This makes review excerpts more valuable for top-of-funnel marketing.
  • Competitive Positioning: Use this language in competitive battle cards. When a prospect mentions they are evaluating a competitor, a rep can respond, "That's a great tool, but we often hear from customers like [reviewer name] that they switched to us to consolidate three tools into one. Is reducing tool fatigue a priority for you?"

Key Takeaway: Treat positive third-party reviews focused on consolidation as a strategic asset. Amplify these voice of the customer examples in sales decks, on your website, and in ad campaigns to build a powerful narrative around efficiency and simplicity, directly addressing the common industry problem of a fragmented tech stack.

7. Interview Snippet: Manager Coaching Leverage and Visibility​

While quantitative data provides scale, qualitative customer interviews uncover the β€œwhy” behind user behavior. For a sales engagement platform like MarketBetter, a snippet from a conversation with a Sales Manager provides rich, narrative-driven VoC data. This example reveals how integrated context (task priority, intent signals, call notes) is not just a rep-level feature but a strategic tool for managers to elevate team performance.

When a manager says, β€œBefore, I’d listen to a call and give feedback, but I was missing the full picture. Now I see the prospect's intent data and the exact email sequence they’re in. My coaching is 10x more impactful,” they are articulating a high-value, second-order benefit. This feedback shifts the product's value proposition from a simple productivity tool for reps to a strategic coaching and visibility platform for leaders. To capture such nuanced feedback effectively, consider leveraging specialized tools for efficient interview and focus group transcription to turn spoken insights into structured data.

Strategic Analysis & Actionable Insights​

Analyzing interview feedback is about identifying recurring themes and pain points that reveal new market positioning opportunities. It’s a core method for gathering deep voice of the customer examples.

  • Actionable Step: Create a two-minute video clip of this interview snippet (with permission). Use it in targeted LinkedIn ad campaigns aimed at Sales Managers and VPs of Sales. The authenticity of a real manager speaking will be far more compelling than a standard ad.
  • Strategic Comparison: Interviews provide a level of narrative depth that surveys or support tickets can't match. A survey can confirm that managers are satisfied, but an interview reveals the specific scenarioβ€”the "before and after" of their coaching processβ€”that makes for a powerful story.
  • Persona Value Expansion: This feedback proves the platform’s value extends beyond the end-user (SDR) to the economic buyer (Sales Manager/VP). Use this insight to justify a higher price point or a separate pricing tier for manager-specific features, as the ROI is clearly demonstrated.

Key Takeaway: Treat in-depth interview snippets as strategic gold. Pull direct quotes to use in marketing materials, build case studies around the manager's success story, and feed these insights directly to the product team to double down on features that enhance leader visibility and coaching effectiveness.

8. Focus Group Insight: Reps Want Task Context, Not More Tools​

While quantitative data from surveys is crucial, qualitative insights from focus groups offer a deeper, more nuanced understanding of user needs. For B2B SaaS companies, especially in the sales tech space, these sessions reveal the "why" behind user behavior. A common theme emerging from focus groups with Sales Development Representatives (SDRs) is a strong preference for contextual, task-oriented workflows over an ever-expanding list of features. They don't want more tools; they want one place to get their work done efficiently.

This insight, often aligned with the Jobs to Be Done framework, shows that SDRs "hire" a platform to execute tasks faster and with more context. When a focus group participant says, β€œI don’t need another dashboard. I need to know who to call next, why they’re a priority, and what to say, all in one view,” they are providing a direct mandate for product design and marketing. This feedback guided the development of platforms like HubSpot, which consolidated tools for small teams, and it continues to be a core principle for user-centric companies like Slack and Notion.

Strategic Analysis & Actionable Insights​

Leveraging this type of VoC data is about translating qualitative feedback into a core product philosophy and a compelling market position. It shifts the focus from feature-stacking to workflow optimization.

  • Actionable Step: Translate this insight into a design principle for your product team: "Every new feature must reduce clicks or consolidate information, not add another screen." Before any feature is approved, ask, "Does this simplify the SDR's core workflow?"
  • Strategic Comparison: A focus group allows for interactive validation, which an interview does not. When one SDR makes this point, the moderator can ask the rest of the group, "Does that resonate with everyone?" This group validation makes the insight more reliable and less anecdotal than a single interview.
  • Competitive Differentiation: Use this insight to craft your market positioning. Your homepage headline could be, "Stop Drowning in Dashboards. Start Closing Deals." This directly targets the pain point uncovered in the focus group and sets you apart from competitors who brag about their number of features.

Key Takeaway: Use focus group insights to define your product's core value proposition. This specific voice of the customer example validates a "less is more" approach, allowing you to build a more intuitive product and craft marketing messages that resonate deeply with the daily struggles of your target users. Run follow-up sessions post-launch to confirm you've delivered on this promise.

9. Case Study: Pipeline Attribution and Revenue Impact (Quantified)​

A detailed case study is one of the most powerful forms of Voice of the Customer (VoC) data, transforming qualitative satisfaction into quantifiable business results. For a sales engagement platform like MarketBetter, a case study moves beyond simple feedback to prove its direct impact on revenue. It captures the customer's entire journey, showcasing a "before and after" scenario backed by hard metrics, such as increased deal velocity or improved pipeline attribution.

A funnel diagram demonstrating the traceability of tasks and logged activity to $420K annual recurring revenue.

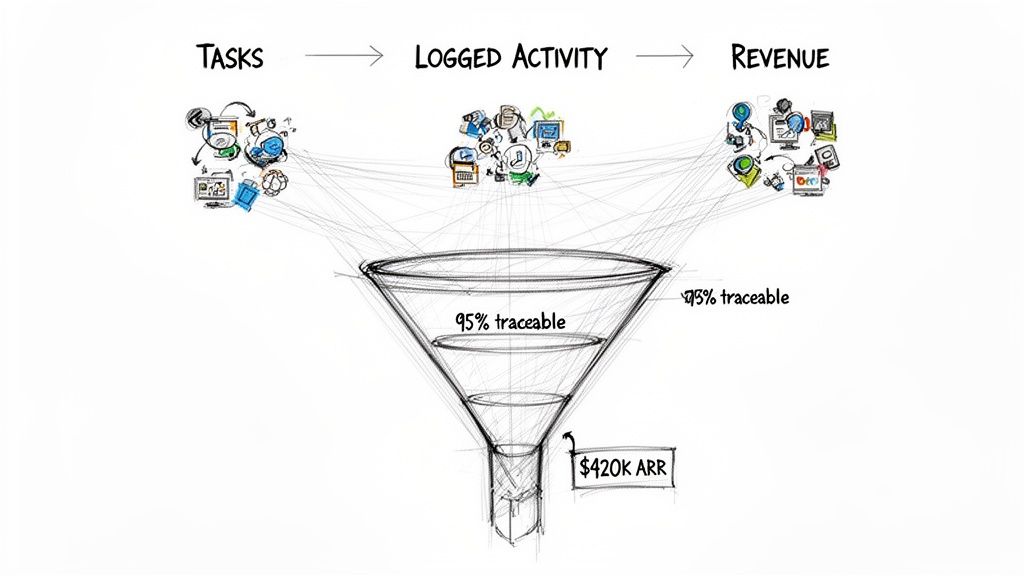
When a mid-market B2B SaaS customer states, "MarketBetter gave our RevOps team the data integrity needed to prove a 35% lift in SDR-sourced pipeline, directly influencing $420K in ARR last quarter," it becomes a cornerstone marketing and sales asset. This quantified success story provides concrete proof of the platform's value, directly addressing the ROI questions that CFOs and VPs of Sales care about most.

Strategic Analysis & Actionable Insights​

Analyzing a case study involves reverse-engineering the customer's success to create a replicable framework for sales, marketing, and product development.

  • Actionable Step: Break the case study down into micro-assets. Create a one-slide summary for sales decks, a series of social media graphics with pull quotes, and a short video testimonial with the customer. This maximizes the reach and impact of a single piece of content.
  • Strategic Comparison: A case study is the pinnacle of VoC data. While an NPS comment indicates satisfaction and a support ticket reveals a hidden benefit, a case study connects all the dots and ties your product's value directly to revenueβ€”the ultimate metric for any business. It is the most powerful form of social proof.
  • Sales Enablement & Discovery: Arm your sales team with specific data points from the case study. Coach them to ask during discovery, "Our customers typically see a 30-40% lift in SDR-sourced pipeline. What would that kind of impact mean for your revenue goals this year?" This frames the conversation around tangible outcomes.

Key Takeaway: A quantified case study is the ultimate VoC deliverable, translating user success into a powerful sales tool. Use it to build persona-specific messaging, create downloadable lead magnets, and provide your sales team with undeniable proof points that accelerate deals and build trust with prospects.

10. CSAT Feedback: Onboarding and Training Support Quality​

Customer Satisfaction (CSAT) scores measured immediately after onboarding are a critical Voice of the Customer (VoC) signal. For complex B2B platforms, the initial setup and training experience directly dictates long-term user adoption and retention. A high CSAT score at this stage isn't just about a pleasant first impression; it's a leading indicator of future account health, expansion potential, and lifetime value. It confirms that the customer feels equipped and confident to achieve their desired outcomes with the product.

When a customer rates their onboarding a 5/5 and adds, "The training specialist understood our unique workflow and showed us exactly how to set up the integration we needed," it provides specific, actionable validation. This feedback proves the enablement strategy is working and highlights which parts of the training process are most valuable. It’s why companies like HubSpot target an onboarding CSAT of 4.7 or higher, as they've correlated this metric with retention rates exceeding 90%.

Strategic Analysis & Actionable Insights​

Analyzing post-onboarding CSAT goes beyond a simple "good" or "bad" score. It’s about diagnosing the customer's initial journey to predict and improve future success.

  • Actionable Step: For every low CSAT score (1-2), implement a service recovery process. A manager should reach out within 24 hours to understand the issue and offer a follow-up training session. This proactive step can turn a detractor into a loyal advocate.
  • Strategic Comparison: CSAT is a transactional metric, unlike NPS which measures overall loyalty. This makes CSAT perfect for pinpointing specific friction points in the customer journey (like onboarding). Use CSAT to fix the "leaks in the bucket" and NPS to measure the overall strength of the bucket.
  • Identify Friction Points: Always follow up a low score with an open-ended question like, "What is one thing we could have done to make your onboarding experience better?" This feedback is a goldmine for identifying specific gaps in your documentation, training curriculum, or product UI that are causing early-stage friction.

Key Takeaway: Treat onboarding CSAT as a foundational health metric for the entire customer lifecycle. Low scores predict churn, while high scores identify your future advocates and expansion opportunities. Use this early voice of the customer example to refine your enablement and learn more about customer onboarding best practices on marketbetter.ai.

10 Voice-of-the-Customer Examples Compared​

ExampleImplementation Complexity πŸ”„Resource Requirements ⚑Expected Outcomes πŸ“ŠIdeal Use Cases πŸ’‘Key Advantages ⭐
NPS Comment: Task Inbox Reduces Admin BurdenLow β€” periodic survey + open comment collectionLow β€” survey tool, segmentationSignals adoption & time-savings (hours/day)Validate feature-level adoption & retentionDirect PMF indicator; easy to aggregate
Customer Quote: Dialer Integration Solves Adoption FrictionLow β€” capture testimonial during rolloutLow β€” customer relationship + permissionPersuasive adoption lift (20% β†’ 85%)Sales decks for RevOps / VP SalesCredible, metric-driven social proof
Support Ticket Excerpt: CRM Data Hygiene as Hidden ValueLow–Medium β€” tag & surface support feedbackMedium β€” support analytics & anonymizationShows data-quality gains (40% β†’ 95%) and better attributionRevOps/Finance proof points for switching toolsUnfiltered operational insight; strategic ROI
In-App Feedback: AI Email Quality and Relevance ValidationMedium β€” realtime UI hooks + feedback flowMedium–High β€” engineering + analyticsInstant quality signals; improves model trustBuild AI trust, iterate email generation modelsFast feedback loop; per-email trust metric
Survey Question/Verbatim: Ramp Time and Productivity LiftMedium β€” survey design and segmentationMedium β€” survey platform, analysis effortQuantified ramp reduction (60–90 β†’ 30–45 days; 68% report)High-turnover teams; hiring ROI messagingDirect enablement metric tied to cost savings
Review Excerpt: Integration Simplicity and Workflow ConsolidationLow β€” monitor and curate public reviewsLow β€” review platform monitoringThird-party credibility; adoption signalCompetitive positioning vs. tool sprawlPublic social proof; resonates with buyers
Interview Snippet: Manager Coaching Leverage and VisibilityMedium β€” structured interviews and synthesisMedium β€” interviewer time, transcript analysisShows coaching impact (e.g., 5 β†’ 12 meetings; 140% lift)Manager enablement; scaling SDR teamsQualitative depth that demonstrates manager ROI
Focus Group Insight: Reps Want Task Context, Not More ToolsMedium β€” facilitation and thematic analysisMedium β€” recruit participants, moderate effortUX/positioning validation; reduces feature creepProduct roadmap and messaging prioritizationUser-centered insight; guides simple UX design
Case Study: Pipeline Attribution and Revenue Impact (Quantified)High β€” data collection, verification, customer sign-offHigh β€” cross-functional analytics, legal, customer timeMulti-metric impact (activity ↑35%, attribution ↑43%, $420K ARR)Long sales cycles; CFO/VP-level ROI conversationsMost compelling evidence; multi-stakeholder credibility
CSAT Feedback: Onboarding and Training Support QualityLow–Medium β€” post-onboarding surveys & follow-upLow–Medium β€” survey + enablement improvementsAdoption predictor; Avg CSAT 4.6/5 correlates with retentionImprove onboarding, drive 30–90 day adoptionActionable enablement insight; retention signal
Free Tool

Try our Marketing Plan Generator β€” generate a complete AI-powered marketing plan in minutes. No signup required.

From Signal to Strategy: Making VoC Your Competitive Edge​

Throughout this guide, we've dissected ten distinct voice of the customer examples, moving far beyond surface-level quotes to uncover the strategic gold hidden within. We’ve seen how a simple NPS comment about reduced admin burden isn't just a compliment; it's a quantifiable value proposition that can be woven into sales discovery questions and marketing campaigns. A support ticket detailing CRM data hygiene issues becomes a powerful, unprompted testimonial for your platform's hidden value, directly addressing a critical pain point for RevOps leaders.

The true power of VoC emerges not from isolating these examples, but from connecting them. The focus group insight that "reps want task context, not more tools" perfectly explains the "why" behind the in-app feedback praising workflow consolidation. Similarly, the quantifiable ROI from a case study on pipeline attribution gains credibility when backed by a customer interview snippet where a manager praises the newfound visibility and coaching leverage. Your goal is to build a mosaic of evidence, where qualitative sentiment validates quantitative impact.

Turning Insight into Actionable Intelligence​

Passive collection is where most VoC programs fail. Storing feedback in a spreadsheet or a Slack channel is not a strategy; it's a digital graveyard for good intentions. The key is to operationalize these insights, transforming raw feedback into a revenue-driving engine.

  • Connect the Dots: Don't analyze a CSAT score in a vacuum. Compare it against support ticket themes and onboarding survey results. For instance, if CSAT feedback praises your onboarding quality, it's a signal to double down on that process. Effective training is paramount for improving support quality and customer satisfaction. To dive deeper into this specific area, explore an actionable guide to mastering customer support training to ensure your team is equipped for success from day one.
  • Segment and Prioritize: Not all feedback is created equal. A feature request from a high-growth account in your ideal customer profile (ICP) carries more weight than a complaint from a churn-risk customer who was never a good fit. Use your CRM data to segment feedback and prioritize actions that will have the greatest impact on retention and expansion revenue.
  • Systematize the Loop: Create a formal process for turning VoC insights into action. When a sales manager mentions improved coaching leverage in an interview, how does that translate into a new sales playbook? When a user review praises integration simplicity, how quickly can your marketing team turn that into a social media asset? This system ensures customer feedback directly influences go-to-market execution.

Your Path Forward: From VoC Examples to VoC Excellence​

The voice of the customer examples we've explored serve as a blueprint. Your next step is to move from theory to practice. Don't try to boil the ocean by launching ten new surveys at once. Instead, identify the single most critical unknown in your sales process. Is it ramp time for new SDRs? Is it friction in tool adoption? Or is it proving the ROI of your solution to executive buyers?

Choose that one question and align your VoC collection methods to answer it. Use targeted in-app feedback to understand adoption, run a focused survey to measure productivity lift, or schedule three customer interviews to get the unfiltered story on revenue impact. By focusing your efforts, you create a tangible feedback loop that delivers immediate value.

Ultimately, a world-class VoC program isn't about collecting feedback; it's about embedding the customer's perspective into every decision your sales, marketing, and product teams make. It’s the difference between guessing what your buyers want and knowing what they need to succeed. When you make the customer's voice the loudest one in the room, you don't just build a better product; you build an unbeatable competitive advantage.


Ready to stop manually compiling feedback and start automatically turning customer insights into winning sales plays? marketbetter.ai ingests these diverse voice of the customer examples and uses AI to generate battlecards, email templates, and talking points, embedding your customer's voice directly into your team's workflow. See how it works at marketbetter.ai.