Mastering Marketing Performance Metrics
Marketing performance metrics are the numbers you track to see if your campaigns are actually working. They’re the hard data that tells you what’s a hit, what’s a miss, and where to put your budget next to get the best results.
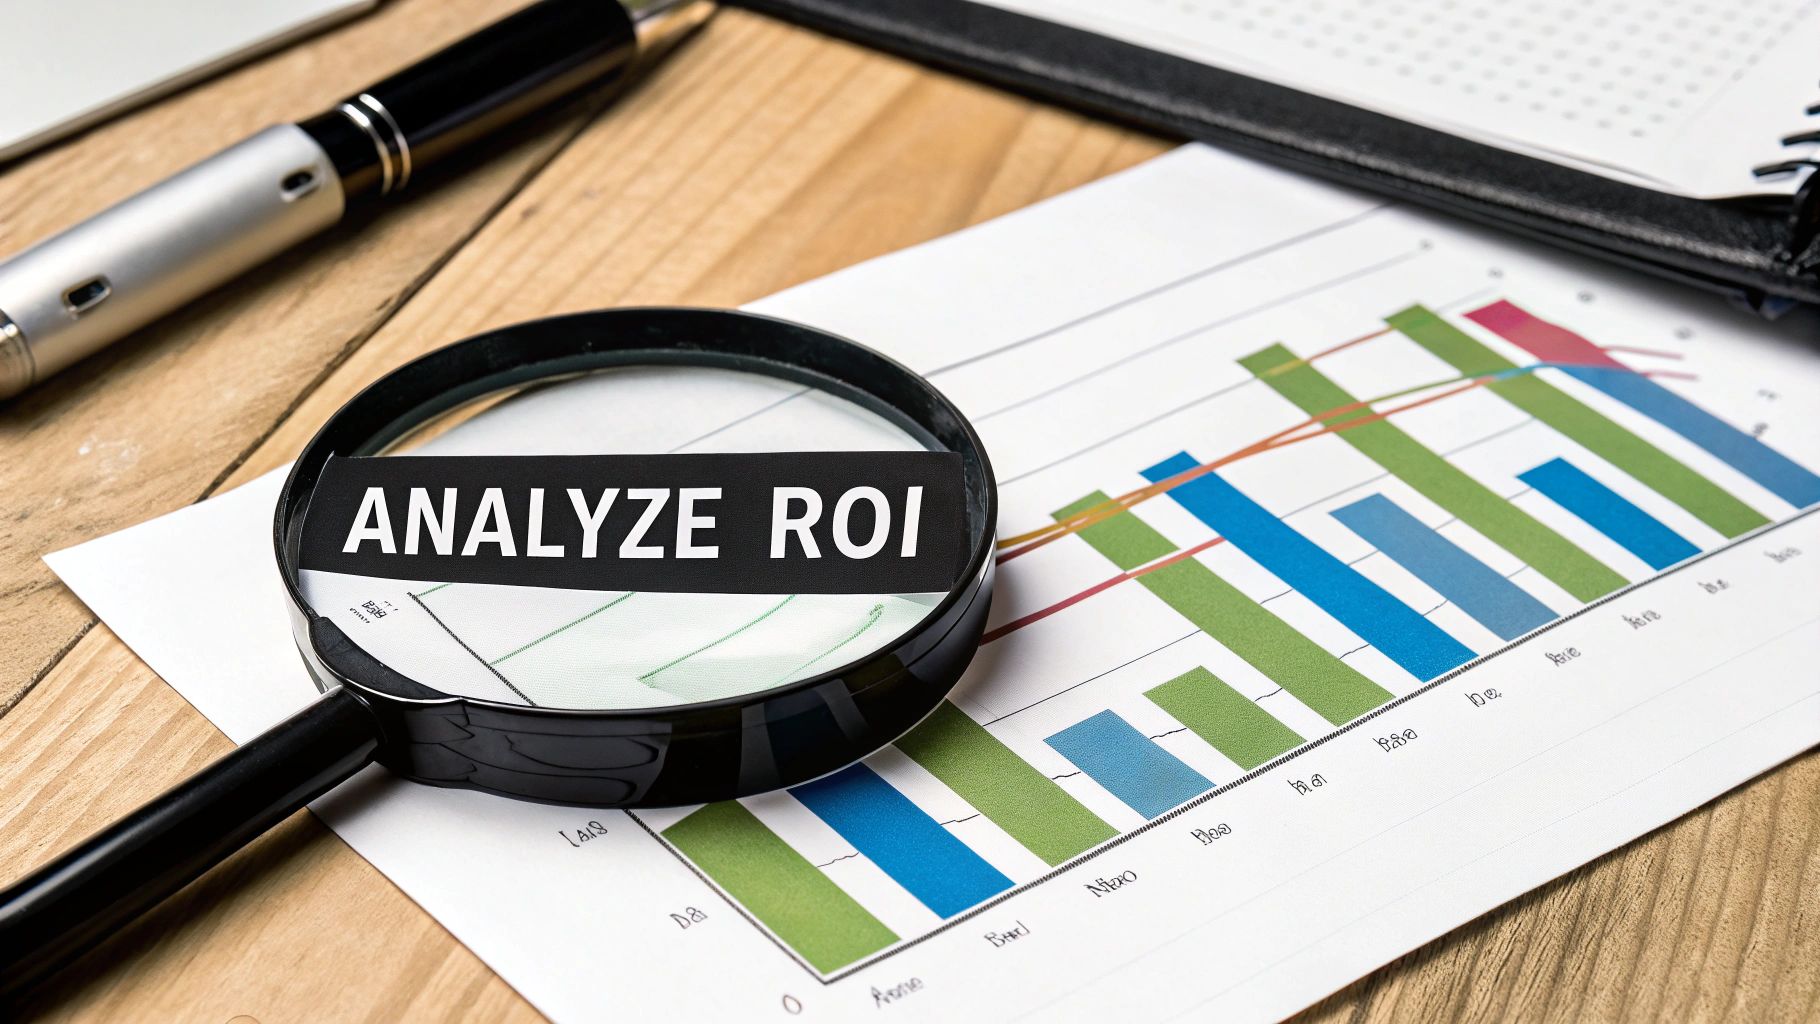
Think of it this way: running a marketing campaign without metrics is like sailing a ship without a compass. You’re definitely moving, but you have no clue if you’re heading toward your destination or just drifting out to sea. Marketing performance metrics are your navigation system, giving you the critical feedback needed to steer your strategy with confidence.

In a world where every dollar needs to be justified, these metrics are what turn marketing from a perceived cost center into a predictable revenue driver. They give you the proof you need to defend your budget, show your value, and fix small problems before they become massive headaches.
Turning Data Into Decisions
The real power of metrics is how they turn vague goals into something you can actually measure and improve. Instead of just "increasing brand awareness," you can now track specific numbers like social media reach, website traffic, and share of voice. It’s this shift from guesswork to guided action that separates the top-performing teams from everyone else.
We're all swimming in data these days. Projections show that by 2025, marketers will be using 230% more data than they were back in 2020. But here’s the catch: even with all this information, a shocking 56% of marketers feel they don’t have enough time to actually analyze it.
This is exactly why having a focused set of clear, actionable metrics is non-negotiable. They help you cut through the noise and zero in on the numbers that truly move the needle for your business.
“At the simplest level, you need to measure what you set out to achieve with your marketing objectives.”
To help you get started, it's useful to group metrics into a few key categories. Each one tells a different part of your marketing story.
Key Metric Categories at a Glance
This table gives you a quick rundown of the main types of marketing metrics and what they're designed to measure. Think of it as a cheat sheet for understanding the landscape.
| Metric Category | What It Measures | Example Metric | Actionable Insight |
|---|---|---|---|
| Traffic & Engagement | How many people are finding your content and how they're interacting with it. | Website Sessions | Compare session sources (e.g., Organic vs. Social) to see which channel brings more traffic. |
| Conversion Metrics | The effectiveness of your marketing in prompting desired actions (e.g., sign-ups). | Lead Conversion Rate | A/B test your landing page headline to see if you can increase the conversion rate by 5%. |
| Revenue & ROI Metrics | The direct financial impact and profitability of your marketing efforts. | Customer Acquisition Cost (CAC) | If CAC is rising, analyze your ad spend to cut underperforming campaigns. |
| Brand Metrics | The perception and awareness of your brand in the market over time. | Share of Voice (SOV) | Track SOV against competitors to gauge your market presence. |
| Customer Metrics | The health and value of your existing customer relationships. | Customer Lifetime Value (CLV) | Compare CLV of customers from different channels to find your most valuable audiences. |
With these categories in mind, you can start building a dashboard that gives you a complete picture of your performance, not just isolated data points.
From Vanity to Value
One of the most common traps marketers fall into is obsessing over "vanity metrics" instead of "actionable metrics." The difference is critical.
- Vanity Metrics: These are the numbers that look great in a report but don’t really connect to your business goals. Think of things like total page views or social media likes. They might feel good, but they don't tell you if you're making money.
- Actionable Metrics: These numbers are directly tied to your bottom line. We're talking about things like Customer Acquisition Cost (CAC), Conversion Rate, and Return on Ad Spend (ROAS). These are the metrics that give you clear insights you can actually do something with.
Actionable Comparison: Imagine your page views went up 50% (vanity), but your conversion rate dropped 20% (actionable). The actionable metric tells you the new traffic is low quality, prompting you to review your targeting. The goal is to build a measurement framework that prioritizes real value over fluff. To get a deeper look at what truly matters, check out this excellent guide on how to measure advertising effectiveness.
Navigating the Three Tiers of Marketing Metrics
Drowning in marketing data? I get it. The sheer number of metrics can feel overwhelming. The trick isn't to track everything, but to organize the numbers into a story that actually makes sense—one that follows your customer from their very first click to the final sale.
Let's cut through the noise. We can sort pretty much all marketing data into three simple tiers: Acquisition, Engagement, and Conversion. Think of it as a diagnostic tool. Each tier answers a critical question about your performance, helping you pinpoint exactly what's working and what’s falling flat.
Tier 1: Acquisition Metrics That Attract Customers
Acquisition is all about your first handshake. How well are you pulling new people into your world? These metrics live at the very top of your funnel, measuring your ability to grab attention and draw in potential customers before you've even had a real conversation.
This tier answers one fundamental question: "Are we reaching the right people, and what's it costing us?"
Here are the big three to watch:
- Customer Acquisition Cost (CAC): This is the bottom line of your growth efforts. Simply put, it’s the total you spend on marketing and sales divided by the number of new customers you actually land. A high CAC can be a red flag for inefficient ad spend, while a low CAC is a sign you're growing profitably.
- Cost Per Lead (CPL): A more granular look, CPL tells you how much you're shelling out for a single new lead. Comparing your CPL from Google Ads versus LinkedIn, for instance, shows you where your budget is working hardest.
- Click-Through Rate (CTR): This is the percentage of people who see your ad and are compelled enough to click it. If your CTR is in the gutter, it’s a strong signal that your creative or ad copy just isn't hitting the mark.
A pro tip? Always compare your CAC to your Customer Lifetime Value (CLV). A healthy business model usually has a CLV that's at least three times higher than its CAC. If that ratio is off, it’s time to rethink your targeting or tighten up your messaging.
To really get a handle on performance, you need to see how all your channels work together. This is where owned, paid, and earned media come into play, feeding into your overall strategy.

As you can see, a strong marketing foundation doesn't lean on just one pillar. It's a balanced mix of your own assets (like your website), paid campaigns, and the social proof that builds trust.
Tier 2: Engagement Metrics That Build Relationships
Okay, so you've got their attention. Now what? The next step is holding it. Engagement metrics tell you how people are interacting with your brand once they're in the door. This is where you separate the casual window shoppers from a genuinely interested audience.
This tier answers the question: "Is our content actually connecting with people?"
Think of a high bounce rate like someone walking into your store, taking one look around, and immediately leaving. It screams "This isn't what I expected!" By comparing the bounce rate of two different landing pages, you can quickly see which one is doing a better job of delivering on its promise.
Tools like Google Analytics are your best friend here, giving you a clear dashboard view of what’s happening.
Dashboards like this make it easy to see which channels are bringing in the most engaged visitors, so you know exactly where to double down.
Keep an eye on metrics like Time on Page, Bounce Rate, and Social Media Interactions (likes, shares, comments). These are the numbers that tell you if your content is truly hitting home or just creating noise.
Tier 3: Conversion Metrics That Drive Revenue
This is it. The moment of truth. Conversion is where all your hard work turns into tangible business results. These are the "money metrics" that track actions directly tied to revenue—making a purchase, booking a demo, or downloading an ebook. They prove your marketing ROI.
They answer the most important question of all: "Are we actually making money from all this?"
While there are many conversion metrics, two reign supreme:
- Conversion Rate: The percentage of visitors who take the specific action you want them to. A dead-simple way to improve this? A/B test your calls-to-action (CTAs). I've seen a simple text change from "Learn More" to "Get Your Free Trial" literally double a page's conversion rate overnight.
- Return on Ad Spend (ROAS): This measures the raw revenue you generate for every single dollar you put into advertising. A 4:1 ROAS means you're making $4 for every $1 spent. Comparing ROAS across your different campaigns is the fastest way to find your most profitable channels and cut the fat.
Comparing Metrics Across Your Marketing Channels
Treating all your marketing performance metrics the same is like using a hammer for every job in your toolbox—it’s clumsy, inefficient, and you'll probably break something. A metric that signals a huge win in one channel might be a total distraction in another. The real key is learning to speak the unique language of each platform.
A high Click-Through Rate (CTR) is a clear victory for a PPC ad, proving your copy and creative were sharp enough to grab immediate attention. But for an email campaign? The hero metric is often the Open Rate. That tells you if your subject line even earned a glance in a crowded inbox. Understanding these differences is what turns a generic marketing plan into a smart, channel-specific strategy.
SEO Success Metrics That Build Long-Term Value
Search Engine Optimization (SEO) is a marathon, not a sprint. The goal here isn't a quick burst of attention; it's about attracting high-quality, organic traffic by earning real estate on search engine results pages. Success isn’t measured in flashy, short-term spikes. It's all about steady, sustainable growth.
The SEO metrics that truly matter are the ones that build over time:
- Organic Traffic: This is your bread and butter—the total number of visitors who find your site from a search engine. A steady upward trend means your content is hitting the mark with both search algorithms and actual humans.
- Keyword Rankings: Tracking your position for target keywords tells you how visible you are for the exact terms your customers are using. Moving from page two to page one isn't just a small jump; it can exponentially increase your traffic.
- Backlink Profile: Think of each high-quality backlink as a vote of confidence from another credible site. The quantity and quality of these "votes" are a massive signal to search engines that you're an authority worth listening to.
A powerful way to move the needle is to focus on topic clusters instead of isolated keywords. Build a central "pillar" page on a core topic and link out to related sub-topic articles. This strategy shows search engines you have deep expertise, improving rankings across a whole range of terms and driving more organic traffic over the long haul.
PPC Metrics That Drive Immediate Action
Pay-Per-Click (PPC) advertising is all about speed and precision. You’re paying for every interaction, so efficiency is the name of the game. The goal is to get immediate, measurable results by placing ads directly in front of a highly targeted audience.
For PPC, your dashboard should be focused on these core numbers:
- Return on Ad Spend (ROAS): This is the ultimate bottom-line metric. It cuts through the noise and tells you exactly how much revenue you��’re generating for every single dollar you put into your ads.
- Cost Per Click (CPC): This shows you what you're paying for a single click. Keeping a close eye on CPC helps you spot cost-effective keyword opportunities and avoid getting dragged into expensive bidding wars.
- Conversion Rate: A high CTR is great, but it doesn't pay the bills. This metric tracks the percentage of users who actually take the desired action—like making a purchase—after clicking your ad. If your conversion rate is low, it's a sign your landing page isn't delivering on the ad's promise.
To sharpen your PPC performance, you have to be constantly testing. A/B test your ad copy, your headlines, your calls-to-action, and your landing pages. Even a tiny tweak can have a massive impact on your ROAS.
Comparing channels reveals their unique strengths. SEO builds a foundational asset that generates traffic over the long term, while PPC acts as a faucet you can turn on for immediate, targeted leads. A strong strategy uses both in tandem.
Social Media Metrics That Foster Community
Social media marketing plays a different game. While it can absolutely drive sales, its primary strength lies in building brand awareness, fostering a community, and actually engaging with your audience. The metrics here are less about hard conversions and more about audience sentiment and interaction.
On social, you need to be tracking:
- Engagement Rate: This is the sum of all interactions—likes, comments, shares, and saves. It’s a direct measure of how compelling your content is and whether your audience is leaning in to be part of the conversation.
- Reach and Impressions: Reach is the number of unique people who see your content, while impressions are the total number of times it was displayed. Tracking both helps you understand just how far your brand's voice is carrying.
For marketers looking to get a much sharper picture of their audience, new tracking technologies are making a huge difference. You can learn more about how person-level identification is changing the game in our detailed guide.
Email Marketing Metrics That Nurture Leads
Email marketing is the workhorse of lead nurturing. It’s one of the most personal and effective channels for moving subscribers down the funnel by delivering valuable content straight to their inbox. It's where you build lasting customer relationships.
Success in email marketing comes down to these key indicators:
- Open Rate: The percentage of recipients who opened your email. This is your first and most important hurdle, heavily influenced by your subject line and sender reputation.
- Click-Through Rate (CTR): The percentage of people who clicked on a link inside your email. A solid CTR tells you that your message and call-to-action were compelling enough to spark action.
- Unsubscribe Rate: The percentage of subscribers who opt out. A high rate is a massive red flag that your content is missing the mark or you're sending too frequently.
Recent data shows just how powerful this channel remains for tech companies. Email marketing continues to show its strength with an average open rate of 28%, proving it’s still a vital tool for engagement. This sits alongside other key benchmarks like a 3.2% CTR for LinkedIn Ads and an average Customer Acquisition Cost of $95, which are setting new standards for performance.
Channel-Specific Metric Comparison
To bring it all together, it's helpful to see these metrics side-by-side. Each channel has a different job to do, and therefore, a different scorecard.
| Marketing Channel | Primary Goal | Key Metrics to Track | Industry Benchmark Example |
|---|---|---|---|
| SEO | Build organic visibility, attract qualified traffic | Organic Traffic, Keyword Rankings, Backlinks | 5-10% monthly growth in organic traffic |
| PPC | Drive immediate conversions and targeted leads | ROAS, CPC, Conversion Rate | 4:1 ROAS (varies widely by industry) |
| Social Media | Build community, increase brand awareness | Engagement Rate, Reach, Follower Growth | 1-5% average engagement rate on posts |
| Email Marketing | Nurture leads, drive repeat business | Open Rate, CTR, Unsubscribe Rate | 28% average open rate (tech industry) |
This table isn't about declaring a "winner"—it's about clarity. By focusing on the right metrics for the right channel, you stop comparing apples to oranges and start making smarter decisions that drive real growth across your entire marketing ecosystem.
Turning Numbers Into Results: A Framework That Actually Works
Knowing your marketing performance metrics is one thing. Actually improving them is the entire game. The difference between the two is having a repeatable process—a framework that takes you from staring at a dashboard to actively shaping the numbers on it.
This isn't complicated. It’s a simple, four-stage loop: Define, Measure, Analyze, and Optimize. Think of it as a flywheel. Each time you complete the cycle, your marketing gets a little sharper, a little smarter, and a lot more effective.
Step 1: Define Your Objective
Before you can fix anything, you have to know exactly what you’re trying to achieve. "Increase traffic" isn't an objective; it's a wish. A real objective is specific, measurable, and tied directly to a business outcome.
For example, don't just say, "get more leads." Instead, get specific: "Reduce Customer Acquisition Cost (CAC) by 15% in Q3 by improving lead quality from our paid search campaigns." See the difference? Now you have a clear target and a specific area to focus your energy on.
A well-defined objective is your North Star. It stops you from chasing shiny objects and keeps the entire team focused on what actually drives growth.
Step 2: Measure the Right Things
With a clear objective locked in, the next step is picking the right metrics to track your progress. This is where so many marketers get lost, drowning in dozens of numbers that don't actually matter for their specific goal.
If your objective is to slash CAC, you shouldn’t be obsessing over social media likes. Instead, you’d zero in on a few key performance indicators (KPIs) that are directly wired to that outcome.
- Cost Per Click (CPC): How efficient is your ad spend at the very top of the funnel?
- Cost Per Lead (CPL): How much are you actually paying to get a potential customer to raise their hand?
- Lead-to-Customer Conversion Rate: This one’s crucial. It tells you if the leads you’re generating are actually any good.
Just comparing CPL across different campaigns can be a powerful diagnostic tool. If Campaign A has a CPL of $50 and Campaign B is running at $150, you immediately know where to start digging. A solid CRM is non-negotiable for tracking these numbers from the first click to the final sale.
Step 3: Analyze Your Performance
Now for the fun part: connecting the dots. Analysis is all about digging into the data to understand the "why" behind the numbers. Why is one ad campaign crushing it while another is a dud? Where's the bottleneck in your funnel?
You might discover your CPC is nice and low, but your Lead-to-Customer Rate is terrible. That’s a huge insight. It suggests your ad is great at getting clicks but it’s attracting the wrong crowd, or maybe your landing page isn’t delivering on the promise you made in the ad. This is the moment data becomes intelligence.
Here’s a snapshot of a Google Ads dashboard, a primary tool for measuring and analyzing paid campaign performance.
This gives you a high-level view of critical metrics like clicks, impressions, and cost, letting you quickly check the health of your campaigns. By drilling down into these numbers, you can start to figure out which ads and keywords are driving the most valuable actions.
Step 4: Optimize for Better Results
This is where you turn your analysis into action. Based on your insights, you’ll form a hypothesis and run a test to see if you can move the needle. Optimization isn't a one-and-done task; it's an ongoing process of experimenting, learning, and iterating. You make small, calculated bets to produce better outcomes.
Here are a few common scenarios and the optimization plays that follow:
-
If your CAC is too high: Your targeting is probably too broad. Try refining it to reach a more specific audience. A great first step is to test negative keywords to filter out all the irrelevant search traffic that's eating your budget. You can see how one of our partners did just that by reading about how LevelBlue optimized their ad spend in our case study.
-
If your conversion rate is low: Your landing page is the likely culprit. A/B test your headlines, your call-to-action (CTA) buttons, and the overall page layout. Sometimes a simple change from "Submit" to "Get My Free Guide" can make a world of difference.
-
If your ROAS is weak: Time to reallocate your budget. Be ruthless. Shift spending from the campaigns that are underperforming to your proven winners. Compare the ROAS of your social media ads to your search ads to find your most profitable channel, and then double down on it.
By running through this Define, Measure, Analyze, Optimize cycle again and again, you build a powerful engine for growth. You stop guessing what works and start building a marketing strategy based on hard evidence and real results.
The Future of Measurement: AI and Analytics are Changing the Game
For years, marketing performance metrics have been a rearview mirror. They show you where you’ve been—what worked last quarter, which campaign drove clicks last month. It’s useful, sure, but it’s always historical. You're constantly reacting.
The arrival of AI and predictive analytics is flipping that script entirely. It's turning measurement from a history report into a weather forecast, giving you a real shot at seeing what’s coming before it happens. This isn't just about getting reports faster; it’s about making smarter, proactive decisions instead of constantly playing catch-up.
This isn't some far-off trend, either. The AI marketing space was already worth around $20 billion in 2022 and is on track to hit $40 billion by the end of 2025. That’s not slow adoption—that’s a full-on sprint as businesses race to get an edge. If you're curious about the numbers, Cubeo.ai has a great breakdown of AI's marketing impact.
From Reactive to Predictive Measurement
So what's the real difference here? It’s all about the questions you can ask. A traditional dashboard tells you your Customer Acquisition Cost (CAC) last quarter. An AI model can forecast your CAC for the next quarter based on your planned ad spend and expected market shifts. See the leap? It’s the difference between reaction and prediction.
This is possible because AI can chew through massive datasets and spot subtle patterns a human analyst would almost certainly miss. It connects the dots between thousands of customer behaviors, market signals, and campaign results to make some remarkably accurate guesses about the future.
AI lets us move beyond asking, "What happened?" to asking, "What’s likely to happen next, and what should we do about it?" It turns your data from a record of the past into a roadmap for the future.
How AI is Actually Used in Marketing Analytics
This all sounds great in theory, but what does it look like on the ground? We’re talking about real tools that are already changing how marketing teams work and measure success.
Here are a few game-changing applications you can use today:
-
Predictive Lead Scoring: Forget manually assigning points for email opens. AI digs into thousands of data points—from website clicks to social media engagement—to figure out which leads are genuinely hot. This lets sales teams stop chasing ghosts and focus their energy where it’ll actually count. We have a full playbook on implementing AI-powered lead scoring if you want to go deeper.
-
AI-Driven Budget Allocation: Trying to manually spread a big ad budget across dozens of campaigns is a nightmare of spreadsheets and guesswork. AI algorithms can watch performance in real-time and automatically shift money to the channels and ads that are actually working, squeezing every last drop of value from your Return on Ad Spend (ROAS).
-
Customer Churn Prediction: AI is fantastic at spotting the quiet signals that a customer is about to bail. By analyzing past behavior, it can flag at-risk accounts, giving you a critical window to step in with a retention offer or some extra support before they’re gone for good.
The Old Way vs. The New Way
When you put them side-by-side, the difference is stark. One approach is static and historical; the other is dynamic and forward-looking. This table breaks down that fundamental shift.
| Capability | Traditional Analytics | AI-Powered Analytics |
|---|---|---|
| Focus | Historical performance ("What happened?") | Predictive outcomes ("What will happen?") |
| Optimization | Manual A/B testing and tweaks | Automated, real-time optimization |
| Audience | Broad, demographic-based segments | Hyper-personalized, behavior-based micro-segments |
| Insights | Shows you correlations in data | Uncovers causal relationships—the "why" |
| Speed | Weekly or monthly reports | Real-time analysis and instant alerts |
This isn't just about keeping up with the latest tech. By embracing these tools, you're building a system that can anticipate and adapt. You’re setting up your marketing to be a step ahead, no matter what changes come next.
Try our Marketing Plan Generator — generate a complete AI-powered marketing plan in minutes. No signup required.
Common Questions About Marketing Metrics

Alright, we've covered the what and the why. But let's be real—the day-to-day work of wrangling marketing data always sparks a few questions. This is where the rubber meets the road.
Here are the practical hurdles and strategic puzzles I see marketers run into all the time, along with some straight-up, actionable answers to help you get unstuck.
How Often Should I Review My Marketing Metrics?
There’s no one-size-fits-all answer here. The right cadence depends entirely on what you're measuring. Think of it like this: some metrics are speedboats, and others are oil tankers. You don't pilot them the same way.
A simple way to break it down is by speed and impact:
- Daily or Weekly Checks: These are your fast-moving, tactical numbers. Think PPC ad spend, website traffic, social media engagement, and conversion rates on a new campaign. These metrics can change on a dime and often need quick adjustments to stop a budget leak or double down on something that's working.
- Monthly or Quarterly Reviews: This is for your big-picture, strategic metrics. We're talking Customer Lifetime Value (CLV), Customer Acquisition Cost (CAC) trends, and overall market share. Peeking at these every day is like trying to watch a plant grow—you won't see meaningful change, and you'll drive yourself crazy.
The key is matching your review cycle to the metric's nature. Checking CLV daily is pointless. Checking a failing ad campaign monthly is a recipe for wasted cash.
What's the Difference Between a KPI and a Metric?
This is a classic point of confusion, but the distinction is simple—and powerful.
Picture your car's dashboard. All the readings are metrics: engine temperature, tire pressure, RPMs. But the ones you actually rely on to get to your destination are your Key Performance Indicators (KPIs)—your speedometer and your fuel gauge.
A metric is just a number you can track (like website visitors or email opens). A KPI is a specific metric you’ve hand-picked because it directly measures progress toward a critical business goal (like new qualified leads per month).
So, all KPIs are metrics, but not all metrics are KPIs. Your social media follower count is a metric. The number of sales-qualified leads you generate from social media? That’s a KPI, because it's directly tied to the goal of driving revenue.
How Do I Choose the Right Metrics for My Business?
Stop guessing. The most effective way to choose the right marketing metrics is to work backward from what the business actually wants to achieve. Don't start with the data you have; start with the outcome you need.
Here’s a simple, three-step framework:
- Define Your Primary Business Objective: Get specific. Is it to grow overall revenue by 20% this year? Or maybe to break into a new market segment within six months? Write it down.
- Identify the Supporting Marketing Outcomes: What has to happen in marketing for that objective to become a reality? To hit that 20% revenue goal, you might need to "generate 500 new sales-qualified leads" or "increase customer retention by 10%."
- Select the Metrics That Measure Those Outcomes: Now, and only now, you pick your tools. To measure those 500 leads, you'll track Cost Per Lead (CPL) and Lead Conversion Rate. For retention, you'll watch Churn Rate and Repeat Purchase Rate.
This top-down approach forces every metric on your dashboard to justify its existence. No passengers allowed.
What Are Vanity Metrics and Should I Ignore Them?
Vanity metrics are the numbers that make you feel good but don't actually tell you much about the health of the business. Think social media likes, total page views, or your raw number of email subscribers. They look great in a presentation but often have a weak-to-nonexistent link to revenue.
But should you ignore them completely? Not necessarily.
While they should never be your main measure of success, they can act as useful early warning signals or indicators of top-of-funnel health. A sudden explosion in social media likes could be a sign of growing brand awareness—the very first step in your customer journey.
The trick is to know what they're good for and what they aren't.
| Metric Type | Purpose | Example | What It Really Means |
|---|---|---|---|
| Vanity Metric | Signals top-of-funnel activity or brand reach. | 10,000 new followers. | "More people are aware of our brand." |
| Actionable Metric | Measures progress toward a business goal. | 15% lift in conversion rate from social traffic. | "Our social strategy is now generating leads." |
Use vanity metrics as a canary in the coal mine, but always connect them to the actionable metrics that prove you're making a real impact.
Ready to stop reacting and start predicting? marketbetter.ai uses an integrated AI approach to turn your marketing data into a powerful roadmap for the future. Our platform helps you automate budget allocation, predict which leads will convert, and generate high-performing content at scale. Discover how marketbetter.ai can elevate your marketing strategy today.