
3 posts tagged with "data-driven marketing"

View All Tags

B2B Marketing Analytics: Your Actionable Guide to Growth

· 24 min read

Let’s get one thing straight: B2B Marketing Analytics isn't just about collecting data. It’s the art and science of turning that raw data—from every campaign, click, and customer chat—into a strategic weapon. For any B2B company navigating long sales cycles and crowded buying committees, it’s the only way to figure out what’s actually moving the needle on revenue.

Decoding B2B Marketing Analytics

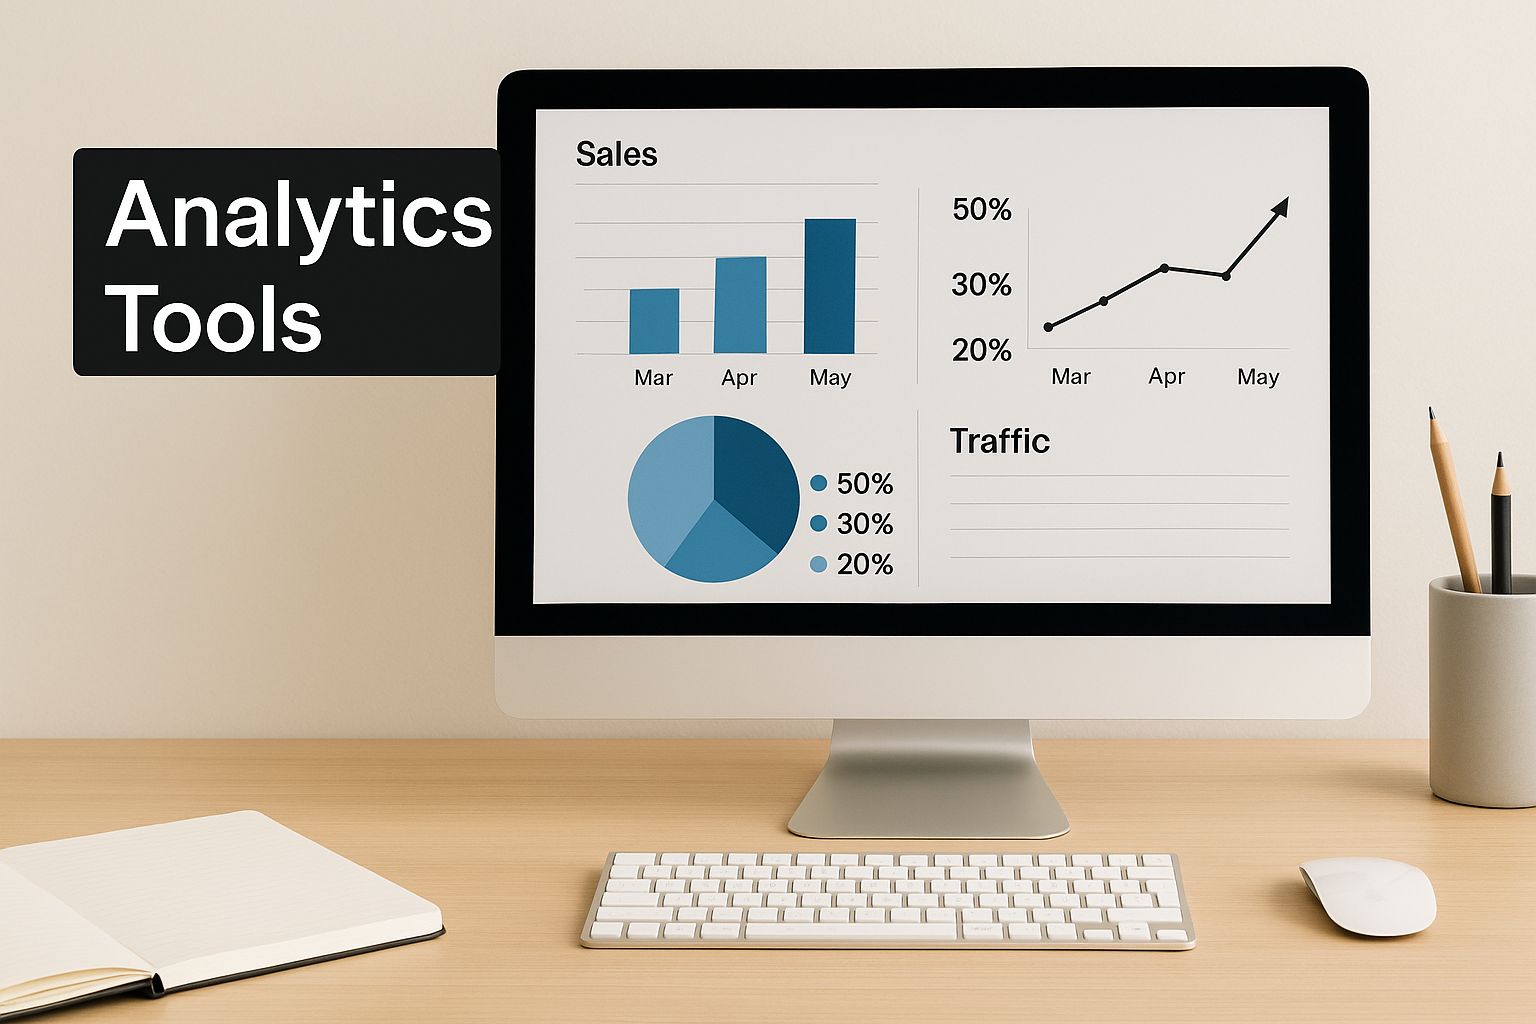
Picture your marketing strategy as a complex, cross-country road trip. You could just start driving and hope for the best, but you’ll probably get lost. B2B marketing analytics is your advanced GPS—giving you real-time data, turn-by-turn directions, and traffic alerts to make sure you get where you’re going efficiently.

It’s the engine that transforms a messy spreadsheet of numbers into a clear, strategic roadmap.

Instead of obsessing over surface-level metrics like clicks or social media likes, this discipline zeroes in on what directly connects your work to business outcomes. It’s about answering the tough questions that keep marketers up at night:

  • Which channels are really bringing in qualified leads?
  • How did that webinar series actually impact pipeline speed and deal size?
  • What’s the true ROI on our ad spend this quarter?

This is what moves a team from making decisions on gut feelings to making them based on hard evidence.

Why It’s Non-Negotiable Today

The modern B2B buyer’s journey is a maze. The sales cycle has stretched out, and there are more people and touchpoints involved than ever before. In fact, research shows a typical B2B deal now involves an average of 62 or more touchpoints over six months, with at least seven decision-makers weighing in. You can dig into more of these trends with these 2025 statistics.

Trying to navigate this without analytics is like flying blind. You’d have no idea that a prospect first read a blog post, then attended a webinar a month later, and finally clicked a retargeting ad right before they agreed to a sales call. Each of those interactions is a critical piece of the puzzle.

B2B marketing analytics isn't just about reporting what happened; it’s about understanding why it happened and predicting what will happen next. It provides the proof needed to justify budgets, align with sales, and build a predictable engine for growth.

The Actionable Difference: B2B vs. B2C Analytics

Sure, both B2B and B2C marketers use analytics, but they are playing entirely different games. B2C analytics is often a sprint, focused on high-volume, short-term conversions like an immediate online purchase. It's a numbers game where success is often measured by cost per acquisition for a single transaction.

B2B marketing analytics, on the other hand, is a marathon. It’s built to track long, complex journeys that can span months or even years. The focus here is on lead quality over quantity, and success is measured with metrics like pipeline generation, customer lifetime value (CLV), and account-level engagement—not just one-off transactions. That strategic depth is what separates guesswork from predictable success.

The Essential B2B Marketing Metrics to Track

Let's cut through the noise. Too many teams get lost chasing vanity metrics that look good in a slide deck but don't actually move the needle. True B2B marketing analytics is about focusing on what drives revenue, period.

This section breaks down the core metrics by funnel stage, helping you turn your dashboard from a simple report into a decision-making machine.

Think of it like this: your strategy is the blueprint. That blueprint dictates what data you collect, which in turn generates the insights you need to grow.

Infographic about b2b marketing analytics

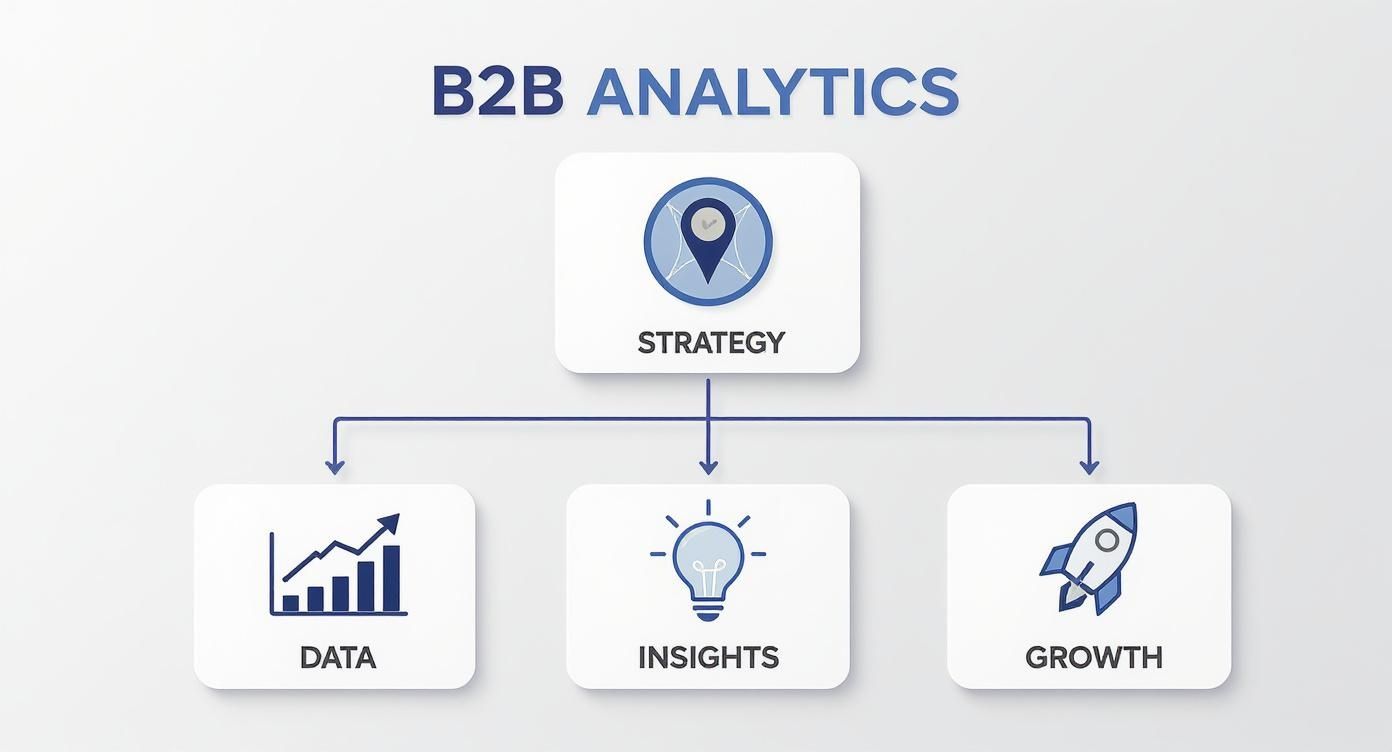
This whole process starts with a solid strategy, which guides your data capture, fuels your insights, and ultimately powers real, scalable growth.

Top Of Funnel Metrics

At the top of the funnel, it's all about awareness and initial interest. These metrics tell you which channels are attracting the right prospects. Forget raw traffic; focus on metrics that signal genuine intent.

Key metrics to watch here are MQLs, organic traffic quality, and paid channel performance.

  • Marketing Qualified Leads (MQLs): This is your first real signal of interest. Are people raising their hands by downloading a guide or signing up for a webinar?
  • Organic Traffic: This isn't just about volume. Track which specific blog posts or landing pages generate the most leads to understand which SEO efforts connect with your audience's problems.
  • Paid Traffic: This measures the immediate impact of your ad spend. Compare Cost Per Click (CPC) against Cost Per MQL to see which campaigns are not just cheap, but effective.

Here’s an actionable comparison of these top-of-funnel metrics:

MetricWhat It Really Tells YouHow to Improve It
MQLsLead volume and the quality of your sources.Action: A/B test your landing page headlines and simplify form fields to two or three essential questions.
Organic TrafficKeyword relevance and content reach.Action: Identify your top 5 lead-generating blog posts and create more content around those core topics.
Paid TrafficAd targeting and message-market fit.Action: Pause your bottom 10% of performing ads (by cost per MQL) and reallocate that budget to the top performers.

If your MQL conversion rate dips below 5%, that’s a red flag. It might be time to test a new lead magnet or simplify your forms. A small, data-driven tweak here can boost engagement before you even think about scaling your budget.

But remember, volume alone isn't the goal. Quality is what matters next.

Middle Of Funnel Metrics

Once you have their attention, the middle of the funnel is where you deepen engagement and figure out who is genuinely a good fit. These metrics track the interactions that turn casual interest into qualified conversations.

  1. Sales Qualified Leads (SQLs): These are the MQLs that sales has vetted and accepted. It's the critical handoff point and the ultimate measure of lead quality.
  2. Content Engagement: Are people actually consuming your stuff? Track downloads, video views, and webinar attendance to see what resonates. Compare engagement rates between different content formats (e.g., webinars vs. whitepapers).
  3. Email Open and Click Rates: This shows which nurture sequences are working and which are falling flat. If open rates are high but click rates are low, your subject line works but your call-to-action is weak.

Mid-funnel insights are your secret weapon. They help you optimize your messaging and timing long before a deal is even on the table.

These numbers tell you exactly which assets and channels are moving leads closer to a sale. For instance, if you notice that webinar attendance drives a 20% lift in SQLs compared to ebook downloads, it's a no-brainer—allocate more budget to live events and the follow-up sequences that support them.

Bottom Of Funnel Metrics

This is where the rubber meets the road. Bottom-of-funnel metrics connect your marketing efforts directly to revenue and the speed at which you close deals.

One of the most critical numbers for any B2B marketer to master is their customer acquisition cost (CAC).

  • Customer Acquisition Cost (CAC): How much does it really cost you to win a new customer? This grounds your strategy in financial reality.
  • Customer Lifetime Value (CLV): This reveals the long-term revenue you can expect from each account, telling you who your most valuable customers are. Your goal should be a CLV:CAC ratio of at least 3:1.
  • Pipeline Velocity: How fast are deals moving through your sales stages? This is a key indicator of your sales cycle's health.

A healthy pipeline velocity often means shorter deal cycles. As a rule of thumb, aim to move deals through each stage in under 30 days to maintain momentum. If things are stalling, you know exactly where to look.

To really connect these numbers to overall business performance, check out our guide on calculating marketing ROI.

Best Practices For Metric Management

Knowing the metrics is one thing; managing them effectively is another. Here are actionable steps to take.

  • Talk to sales weekly. Review MQL-to-SQL conversion rates together to spot trends and align on lead quality. Ask them "Why was this lead rejected?" to get direct, actionable feedback.
  • Benchmark your financials monthly. Keep a close eye on CAC and CLV to find opportunities for cost optimization. If CAC is rising, analyze channel performance to cut inefficient spend.
  • Monitor pipeline velocity daily. This allows you to catch bottlenecks before they derail a whole quarter. If deals are stuck in one stage, investigate with sales immediately.
  • Visualize everything. Use simple dashboards to communicate what matters to stakeholders and non-technical teams at a glance.

A metric measured is a metric improved.

Pro Tip: Schedule a standing monthly analytics review with your sales team. This single meeting can solve a ton of cross-departmental friction and uncover powerful insights.

For example, one SaaS firm I know improved its pipeline velocity by 25% in a single quarter just by tightening its SQL criteria based on feedback from these meetings.

By tracking these key metrics, you transform analytics from a reporting chore into a proactive engine for growth.

Building Your B2B Analytics Tech Stack

Your B2B marketing analytics are only as good as the tools you use to collect and connect the data. Building a tech stack isn't about buying the most expensive software on the shelf; it's about creating a single, interconnected system where information flows freely. This gives you a complete, honest picture of the customer journey.

Think of it like assembling a high-performance engine—each part has to work perfectly with the others.

The goal is to build a single source of truth and tear down the data silos that keep your teams guessing. When your web analytics platform, CRM, and marketing automation software are all talking to each other, you can finally connect a blog post someone read six months ago to the deal they just signed today. That unified view is where effective B2B marketing analytics truly begins.

Screenshot from https://analytics.google.com/analytics/web/

A dashboard like this from Google Analytics is ground zero. It lets you see which channels are actually bringing in engaged users, helping you decide where to put your budget and what kind of content to create next.

The Core Pillars of Your Analytics Stack

A powerful, no-nonsense stack is built on four essential tool categories. Each one plays a distinct role, but their real magic is unlocked when they're all hooked together.

  1. Web Analytics Platforms: This is your top-of-funnel lens. Tools like Google Analytics 4 (GA4) are non-negotiable for understanding how people find and interact with your website. They answer critical questions like, "Which blog posts are generating the most MQLs?" or "Why are people bouncing from our pricing page?"

  2. Customer Relationship Management (CRM): Your CRM is the heart of the entire operation. Platforms like Salesforce or HubSpot act as the central database for every lead and customer. This is where you track every touchpoint a contact has with your sales team, from the very first email to the final signature.

  3. Marketing Automation Platforms: This is where you connect marketing actions to actual lead behavior. Tools like Marketo or the automation suites built into HubSpot handle things like lead nurturing, email campaigns, and scoring. They tell you which leads are warming up and are actually ready for a sales conversation.

  4. Business Intelligence (BI) Tools: Once you have data flowing from the other three pillars, you need to make sense of it. BI tools like Looker Studio or Tableau are designed to visualize that data. They pull everything into unified dashboards that make complex information easy for anyone in the company to understand at a glance.

Your tech stack should tell a cohesive story. If your CRM shows a new customer just signed, but your web analytics has no idea where they originally came from, you have a massive blind spot in your B2B marketing analytics strategy.

Choosing Tools That Actually Fit Your Needs

The right tools depend entirely on your company's size, budget, and the complexity of your sales cycle. A startup's needs are a world away from a global enterprise's.

Here’s a practical look at how that breaks down:

Company SizeWeb AnalyticsCRM & Marketing AutomationBI Tool
Small Business / StartupGoogle Analytics 4 (Free)An all-in-one like HubSpot StarterLooker Studio (Free)
Mid-Market CompanyGA4 / MatomoSalesforce integrated with Pardot or MarketoTableau / Power BI
EnterpriseAdobe AnalyticsSalesforce (highly customized) with a dedicated automation platformCustom BI solution

The real key here is integration. A small business running on HubSpot can see a contact's entire journey—from their first ad click to their latest sales call—all in one place. An enterprise, on the other hand, might need a more sophisticated setup to connect a dozen different systems. For a closer look at tying it all together, see our guide on customer data platform integration.

At the end of the day, the best stack isn't the one with the most bells and whistles. It's the one your team actually uses—one that provides clear, actionable insights that get marketing and sales working from the same playbook. Start with your core needs, pick tools that play well together, and build from there.

Choosing the Right B2B Analytics Framework

Having the right tools and metrics is one thing, but they're just pieces of the puzzle. To really turn raw data into a predictable growth engine, you need a strategic framework. Think of it as the operating system for your entire marketing analytics effort, the thing that connects your day-to-day actions directly to business outcomes.

It’s a bit like building a house. Your tech stack is the toolkit, and your metrics are the raw materials—the lumber, pipes, and wires. But the framework? That’s the blueprint. It tells you how to put everything together to build something that actually stands up. Without that blueprint, all you've got is an expensive pile of wood.

In modern B2B, two dominant frameworks shape how we measure success: Multi-Touch Attribution (MTA) and Account-Based Marketing (ABM) analytics. The right choice for you comes down to your business model, how long your sales cycle is, and your overall go-to-market strategy.

Multi-Touch Attribution: Unpacking the Entire Journey

Multi-Touch Attribution (MTA) sets out to solve one of marketing's oldest headaches: figuring out which of your many, many efforts actually helped close a deal. Instead of dumping all the credit on the very last click—like a demo request form—MTA spreads that credit across multiple touchpoints along the buyer's journey.

This is absolutely critical in B2B, where a single deal can involve dozens of interactions stretched out over months. An MTA framework helps you finally see the value in everything, from that first blog post a prospect read six months ago to the webinar they attended right before signing up.

There are several ways to slice this pie, and each model tells a slightly different story:

  • Linear Model: Simple and democratic. It gives equal credit to every single touchpoint along the path. Use this when: Your sales cycle is long and you want to understand the general impact of all channels.
  • U-Shaped Model: Puts the spotlight on two key moments, giving 40% of the credit to the first touch and 40% to the lead conversion touch. The remaining 20% is sprinkled across all the interactions in between. Use this when: Lead generation is your primary marketing goal.
  • W-Shaped Model: Similar to the U-shaped model but adds a third major milestone—the opportunity creation. It gives 30% credit to the first touch, 30% to opportunity creation, and 30% to the close. Use this when: You want to give equal weight to marketing and sales handoff points.

To really get under the hood of how these work in the real world, check out our detailed guide on Multi-Touch Attribution models. Picking the right one helps you see which "assists" are just as valuable as the final "goal."

Account-Based Marketing Analytics: Focusing on High-Value Targets

While MTA is all about the individual's journey, Account-Based Marketing (ABM) analytics flips the script entirely. It focuses all measurement on a hand-picked list of high-value accounts, not individual leads. The core question isn't, "Which channels are generating the most leads?" It’s, "Are we successfully engaging and penetrating our most important target accounts?"

This framework is a perfect fit for companies selling big-ticket items to large organizations with complex buying committees. Here, success isn't about the sheer volume of MQLs; it’s about the depth of engagement across a target account.

Key ABM metrics you'll live and breathe include:

  • Target Account Engagement: Are the key contacts at your target companies actually interacting with your content, ads, and salespeople?
  • Account Penetration: How many of the decision-makers within a single target account have you managed to engage?
  • Pipeline Velocity: How quickly are your target accounts moving from one stage to the next?

This razor-sharp focus is what helps align sales and marketing teams so they can move as one.

Comparing Analytics Frameworks: Multi-Touch Attribution vs. ABM

The debate between MTA and ABM isn't about which one is "better"—it's about which one is better aligned with your strategy. To make the choice clearer, let's put them side-by-side.

FeatureMulti-Touch Attribution (MTA)Account-Based Marketing (ABM) Analytics
Primary FocusTracking the impact of every touchpoint in a lead's journey.Measuring engagement and penetration within high-value target accounts.
Unit of MeasureIndividual leads and conversions.Target accounts and the buying committee within them.
Best ForCompanies with a high volume of inbound leads and diverse marketing channels.Businesses selling high-ticket items to a limited number of large accounts.
Key Question"Which marketing channels are most effective at driving conversions?""Are we deepening our relationships with our most important accounts?"

The rise of AI is also changing how these frameworks get put into practice. A 2025 study found that 62% of B2B marketers are already using AI for brainstorming and content creation, which fuels both the broad-reach campaigns measured by MTA and the highly-targeted plays tracked by ABM. You can dig into more stats on how AI is shaping B2B marketing strategies on seoprofy.com.

Ultimately, the best framework is the one that gives you the clarity to make smarter, data-driven decisions. It’s about turning your analytics into a predictable, repeatable source of revenue.

Common B2B Analytics Mistakes to Avoid

Even with the right tools and a solid framework, a few common pitfalls can completely derail your B2B marketing analytics. I've seen it happen time and again. Knowing what these mistakes are is the first step to sidestepping them and turning potential failures into the kind of learnings that actually sharpen your strategy.

A person looking at a complex chart, representing the challenge of B2B analytics

Think of this section as your troubleshooting guide. We'll walk through the classic blunders that undermine analytics and give you clear, actionable ways to keep your data-driven engine running smoothly.

Focusing on Vanity Metrics Over Revenue

This is probably the most common trap: mistaking activity for progress. It feels great to celebrate a big spike in social media followers or a jump in website traffic, but those numbers are hollow if they don’t connect back to revenue.

The Mistake: Reporting on "impressions" and "likes" instead of "marketing-sourced pipeline" and "cost per SQL." The Fix: Tie every marketing KPI back to a sales outcome. Constantly ask yourself, "How does this metric tie to pipeline?" Instead of just reporting on traffic, report on the traffic that converts to leads. Don't just celebrate ebook downloads; track which of those downloads actually progress to a sales opportunity.

Letting Data Live in Silos

Data silos are the silent killers of any good analytics strategy. When your web analytics, HubSpot CRM, and marketing automation platform aren't talking to each other, you're looking at a fractured, incomplete picture of the customer journey.

The Mistake: Analyzing channel performance in separate platforms without a unified view. You see a Google Ad drove a form fill, but miss the five blog posts and two webinars they engaged with first. The Fix: Make your CRM the central hub. Ensure it pulls in data from all other platforms to create a single, unified customer record that tracks every interaction. This is the only way to see the complete journey from first touch to final sale.

The only solution is integration. Your tech stack needs to operate like a single, cohesive system. Make sure your CRM is the central hub, pulling in data from all your other platforms to create one unified customer record that tracks every single interaction, from the first touch to the final sale.

Suffering From Analysis Paralysis

With so much data at our fingertips, it's incredibly easy to get overwhelmed. Analysis paralysis is what happens when you spend so much time digging through data that you never actually get around to taking action. It's a classic case of majoring in the minors.

The Mistake: Building a dashboard with 50 different charts and trying to monitor everything at once. The Fix: Create focused, role-based dashboards. Your CMO needs a high-level view of ROI and pipeline. A content manager needs to see blog performance and MQLs. They do not need to see the same things.

Actionable Tip: Start each week by identifying one key question you want your data to answer. For example, "Which channel produced the most sales-qualified leads last month?" This targeted approach turns an overwhelming sea of data into a single, actionable insight.

Putting Your B2B Analytics Into Action

A report gathering dust on a drive does no one any good. You need to weave your analytics into daily routines so data becomes your company’s compass rather than just another file in a folder.

This shift moves B2B analytics from a marketing afterthought into a strategic asset that shapes decisions across the board. It takes time, patience, and a clear set of steps—but the payoff is huge.

From Dashboards To Decisions

A dashboard nobody looks at is like a map you never unfold. If the charts confuse more than they clarify, they’ll collect virtual cobwebs.

Focus on role-specific views. Not everyone needs every data point.

  • Leadership Dashboards: Show the link between spend and revenue—pipeline growth, marketing ROI, CAC and CLV trends.
  • Sales Views: Highlight top-performing lead sources and the MQL quality they deliver.
  • Marketing Specialist Panels: Drill into campaign metrics, channel performance, and content engagement for everyday tweaks.

Each team gets a dashboard that feels built just for them. That way, data moves from curiosity to action.

Fostering A Test And Learn Mindset

A mature data culture treats every campaign like a lab experiment. You don’t launch and hope—you state a clear hypothesis, measure the outcome, then iterate.

Say you roll out a new email sequence. Instead of “Let’s see if it works,” frame it this way: “We believe adding a customer story at the mid-funnel stage will boost demo requests by 15%.”

Hit the target? Great. Miss it? You’ve still learned something vital. Data becomes the impartial judge, not a weapon for blame.

The goal is to use data to prove or disprove ideas, not to prove who was right. This approach sparks curiosity, not defensiveness.

Creating Data-Driven Rituals

Insights vanish if they’re not revisited. Build regular check-ins where data is front and center.

Meeting TypeFrequencyAttendeesPrimary Goal
Weekly Stand-upWeeklyMarketing TeamReview last week’s top metrics and make tactical tweaks.
Monthly Strategy ReviewMonthlyMarketing & Sales LeadershipAssess MQL-to-SQL conversion and plan for the next cycle.

Think of these sessions as a habit loop. Weekly stand-ups keep you nimble; monthly reviews align long-term strategy. Over time, your teams will instinctively reach for the data first—no reminders needed.

By turning analytics into a shared practice, you build an organization that learns and adapts. Every major choice hinges on clear, actionable insights, not gut feelings.

Got Questions About B2B Marketing Analytics? We've Got Answers.

Jumping into B2B marketing analytics can feel like trying to drink from a firehose. But once you get a handle on a few core ideas, everything starts to click. Let's tackle the questions that come up most often, with answers you can actually put to work.

How Do I Choose Between Lead-Based and Account-Based Analytics?

This decision comes down to your sales motion, pure and simple. Think of it as the difference between fishing with a wide net and fishing with a spear.

Lead-based analytics is your wide net. It's the right call when your main job is to pull in a high volume of individual leads from every channel you can. Here, you're obsessed with metrics like MQLs per channel and your cost per lead. This approach is ideal for businesses with a shorter sales cycle and a broad target market.

On the other hand, account-based analytics is like spearfishing. You've already picked out your big-game targets. Your goal isn't volume; it's measuring how deeply you're engaging with those specific accounts. You'll be tracking things like account penetration (how many key contacts have we touched?) and pipeline velocity for your named accounts. This is best for companies with a long sales cycle, high contract values, and a defined set of target companies.

What's a Good MQL-to-SQL Conversion Rate?

Look, benchmarks are all over the place, but a healthy MQL-to-SQL rate usually lands somewhere between 10% and 30%. But honestly, the exact number is less important than its trend. Is it going up or down?

If your rate is dipping below 10%, that's a big red flag for misalignment between marketing and sales. It probably means your MQL definition is way too loose, or the content you're creating just isn't hitting the mark with the right people.

Actionable Fix: Set up a weekly meeting with your sales team. Pull up the list of rejected leads and ask one simple question: Why? That single conversation will give you more actionable insight than a dozen dashboards and help you dial in your targeting almost overnight.

How Often Should I Check My Analytics Dashboards?

Trying to watch everything, every day, is a fast track to burnout. You'll get lost in the noise and miss what actually matters. Instead, use a tiered approach so you're looking at the right data at the right time.

  • Daily Check-ins (5 minutes): This is just for pacing. Focus on your paid campaigns. Are you on track to hit your budget and lead goals for the month? This is all about catching fires before they get out of control.
  • Weekly Reviews (30 minutes): Now you can dig into channel performance. Which blog posts, ads, or emails drove the best engagement last week? This is where you make your tactical tweaks.
  • Monthly & Quarterly Strategy Sessions (1-2 hours): Time to zoom out and look at the big picture. Analyze your Customer Acquisition Cost (CAC), pipeline velocity, and marketing-sourced revenue. These are the meetings that shape your strategy and budget for the next quarter.

This rhythm makes sure you’re reacting quickly to small things while saving the big strategic calls for when you have enough data to move with confidence.


Ready to stop guessing and start building a predictable marketing engine? The marketbetter.ai platform uses AI to connect your data, optimize your campaigns, and give you the clear, actionable insights you need to drive real growth. See how you can transform your B2B marketing analytics by visiting https://www.marketbetter.ai.

Unlock Success with Predictive Analytics in Marketing

· 23 min read

For years, marketing felt like driving down a highway while only looking in the rearview mirror. We’d pour over last quarter's campaign data, trying to figure out what worked yesterday. It’s a purely reactive game—like trying to steer a ship by watching its wake. Sure, it tells you where you’ve been, but it offers zero help with what’s coming up ahead.

Predictive marketing completely flips the script.

Think of it as having a real-time GPS with live traffic updates. Instead of just looking back, you’re now using data to see the road ahead. Predictive analytics in marketing doesn't just report on what happened; it forecasts what your customers are likely to do next. That shift from guesswork to informed strategy is a massive competitive advantage.

From Reactive to Proactive Strategies

The real change is in the questions we can finally ask. A traditional marketer asks, "Which customers bought our product last quarter?" But a predictive marketer asks, "Which customers are most likely to buy our product next week?"

This proactive mindset transforms how marketing gets done:

  • Audience Targeting: Forget casting a wide net with broad demographics. Now you can pinpoint the actual individuals with the highest probability of converting.
  • Customer Retention: Instead of finding out about churn after it’s too late, you can identify customers who are at risk of leaving and step in with the right offer to keep them.
  • Budget Allocation: You can put your marketing dollars into the channels that are forecasted to deliver the best ROI, before you even spend them.

Predictive analytics doesn't just tweak marketing—it redefines the entire goal. The objective is no longer just to reach a big audience. It’s about engaging the right person at the exact moment they’re ready to listen.

The New Standard for Modern Marketing

This kind of tech used to be locked away in the ivory towers of massive companies with teams of data scientists. Not anymore. The rise of more accessible AI and machine learning has put these tools in the hands of businesses of all sizes.

Now, you can use predictive models to optimize everything from a simple email subject line to a complex, multi-channel customer journey. Understanding how this powers modern tactics like data-driven content marketing is the key to seeing why it’s no longer optional. It delivers a level of personalization and raw efficiency that was pure science fiction just a decade ago, making it an essential part of any serious marketing strategy today.

How Predictive Analytics Actually Works

A marketer analyzing complex data charts on a computer screen.

Predictive analytics might have a futuristic ring to it, but the concept is surprisingly straightforward. Think of it like a master chef who knows exactly which ingredients to combine to get the perfect dish every single time. It's about looking at what you have (your data) to create a recipe for what's coming next (an accurate prediction).

This isn't just about reporting on past performance. It’s about forecasting the future.

This forward-looking magic is powered by machine learning algorithms. These algorithms are built to dig through mountains of historical data, finding the subtle patterns and hidden connections a human would miss. That’s the real secret sauce of predictive analytics in marketing—it spots the quiet signals that come right before a customer makes a move.

But here’s the catch: the whole thing falls apart without the right data. The quality and variety of the information you feed the system determines everything. You can't cook a gourmet meal with bad ingredients.

The Key Ingredients: Your Data

To make accurate predictions, these models need a rich diet of different data types. Each one adds another layer to the customer's story, giving the algorithm a much clearer picture to analyze.

The main data sources are:

  • Behavioral Data: This is all about what your customers do. Think website clicks, pages they linger on, emails they open, and content they download. It’s your direct line into their interests and engagement level.
  • Transactional Data: This covers what your customers buy. Purchase history, how often they order, average cart size, and returns—all of it reveals their buying habits and what they value.
  • Demographic Data: This is who your customers are. Age, location, job title, or company size for B2B. This data helps build the foundational segments you'll work from.

To really get how these models work, you have to start by understanding intent data, which is all about spotting the online behaviors that signal someone is ready to buy.

By blending these sources, you build a complete customer profile. The algorithm then finds the money-making correlations—like noticing that customers who view a specific product page three times are 85% more likely to buy in the next 48 hours.

Turning Data Into Actionable Predictions

Once the data is wrangled, the algorithms get to work building predictive models. These aren't generic, one-size-fits-all tools. They’re highly specialized, each trained to answer a specific marketing question.

Here are three of the most common predictive models you'll see in marketing:

Predictive ModelWhat It PredictsKey Business Question It Answers
Predictive Lead ScoringThe odds that a new lead will actually become a paying customer."Which leads should my sales team call right now?"
Customer Churn PredictionThe probability that a current customer is about to leave."Who is at risk of churning, and what can we do to save them?"
Customer Lifetime Value (CLV)The total revenue you can expect from a customer over their entire relationship with you."Who are our VIPs, and how do we find more people just like them?"

Each model spits out a clear, actionable score. A lead gets a 95 (hot) or a 20 (cold). A customer is given an 80% churn risk. This simple output shifts a marketing team from just reporting on the past to proactively shaping the future. If you want to see how these individual data points are woven together, our guide on person-level identification dives deep into the more advanced techniques.

This ability to see around the corner is why the AI in marketing industry is set to hit $107.5 billion by 2028. It’s the engine behind the hyper-personalized experiences that customers don't just want anymore—they expect.

Predictive Marketing vs. Traditional Marketing

For decades, marketing ran on a familiar playbook. It was a craft built on historical data, broad demographic segments, and a healthy dose of professional gut feeling.

Think of the traditional marketer as an archaeologist. They spend their time carefully digging through past campaign results to figure out what worked yesterday. It’s a method that relies entirely on looking backward.

Predictive marketing, on the other hand, is more like being an astronomer with a powerful telescope. Instead of digging in the dirt, you're charting the stars to forecast future movements. Predictive analytics in marketing doesn't just analyze what happened; it uses that data to calculate what’s most likely to happen next. This single shift flips the entire discipline from reactive to proactive.

This is a fundamental change that impacts everything, from how you see your audience to how you spend your budget.

The Audience Building Shift

In traditional marketing, we built audiences using static, broad buckets. A classic approach was grouping people by demographics—think age, location, or job title. It's like sorting your music library by genre. Sure, it’s organized, but it tells you nothing about what someone actually wants to listen to right now.

Predictive marketing builds dynamic clusters based on behavior. It identifies customers not by who they are, but by what their actions suggest they will do. A predictive model might create a segment of "customers showing a 90% probability of buying a specific product in the next 7 days," completely independent of their demographics. That’s a far more precise and actionable way to target.

From Blasts to Personalized Journeys

Campaign execution is another area where the contrast is stark. The old way involved broad message blasts sent to those static segments. It was a one-to-many approach that just hoped the message resonated with enough people to scrape by with a positive return.

A predictive approach makes one-to-one personalized journeys possible at scale. Instead of a generic seasonal promo sent to everyone, a predictive campaign identifies an individual customer as a high churn risk and automatically sends them a personalized "we miss you" offer. The message, timing, and discount are all determined by their forecasted behavior.

The infographic below gives you a sense of the complex data modern analytics tools are crunching to make these kinds of sophisticated strategies a reality.

Infographic about predictive analytics in marketing

This kind of synthesis is what allows marketers to move beyond simple reporting and into true forecasting.

Forecasting ROI Instead of Just Reporting It

Perhaps the biggest advantage is how you measure results. Traditional ROI analysis is almost always a look in the rearview mirror. You run a campaign, wait for the dust to settle, and then report on what happened.

With predictive marketing, you can run pre-campaign forecasting. Models can estimate the potential conversion rates and revenue lift of different campaign strategies before you spend a single dollar. This leads to much smarter budget allocation and takes a significant amount of risk out of your marketing spend.

The core difference is simple: Traditional marketing reports on the past. Predictive marketing provides a roadmap for the future.

The market is catching on fast. By 2025, over 55% of businesses globally are expected to be using AI-powered predictive analytics to sharpen their decision-making. The global predictive analytics market is projected to rocket from $9.5 billion in 2022 to $41.2 billion by 2030, a testament to its massive growth and impact. You can dig into more research on the expansion of predictive analytics statistics to see its trajectory.

To make this crystal clear, here’s a side-by-side view of the old playbook versus the new one.

Predictive Analytics vs Traditional Marketing Approaches

This table breaks down the core differences, showing how a proactive, data-driven approach changes the game across key marketing functions.

Marketing FunctionTraditional Approach (Reactive)Predictive Analytics Approach (Proactive)
Audience BuildingStatic, demographic-based segments (e.g., "males, 25-34").Dynamic, behavior-based clusters (e.g., "users likely to convert").
Campaign ExecutionBroad, one-to-many message blasts.Personalized, one-to-one customer journeys.
ROI AnalysisAfter-the-fact reporting on past performance.Pre-campaign forecasting to predict outcomes.
PersonalizationBased on basic attributes like name or location.Based on predicted intent and future needs.
Primary GoalReach a wide audience and analyze what happened.Engage the right individual at the right time and shape what happens next.

The takeaway is straightforward: while traditional methods focus on what has already occurred, predictive analytics gives marketers the tools to anticipate and influence what will happen next.

Predictive Analytics in Action: Real-World Examples

Theory is one thing, but seeing predictive analytics in marketing actually work is another. The funny thing is, you probably bump into predictive models every single day without even realizing it. These aren’t just abstract ideas cooked up in a lab; they’re the engines quietly running some of the most personalized experiences you have online.

From the next show you binge-watch to the price you pay for a ride home, predictive analytics is in the driver's seat. Let’s pull back the curtain on four powerful examples and see how this tech goes from a buzzword to a bottom-line booster.

The Netflix Effect: Hyper-Personalized Recommendations

Ever wonder how Netflix seems to know exactly what you want to watch next? It’s not a lucky guess—it’s a world-class predictive recommendation engine. The platform doesn’t just see what you’ve watched; it crunches thousands of data points to figure out what you’ll probably love in the future.

And this goes way beyond just matching genres. Netflix’s models are looking at everything:

  • Viewing Habits: What time you watch, how long you stick around, and even if you pause or re-watch a particular scene.
  • Device Information: Are you on a big-screen TV, a laptop, or your phone? That context matters.
  • User Interactions: Everything from your search queries and ratings to which movie poster artwork you’re most likely to click on.

By piecing all this together, the algorithm predicts your tastes with almost spooky accuracy. The business result is simple but powerful: a more addictive user experience that keeps people from canceling their subscriptions. A happy, engaged subscriber sticks around.

Proactive Churn Prevention in Telecommunications

The telecom world is notoriously cutthroat, and customer churn is the monster under the bed. For companies like Verizon or AT&T, every customer who walks away is a big financial hit. So instead of waiting for people to leave, they use predictive analytics to spot who’s getting restless before they switch carriers.

They do this by building a churn prediction model that looks for subtle signs of unhappiness. These might be a sudden drop in data usage, a spike in calls to customer support, or recent billing problems.

The model assigns a "churn risk score" to every single customer. Anyone with a high score gets automatically flagged. This lets the retention team jump in with a proactive, personalized offer—maybe a special discount or a data plan upgrade—to convince them to stay loyal.

This is a complete shift from the old, reactive "exit survey" model to a smart, proactive retention strategy. It directly plugs a hole in the revenue bucket, saving customers who would have otherwise been long gone. To see how companies translate these kinds of insights into real wins, check out some of the detailed marketing analytics case studies that show the before-and-after.

Dynamic Pricing for Airlines and Ride-Sharing

If you’ve ever booked a flight or hailed an Uber during rush hour, you’ve been on the receiving end of predictive pricing. Airlines and ride-sharing apps don't just set a price and forget it; they use sophisticated models to adjust fares in real-time based on what they think demand will be.

These dynamic pricing models are constantly swallowing a stream of data to make their next move:

  • Historical booking patterns for a specific route.
  • Current search volume and website traffic.
  • External factors like the weather, local events, or upcoming holidays.
  • What the competition is charging right now.

With these inputs, the algorithm predicts what's coming. If it expects a huge surge in ride requests when a concert lets out, prices automatically go up. If it sees that a Tuesday morning flight is looking empty, fares drop to fill those seats. This whole strategy is about maximizing revenue by making sure the price is always perfectly matched to the predicted demand.

Smart Budget Allocation for E-Commerce Brands

For any e-commerce brand, the question of where to spend the next advertising dollar is a million-dollar one. Predictive models help take the guesswork out of it by forecasting the potential return on investment (ROI) from every marketing channel.

Instead of just looking at the last click before a sale, these models analyze the entire customer journey. They predict which channels are most likely to bring in high-value customers. For instance, a model might reveal that while social media ads get a ton of initial clicks, email marketing is 75% more likely to convert a big spender for a specific product line.

Armed with that kind of foresight, marketing teams can confidently shift their ad spend away from channels that aren't pulling their weight and double down on the ones with the highest forecasted ROI. This makes sure every dollar in the marketing budget is working as hard as it possibly can.

Your Five-Step Predictive Analytics Implementation Plan

A professional team collaborating on a predictive analytics implementation plan in a modern office.

Jumping into predictive marketing can feel like you’re trying to boil the ocean. It’s a huge concept. But you don't have to. The best way to get started is by breaking it down into a clear, step-by-step roadmap that builds a real predictive engine for your business.

This isn’t about flipping a switch and hoping for the best. It's a methodical process. And it doesn't start with algorithms or fancy tech—it starts with a simple, focused question about what you're trying to fix.

Let's walk through the five stages to make it happen.

Step 1: Pinpoint Your Core Business Objective

Before you look at a single data point, you need to know what you’re aiming for. A fuzzy goal like "improve marketing" is useless. You need a specific, measurable target that a predictive model can actually be trained to hit.

Start with a real pain point. Are you losing customers and you don't know why? Is your cost to acquire a new customer getting out of control? Are you leaving money on the table because one-time buyers never come back?

Frame that problem as a sharp, clear goal:

  • Reduce customer churn by 15% in the next six months.
  • Increase the conversion rate of new leads by 20% this quarter.
  • Boost customer lifetime value (CLV) by 25% over the next year.

This clarity is everything. Your objective is your North Star. It guides every decision you make from here on out and ensures all this work actually connects to real business value.

Step 2: Unify and Prepare Your Data

Your predictions are only ever as good as the data you feed them. To find meaningful patterns, predictive models need clean, consolidated, and complete data. The problem? For most companies, customer data is a mess, scattered across a dozen disconnected silos—your CRM, e-commerce platform, email tools, web analytics, you name it.

The mission here is to create a single customer view. This is a unified profile that stitches together every single touchpoint and interaction a person has with your brand. It’s non-negotiable. Fragmented data leads to half-baked analysis and, worse, flat-out wrong predictions.

This means you have to invest time in a data audit and cleanup. Standardize formats, zap duplicate entries, and make sure your historical data is accurate. It’s the least glamorous part of the process, but it’s the absolute bedrock of your success.

Step 3: Select the Right Tools for Your Team

Okay, you have a clear goal and clean data. Now it's time to pick your tech. The market for predictive analytics in marketing has exploded, with options for teams of all sizes and skill levels. You basically have two paths you can go down.

This table should help you figure out which approach fits your company best.

Tooling ApproachBest ForKey AdvantagesPotential Drawbacks
User-Friendly PlatformsTeams without data scientists who need quick wins.Out-of-the-box models, easy-to-use interfaces, and fast setup.Less customizable; might not solve super-specific business problems.
Custom-Built ModelsBig companies with data science teams and unique needs.Highly tailored to your exact goals, giving you maximum control.Expensive, takes a long time to build, and requires specialized talent.

For most marketing teams, starting with a platform that has predictive features already built-in is the most practical move. It lets you prove the value of this approach without needing a massive upfront investment in hiring a data science team.

Step 4: Train and Validate Your Predictive Model

Once your tool is in place, it’s time to train your model. This is where you feed all your historical data into the algorithm so it can learn the patterns that lead to your goal. For instance, to build a lead scoring model, you'd give it data on all your past leads—the ones that converted and the ones that went cold.

The model chews through thousands of data points to find the signals that matter. It might learn, for example, that a lead who downloads a specific whitepaper and then visits your pricing page is 80% more likely to buy. Our guide on AI lead scoring goes deeper into how these models build a smarter sales pipeline.

After the initial training, you have to validate the model's accuracy. You do this by testing it on a fresh set of data it has never seen before. This step is critical—it confirms that your model's predictions are reliable and not just a lucky guess based on the training data.

Step 5: Weave Insights into Action

Here's the bottom line: a perfect prediction is completely worthless if you don't do anything with it. The final, most important step is wiring the model's output directly into your day-to-day marketing. This is how you turn foresight into automated, personalized campaigns that actually drive revenue.

For example:

  • A churn prediction model can automatically enroll at-risk customers into a "we miss you" email campaign.
  • A lead scoring model can instantly push your hottest leads to the top of the sales team's queue.
  • A CLV model can trigger exclusive offers designed to delight your most valuable customers.

This is what modern marketing looks like. Instead of just reacting to what already happened, you're proactively shaping what happens next. You’re moving from rearview-mirror reporting to dynamic forecasting. By putting your predictions to work, you close the loop and turn raw data into real, measurable growth.

Common Questions About Predictive Marketing

Let’s get real. Diving into predictive marketing brings up a ton of practical, "how does this actually work for me?" questions. It's one thing to talk about algorithms and another to figure out the people, data, and budget you actually need to pull it off.

So, let's cut through the noise and tackle the most common concerns marketers have. Think of this as the straight-talk guide to getting started.

Do I Need a Team of Data Scientists?

This is the big one. The myth that stops so many teams before they even start.

The short answer? No—not anymore.

Sure, big enterprise companies might have a whole team of PhDs building custom models from the ground up. But that's like building your own car engine just to get to the grocery store. It's no longer the only way to get there.

Today, a new wave of marketing platforms has incredibly powerful predictive features built right in. These tools are designed for marketers, not coders. They do all the heavy lifting behind the scenes and serve up the insights on a silver platter.

The goal isn't to become a data scientist. It's to become a marketer who can use the outputs of data science to make much, much smarter decisions.

So, what's the right path for you?

ApproachBest ForWhat It Looks Like in Practice
In-House Data Science TeamHuge enterprises with unique, complex problems and even bigger budgets.Building proprietary algorithms from scratch to predict hyper-specific customer behaviors.
User-Friendly AI PlatformsPretty much every other B2B and B2C marketing team looking for proven, scalable solutions.Using a tool with "out-of-the-box" features like predictive lead scoring or churn risk analysis.

For most businesses, the smartest move is to find your biggest marketing headache and pick a user-friendly tool that solves it.

What Kind of Data Do I Really Need?

Here’s the thing about predictive models: they're only as good as the clues you give them. Garbage in, garbage out. The good news is you probably already have most of the data you need sitting right under your nose.

The trick is getting it all in one place. To start, you need a solid foundation of historical data, which usually breaks down into three buckets:

  • Transactional Data: All the "what" and "when." Purchase history, average order value, product categories, and subscription dates. This is the story of what your customers buy.
  • Behavioral Data: The "how." Website visits, email clicks, content downloads, app usage, and support tickets. This stuff reveals how customers actually engage with you.
  • Customer Data: The "who." Demographics, firmographics, location, job titles, company size, and how they found you in the first place. This adds critical context.

If you do one thing first, make it this: break down your data silos. Get everything flowing into a central hub, like your CRM or a Customer Data Platform (CDP). If your data is a scattered, messy disaster, your first and most important project is a data cleanup. Without that single source of truth, your predictions will never be reliable.

How Can I Measure the ROI of Predictive Analytics?

Proving the value of a new investment is always job number one for marketers. Thankfully, the impact of predictive analytics isn't some fuzzy, abstract concept—it’s incredibly measurable. The key is to set a clear baseline before you start and then run a clean comparison.

Here are four simple ways to nail down your ROI:

  1. A/B Test Your Campaigns: This is the cleanest test. Send a predictive, hyper-personalized offer to one segment. Send a generic offer to a control group. The difference in the conversion rate is your lift. Simple as that.
  2. Track Customer Retention: Use your churn model to flag a group of at-risk customers. Proactively reach out to half of them with a retention offer. Do nothing for the other half. The difference in the churn rate between the two groups is pure, measurable ROI.
  3. Compare Customer Lifetime Value (CLV): Look at the CLV of customers you brought in through predictive targeting versus those who came from your old methods. A higher CLV in the predictive group shows you’re not just getting more customers—you’re getting better customers.
  4. Calculate Cost Per Acquisition (CPA): When you stop wasting ad spend on leads who were never going to convert, your CPA naturally drops. Track this metric before and after you roll out predictive lead scoring to see exactly how much you’re saving.

By setting these KPIs from day one, you’ll have no trouble connecting your predictive efforts directly to revenue gains and cost savings.


Ready to stop guessing and start predicting? marketbetter.ai integrates powerful AI across your entire marketing workflow, from content creation to campaign optimization. Our platform makes it easy to turn data into revenue without needing a team of data scientists. Discover how you can drive growth with actionable insights by exploring our solutions.

Mastering Marketing Performance Metrics

· 26 min read

Marketing performance metrics are the numbers you track to see if your campaigns are actually working. They’re the hard data that tells you what’s a hit, what’s a miss, and where to put your budget next to get the best results.

Think of it this way: running a marketing campaign without metrics is like sailing a ship without a compass. You’re definitely moving, but you have no clue if you’re heading toward your destination or just drifting out to sea. Marketing performance metrics are your navigation system, giving you the critical feedback needed to steer your strategy with confidence.

Image

In a world where every dollar needs to be justified, these metrics are what turn marketing from a perceived cost center into a predictable revenue driver. They give you the proof you need to defend your budget, show your value, and fix small problems before they become massive headaches.

Turning Data Into Decisions

The real power of metrics is how they turn vague goals into something you can actually measure and improve. Instead of just "increasing brand awareness," you can now track specific numbers like social media reach, website traffic, and share of voice. It’s this shift from guesswork to guided action that separates the top-performing teams from everyone else.

We're all swimming in data these days. Projections show that by 2025, marketers will be using 230% more data than they were back in 2020. But here’s the catch: even with all this information, a shocking 56% of marketers feel they don’t have enough time to actually analyze it.

This is exactly why having a focused set of clear, actionable metrics is non-negotiable. They help you cut through the noise and zero in on the numbers that truly move the needle for your business.

“At the simplest level, you need to measure what you set out to achieve with your marketing objectives.”

To help you get started, it's useful to group metrics into a few key categories. Each one tells a different part of your marketing story.

Key Metric Categories at a Glance

This table gives you a quick rundown of the main types of marketing metrics and what they're designed to measure. Think of it as a cheat sheet for understanding the landscape.

Metric CategoryWhat It MeasuresExample MetricActionable Insight
Traffic & EngagementHow many people are finding your content and how they're interacting with it.Website SessionsCompare session sources (e.g., Organic vs. Social) to see which channel brings more traffic.
Conversion MetricsThe effectiveness of your marketing in prompting desired actions (e.g., sign-ups).Lead Conversion RateA/B test your landing page headline to see if you can increase the conversion rate by 5%.
Revenue & ROI MetricsThe direct financial impact and profitability of your marketing efforts.Customer Acquisition Cost (CAC)If CAC is rising, analyze your ad spend to cut underperforming campaigns.
Brand MetricsThe perception and awareness of your brand in the market over time.Share of Voice (SOV)Track SOV against competitors to gauge your market presence.
Customer MetricsThe health and value of your existing customer relationships.Customer Lifetime Value (CLV)Compare CLV of customers from different channels to find your most valuable audiences.

With these categories in mind, you can start building a dashboard that gives you a complete picture of your performance, not just isolated data points.

From Vanity to Value

One of the most common traps marketers fall into is obsessing over "vanity metrics" instead of "actionable metrics." The difference is critical.

  • Vanity Metrics: These are the numbers that look great in a report but don’t really connect to your business goals. Think of things like total page views or social media likes. They might feel good, but they don't tell you if you're making money.
  • Actionable Metrics: These numbers are directly tied to your bottom line. We're talking about things like Customer Acquisition Cost (CAC), Conversion Rate, and Return on Ad Spend (ROAS). These are the metrics that give you clear insights you can actually do something with.

Actionable Comparison: Imagine your page views went up 50% (vanity), but your conversion rate dropped 20% (actionable). The actionable metric tells you the new traffic is low quality, prompting you to review your targeting. The goal is to build a measurement framework that prioritizes real value over fluff. To get a deeper look at what truly matters, check out this excellent guide on how to measure advertising effectiveness.

Drowning in marketing data? I get it. The sheer number of metrics can feel overwhelming. The trick isn't to track everything, but to organize the numbers into a story that actually makes sense—one that follows your customer from their very first click to the final sale.

Let's cut through the noise. We can sort pretty much all marketing data into three simple tiers: Acquisition, Engagement, and Conversion. Think of it as a diagnostic tool. Each tier answers a critical question about your performance, helping you pinpoint exactly what's working and what’s falling flat.

Tier 1: Acquisition Metrics That Attract Customers

Acquisition is all about your first handshake. How well are you pulling new people into your world? These metrics live at the very top of your funnel, measuring your ability to grab attention and draw in potential customers before you've even had a real conversation.

This tier answers one fundamental question: "Are we reaching the right people, and what's it costing us?"

Here are the big three to watch:

  • Customer Acquisition Cost (CAC): This is the bottom line of your growth efforts. Simply put, it’s the total you spend on marketing and sales divided by the number of new customers you actually land. A high CAC can be a red flag for inefficient ad spend, while a low CAC is a sign you're growing profitably.
  • Cost Per Lead (CPL): A more granular look, CPL tells you how much you're shelling out for a single new lead. Comparing your CPL from Google Ads versus LinkedIn, for instance, shows you where your budget is working hardest.
  • Click-Through Rate (CTR): This is the percentage of people who see your ad and are compelled enough to click it. If your CTR is in the gutter, it’s a strong signal that your creative or ad copy just isn't hitting the mark.

A pro tip? Always compare your CAC to your Customer Lifetime Value (CLV). A healthy business model usually has a CLV that's at least three times higher than its CAC. If that ratio is off, it’s time to rethink your targeting or tighten up your messaging.

To really get a handle on performance, you need to see how all your channels work together. This is where owned, paid, and earned media come into play, feeding into your overall strategy.

Image

As you can see, a strong marketing foundation doesn't lean on just one pillar. It's a balanced mix of your own assets (like your website), paid campaigns, and the social proof that builds trust.

Tier 2: Engagement Metrics That Build Relationships

Okay, so you've got their attention. Now what? The next step is holding it. Engagement metrics tell you how people are interacting with your brand once they're in the door. This is where you separate the casual window shoppers from a genuinely interested audience.

This tier answers the question: "Is our content actually connecting with people?"

Think of a high bounce rate like someone walking into your store, taking one look around, and immediately leaving. It screams "This isn't what I expected!" By comparing the bounce rate of two different landing pages, you can quickly see which one is doing a better job of delivering on its promise.

Tools like Google Analytics are your best friend here, giving you a clear dashboard view of what’s happening.

Image

Dashboards like this make it easy to see which channels are bringing in the most engaged visitors, so you know exactly where to double down.

Keep an eye on metrics like Time on Page, Bounce Rate, and Social Media Interactions (likes, shares, comments). These are the numbers that tell you if your content is truly hitting home or just creating noise.

Tier 3: Conversion Metrics That Drive Revenue

This is it. The moment of truth. Conversion is where all your hard work turns into tangible business results. These are the "money metrics" that track actions directly tied to revenue—making a purchase, booking a demo, or downloading an ebook. They prove your marketing ROI.

They answer the most important question of all: "Are we actually making money from all this?"

While there are many conversion metrics, two reign supreme:

  1. Conversion Rate: The percentage of visitors who take the specific action you want them to. A dead-simple way to improve this? A/B test your calls-to-action (CTAs). I've seen a simple text change from "Learn More" to "Get Your Free Trial" literally double a page's conversion rate overnight.
  2. Return on Ad Spend (ROAS): This measures the raw revenue you generate for every single dollar you put into advertising. A 4:1 ROAS means you're making $4 for every $1 spent. Comparing ROAS across your different campaigns is the fastest way to find your most profitable channels and cut the fat.

Comparing Metrics Across Your Marketing Channels

Image

Treating all your marketing performance metrics the same is like using a hammer for every job in your toolbox—it’s clumsy, inefficient, and you'll probably break something. A metric that signals a huge win in one channel might be a total distraction in another. The real key is learning to speak the unique language of each platform.

A high Click-Through Rate (CTR) is a clear victory for a PPC ad, proving your copy and creative were sharp enough to grab immediate attention. But for an email campaign? The hero metric is often the Open Rate. That tells you if your subject line even earned a glance in a crowded inbox. Understanding these differences is what turns a generic marketing plan into a smart, channel-specific strategy.

SEO Success Metrics That Build Long-Term Value

Search Engine Optimization (SEO) is a marathon, not a sprint. The goal here isn't a quick burst of attention; it's about attracting high-quality, organic traffic by earning real estate on search engine results pages. Success isn’t measured in flashy, short-term spikes. It's all about steady, sustainable growth.

The SEO metrics that truly matter are the ones that build over time:

  • Organic Traffic: This is your bread and butter—the total number of visitors who find your site from a search engine. A steady upward trend means your content is hitting the mark with both search algorithms and actual humans.
  • Keyword Rankings: Tracking your position for target keywords tells you how visible you are for the exact terms your customers are using. Moving from page two to page one isn't just a small jump; it can exponentially increase your traffic.
  • Backlink Profile: Think of each high-quality backlink as a vote of confidence from another credible site. The quantity and quality of these "votes" are a massive signal to search engines that you're an authority worth listening to.

A powerful way to move the needle is to focus on topic clusters instead of isolated keywords. Build a central "pillar" page on a core topic and link out to related sub-topic articles. This strategy shows search engines you have deep expertise, improving rankings across a whole range of terms and driving more organic traffic over the long haul.

PPC Metrics That Drive Immediate Action

Pay-Per-Click (PPC) advertising is all about speed and precision. You’re paying for every interaction, so efficiency is the name of the game. The goal is to get immediate, measurable results by placing ads directly in front of a highly targeted audience.

For PPC, your dashboard should be focused on these core numbers:

  • Return on Ad Spend (ROAS): This is the ultimate bottom-line metric. It cuts through the noise and tells you exactly how much revenue you’re generating for every single dollar you put into your ads.
  • Cost Per Click (CPC): This shows you what you're paying for a single click. Keeping a close eye on CPC helps you spot cost-effective keyword opportunities and avoid getting dragged into expensive bidding wars.
  • Conversion Rate: A high CTR is great, but it doesn't pay the bills. This metric tracks the percentage of users who actually take the desired action—like making a purchase—after clicking your ad. If your conversion rate is low, it's a sign your landing page isn't delivering on the ad's promise.

To sharpen your PPC performance, you have to be constantly testing. A/B test your ad copy, your headlines, your calls-to-action, and your landing pages. Even a tiny tweak can have a massive impact on your ROAS.

Comparing channels reveals their unique strengths. SEO builds a foundational asset that generates traffic over the long term, while PPC acts as a faucet you can turn on for immediate, targeted leads. A strong strategy uses both in tandem.

Social Media Metrics That Foster Community

Social media marketing plays a different game. While it can absolutely drive sales, its primary strength lies in building brand awareness, fostering a community, and actually engaging with your audience. The metrics here are less about hard conversions and more about audience sentiment and interaction.

On social, you need to be tracking:

  • Engagement Rate: This is the sum of all interactions—likes, comments, shares, and saves. It’s a direct measure of how compelling your content is and whether your audience is leaning in to be part of the conversation.
  • Reach and Impressions: Reach is the number of unique people who see your content, while impressions are the total number of times it was displayed. Tracking both helps you understand just how far your brand's voice is carrying.

For marketers looking to get a much sharper picture of their audience, new tracking technologies are making a huge difference. You can learn more about how person-level identification is changing the game in our detailed guide.

Email Marketing Metrics That Nurture Leads

Email marketing is the workhorse of lead nurturing. It’s one of the most personal and effective channels for moving subscribers down the funnel by delivering valuable content straight to their inbox. It's where you build lasting customer relationships.

Success in email marketing comes down to these key indicators:

  • Open Rate: The percentage of recipients who opened your email. This is your first and most important hurdle, heavily influenced by your subject line and sender reputation.
  • Click-Through Rate (CTR): The percentage of people who clicked on a link inside your email. A solid CTR tells you that your message and call-to-action were compelling enough to spark action.
  • Unsubscribe Rate: The percentage of subscribers who opt out. A high rate is a massive red flag that your content is missing the mark or you're sending too frequently.

Recent data shows just how powerful this channel remains for tech companies. Email marketing continues to show its strength with an average open rate of 28%, proving it’s still a vital tool for engagement. This sits alongside other key benchmarks like a 3.2% CTR for LinkedIn Ads and an average Customer Acquisition Cost of $95, which are setting new standards for performance.

Channel-Specific Metric Comparison

To bring it all together, it's helpful to see these metrics side-by-side. Each channel has a different job to do, and therefore, a different scorecard.

Marketing ChannelPrimary GoalKey Metrics to TrackIndustry Benchmark Example
SEOBuild organic visibility, attract qualified trafficOrganic Traffic, Keyword Rankings, Backlinks5-10% monthly growth in organic traffic
PPCDrive immediate conversions and targeted leadsROAS, CPC, Conversion Rate4:1 ROAS (varies widely by industry)
Social MediaBuild community, increase brand awarenessEngagement Rate, Reach, Follower Growth1-5% average engagement rate on posts
Email MarketingNurture leads, drive repeat businessOpen Rate, CTR, Unsubscribe Rate28% average open rate (tech industry)

This table isn't about declaring a "winner"—it's about clarity. By focusing on the right metrics for the right channel, you stop comparing apples to oranges and start making smarter decisions that drive real growth across your entire marketing ecosystem.

Turning Numbers Into Results: A Framework That Actually Works

Knowing your marketing performance metrics is one thing. Actually improving them is the entire game. The difference between the two is having a repeatable process—a framework that takes you from staring at a dashboard to actively shaping the numbers on it.

This isn't complicated. It’s a simple, four-stage loop: Define, Measure, Analyze, and Optimize. Think of it as a flywheel. Each time you complete the cycle, your marketing gets a little sharper, a little smarter, and a lot more effective.

Step 1: Define Your Objective

Before you can fix anything, you have to know exactly what you’re trying to achieve. "Increase traffic" isn't an objective; it's a wish. A real objective is specific, measurable, and tied directly to a business outcome.

For example, don't just say, "get more leads." Instead, get specific: "Reduce Customer Acquisition Cost (CAC) by 15% in Q3 by improving lead quality from our paid search campaigns." See the difference? Now you have a clear target and a specific area to focus your energy on.

A well-defined objective is your North Star. It stops you from chasing shiny objects and keeps the entire team focused on what actually drives growth.

Step 2: Measure the Right Things

With a clear objective locked in, the next step is picking the right metrics to track your progress. This is where so many marketers get lost, drowning in dozens of numbers that don't actually matter for their specific goal.

If your objective is to slash CAC, you shouldn’t be obsessing over social media likes. Instead, you’d zero in on a few key performance indicators (KPIs) that are directly wired to that outcome.

  • Cost Per Click (CPC): How efficient is your ad spend at the very top of the funnel?
  • Cost Per Lead (CPL): How much are you actually paying to get a potential customer to raise their hand?
  • Lead-to-Customer Conversion Rate: This one’s crucial. It tells you if the leads you’re generating are actually any good.

Just comparing CPL across different campaigns can be a powerful diagnostic tool. If Campaign A has a CPL of $50 and Campaign B is running at $150, you immediately know where to start digging. A solid CRM is non-negotiable for tracking these numbers from the first click to the final sale.

Step 3: Analyze Your Performance

Now for the fun part: connecting the dots. Analysis is all about digging into the data to understand the "why" behind the numbers. Why is one ad campaign crushing it while another is a dud? Where's the bottleneck in your funnel?

You might discover your CPC is nice and low, but your Lead-to-Customer Rate is terrible. That’s a huge insight. It suggests your ad is great at getting clicks but it’s attracting the wrong crowd, or maybe your landing page isn’t delivering on the promise you made in the ad. This is the moment data becomes intelligence.

Here’s a snapshot of a Google Ads dashboard, a primary tool for measuring and analyzing paid campaign performance.

This gives you a high-level view of critical metrics like clicks, impressions, and cost, letting you quickly check the health of your campaigns. By drilling down into these numbers, you can start to figure out which ads and keywords are driving the most valuable actions.

Step 4: Optimize for Better Results

This is where you turn your analysis into action. Based on your insights, you’ll form a hypothesis and run a test to see if you can move the needle. Optimization isn't a one-and-done task; it's an ongoing process of experimenting, learning, and iterating. You make small, calculated bets to produce better outcomes.

Here are a few common scenarios and the optimization plays that follow:

  • If your CAC is too high: Your targeting is probably too broad. Try refining it to reach a more specific audience. A great first step is to test negative keywords to filter out all the irrelevant search traffic that's eating your budget. You can see how one of our partners did just that by reading about how LevelBlue optimized their ad spend in our case study.

  • If your conversion rate is low: Your landing page is the likely culprit. A/B test your headlines, your call-to-action (CTA) buttons, and the overall page layout. Sometimes a simple change from "Submit" to "Get My Free Guide" can make a world of difference.

  • If your ROAS is weak: Time to reallocate your budget. Be ruthless. Shift spending from the campaigns that are underperforming to your proven winners. Compare the ROAS of your social media ads to your search ads to find your most profitable channel, and then double down on it.

By running through this Define, Measure, Analyze, Optimize cycle again and again, you build a powerful engine for growth. You stop guessing what works and start building a marketing strategy based on hard evidence and real results.

The Future of Measurement: AI and Analytics are Changing the Game

For years, marketing performance metrics have been a rearview mirror. They show you where you’ve been—what worked last quarter, which campaign drove clicks last month. It’s useful, sure, but it’s always historical. You're constantly reacting.

The arrival of AI and predictive analytics is flipping that script entirely. It's turning measurement from a history report into a weather forecast, giving you a real shot at seeing what’s coming before it happens. This isn't just about getting reports faster; it’s about making smarter, proactive decisions instead of constantly playing catch-up.

This isn't some far-off trend, either. The AI marketing space was already worth around $20 billion in 2022 and is on track to hit $40 billion by the end of 2025. That’s not slow adoption—that’s a full-on sprint as businesses race to get an edge. If you're curious about the numbers, Cubeo.ai has a great breakdown of AI's marketing impact.

From Reactive to Predictive Measurement

So what's the real difference here? It’s all about the questions you can ask. A traditional dashboard tells you your Customer Acquisition Cost (CAC) last quarter. An AI model can forecast your CAC for the next quarter based on your planned ad spend and expected market shifts. See the leap? It’s the difference between reaction and prediction.

This is possible because AI can chew through massive datasets and spot subtle patterns a human analyst would almost certainly miss. It connects the dots between thousands of customer behaviors, market signals, and campaign results to make some remarkably accurate guesses about the future.

AI lets us move beyond asking, "What happened?" to asking, "What’s likely to happen next, and what should we do about it?" It turns your data from a record of the past into a roadmap for the future.

How AI is Actually Used in Marketing Analytics

This all sounds great in theory, but what does it look like on the ground? We’re talking about real tools that are already changing how marketing teams work and measure success.

Here are a few game-changing applications you can use today:

  • Predictive Lead Scoring: Forget manually assigning points for email opens. AI digs into thousands of data points—from website clicks to social media engagement—to figure out which leads are genuinely hot. This lets sales teams stop chasing ghosts and focus their energy where it’ll actually count. We have a full playbook on implementing AI-powered lead scoring if you want to go deeper.

  • AI-Driven Budget Allocation: Trying to manually spread a big ad budget across dozens of campaigns is a nightmare of spreadsheets and guesswork. AI algorithms can watch performance in real-time and automatically shift money to the channels and ads that are actually working, squeezing every last drop of value from your Return on Ad Spend (ROAS).

  • Customer Churn Prediction: AI is fantastic at spotting the quiet signals that a customer is about to bail. By analyzing past behavior, it can flag at-risk accounts, giving you a critical window to step in with a retention offer or some extra support before they’re gone for good.

The Old Way vs. The New Way

When you put them side-by-side, the difference is stark. One approach is static and historical; the other is dynamic and forward-looking. This table breaks down that fundamental shift.

CapabilityTraditional AnalyticsAI-Powered Analytics
FocusHistorical performance ("What happened?")Predictive outcomes ("What will happen?")
OptimizationManual A/B testing and tweaksAutomated, real-time optimization
AudienceBroad, demographic-based segmentsHyper-personalized, behavior-based micro-segments
InsightsShows you correlations in dataUncovers causal relationships—the "why"
SpeedWeekly or monthly reportsReal-time analysis and instant alerts

This isn't just about keeping up with the latest tech. By embracing these tools, you're building a system that can anticipate and adapt. You’re setting up your marketing to be a step ahead, no matter what changes come next.

Common Questions About Marketing Metrics

Image

Alright, we've covered the what and the why. But let's be real—the day-to-day work of wrangling marketing data always sparks a few questions. This is where the rubber meets the road.

Here are the practical hurdles and strategic puzzles I see marketers run into all the time, along with some straight-up, actionable answers to help you get unstuck.

How Often Should I Review My Marketing Metrics?

There’s no one-size-fits-all answer here. The right cadence depends entirely on what you're measuring. Think of it like this: some metrics are speedboats, and others are oil tankers. You don't pilot them the same way.

A simple way to break it down is by speed and impact:

  • Daily or Weekly Checks: These are your fast-moving, tactical numbers. Think PPC ad spend, website traffic, social media engagement, and conversion rates on a new campaign. These metrics can change on a dime and often need quick adjustments to stop a budget leak or double down on something that's working.
  • Monthly or Quarterly Reviews: This is for your big-picture, strategic metrics. We're talking Customer Lifetime Value (CLV), Customer Acquisition Cost (CAC) trends, and overall market share. Peeking at these every day is like trying to watch a plant grow—you won't see meaningful change, and you'll drive yourself crazy.

The key is matching your review cycle to the metric's nature. Checking CLV daily is pointless. Checking a failing ad campaign monthly is a recipe for wasted cash.

What's the Difference Between a KPI and a Metric?

This is a classic point of confusion, but the distinction is simple—and powerful.

Picture your car's dashboard. All the readings are metrics: engine temperature, tire pressure, RPMs. But the ones you actually rely on to get to your destination are your Key Performance Indicators (KPIs)—your speedometer and your fuel gauge.

A metric is just a number you can track (like website visitors or email opens). A KPI is a specific metric you’ve hand-picked because it directly measures progress toward a critical business goal (like new qualified leads per month).

So, all KPIs are metrics, but not all metrics are KPIs. Your social media follower count is a metric. The number of sales-qualified leads you generate from social media? That’s a KPI, because it's directly tied to the goal of driving revenue.

How Do I Choose the Right Metrics for My Business?

Stop guessing. The most effective way to choose the right marketing metrics is to work backward from what the business actually wants to achieve. Don't start with the data you have; start with the outcome you need.

Here’s a simple, three-step framework:

  1. Define Your Primary Business Objective: Get specific. Is it to grow overall revenue by 20% this year? Or maybe to break into a new market segment within six months? Write it down.
  2. Identify the Supporting Marketing Outcomes: What has to happen in marketing for that objective to become a reality? To hit that 20% revenue goal, you might need to "generate 500 new sales-qualified leads" or "increase customer retention by 10%."
  3. Select the Metrics That Measure Those Outcomes: Now, and only now, you pick your tools. To measure those 500 leads, you'll track Cost Per Lead (CPL) and Lead Conversion Rate. For retention, you'll watch Churn Rate and Repeat Purchase Rate.

This top-down approach forces every metric on your dashboard to justify its existence. No passengers allowed.

What Are Vanity Metrics and Should I Ignore Them?

Vanity metrics are the numbers that make you feel good but don't actually tell you much about the health of the business. Think social media likes, total page views, or your raw number of email subscribers. They look great in a presentation but often have a weak-to-nonexistent link to revenue.

But should you ignore them completely? Not necessarily.

While they should never be your main measure of success, they can act as useful early warning signals or indicators of top-of-funnel health. A sudden explosion in social media likes could be a sign of growing brand awareness—the very first step in your customer journey.

The trick is to know what they're good for and what they aren't.

Metric TypePurposeExampleWhat It Really Means
Vanity MetricSignals top-of-funnel activity or brand reach.10,000 new followers."More people are aware of our brand."
Actionable MetricMeasures progress toward a business goal.15% lift in conversion rate from social traffic."Our social strategy is now generating leads."

Use vanity metrics as a canary in the coal mine, but always connect them to the actionable metrics that prove you're making a real impact.


Ready to stop reacting and start predicting? marketbetter.ai uses an integrated AI approach to turn your marketing data into a powerful roadmap for the future. Our platform helps you automate budget allocation, predict which leads will convert, and generate high-performing content at scale. Discover how marketbetter.ai can elevate your marketing strategy today.