The $150K Problem: What Losing One SDR Actually Costs Your Business [2026 Data]

Here's a question most sales leaders never do the math on: What does it actually cost when an SDR walks out the door?
Not the recruiting fee. Not the salary savings during the vacancy. The total cost — including the pipeline that evaporates, the meetings that never happen, the remaining team members who pick up the slack and burn out faster, and the 3-5 months your replacement spends ramping before booking a single qualified meeting.
We built a complete cost model using 2025-2026 benchmark data from The Bridge Group, Xactly, SalesHive, and our own customer conversations. The number we landed on will make you rethink every hiring, retention, and technology decision you make this year.
The Raw Numbers
Let's start with the industry benchmarks that feed the model:
| Metric | Benchmark | Source |
|---|---|---|
| Average SDR tenure | 14-18 months | Bridge Group, SalesHive |
| Average SDR ramp time | 3.1-3.2 months | Bridge Group |
| SDRs who quit within 90 days | 20% | SalesSo Research |
| SDRs consistently missing quota | 83.4% | SalesSo Research |
| Average SDR OTE | $65K-$85K | Glassdoor, Martal |
| Meetings booked per month (avg) | 15 | Industry benchmark |
| Cost to ramp (total) | 3x base salary | Xactly |
| Companies with subpar onboarding | 88% | SalesSo Research |
| Show rate on booked meetings | 80% | Industry benchmark |
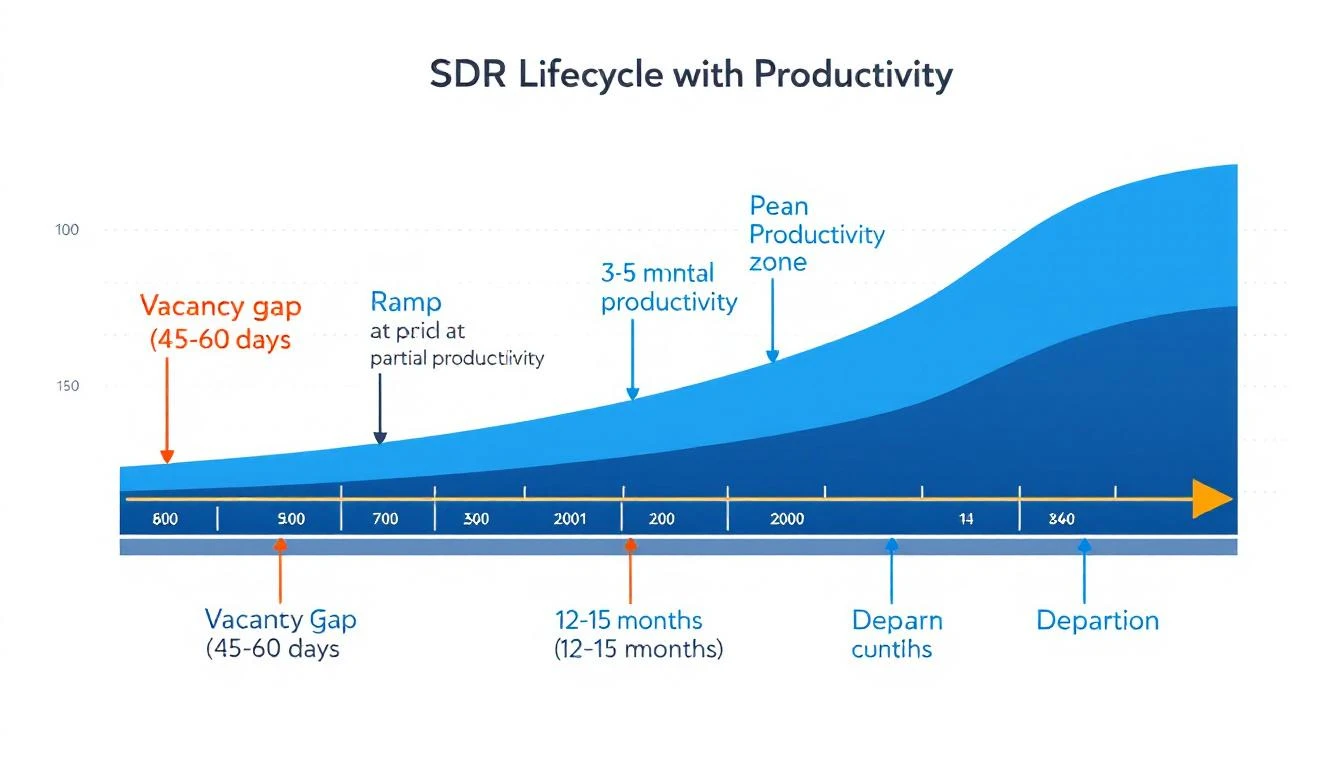
These numbers alone tell a story. Your average SDR stays 16 months, takes 3.2 months to ramp, and has only 12.8 months of full productivity before the cycle starts again.
But the financial impact is what should keep you up at night.
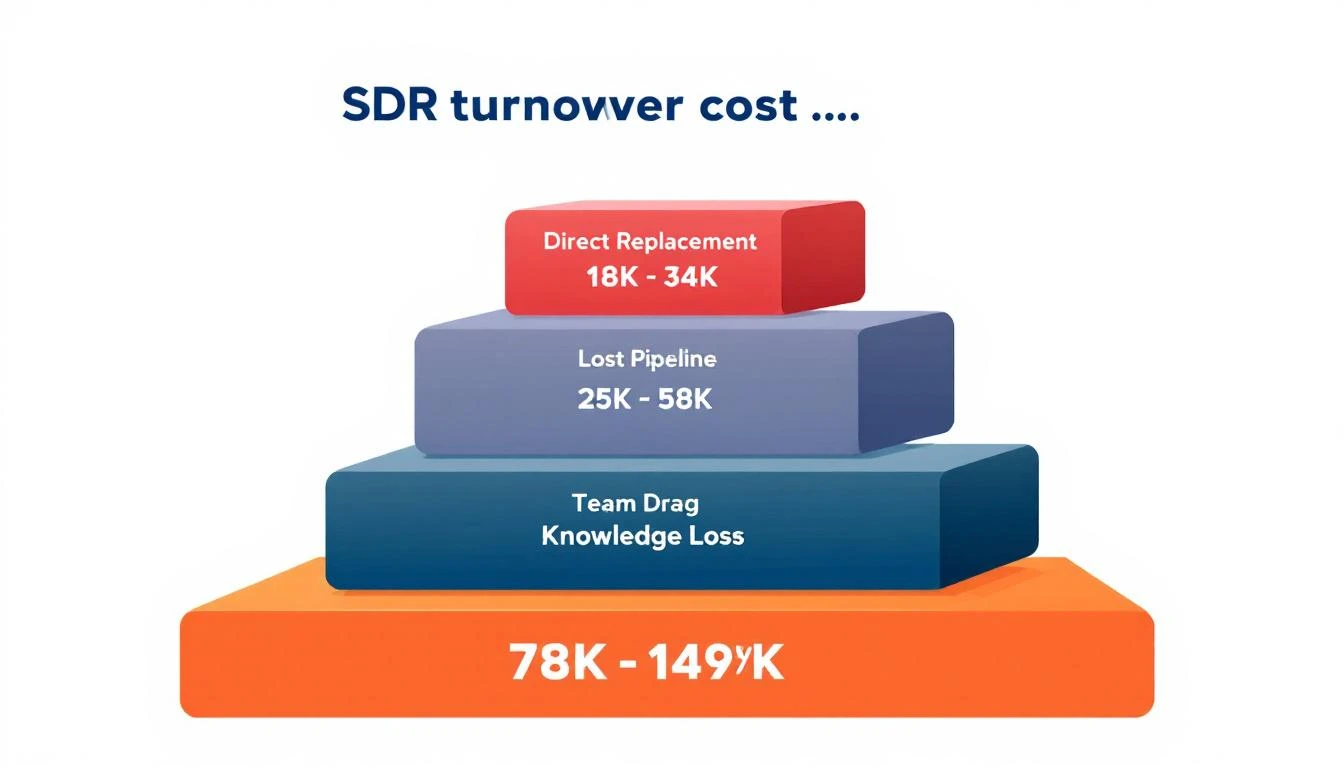
The Five Layers of Turnover Cost
Most leaders think about turnover cost as "recruiting fee + salary gap." That captures maybe 30% of the real number. Here are the five actual cost layers:
Layer 1: Direct Replacement Costs — $18,500-$32,000
| Cost Component | Low Estimate | High Estimate |
|---|---|---|
| Recruiting (agency or internal) | $8,000 | $15,000 |
| Job posting and sourcing | $500 | $2,000 |
| Interview time (managers + team) | $3,000 | $5,000 |
| Background check and onboarding admin | $500 | $1,000 |
| Training materials and programs | $2,500 | $4,000 |
| New hire tech stack setup | $1,000 | $2,000 |
| First-month salary (zero productivity) | $3,000 | $5,000 |
| Subtotal | $18,500 | $34,000 |
Agency recruiting fees for SDR roles typically run 15-20% of first-year OTE. Internal recruiting isn't free either — when you factor in recruiter salary, hiring manager time, and team interviews, it costs $8K-$12K per hire.
Layer 2: Lost Pipeline During Vacancy — $25,000-$50,000
This is the cost nobody calculates. When an SDR seat is empty:
- Average vacancy length: 45-60 days (time to hire after notice)
- Meetings not booked: 22-30 meetings (15/month x 1.5-2 months)
- Pipeline value per meeting: $1,100-$1,700 (based on $22K avg ACV at 5% close rate)
- Total lost pipeline: $24,200-$51,000
That's not revenue you "don't get." It's pipeline your competitors win because your territory is uncovered. These deals don't wait for you to backfill the role.
And here's the compounding effect: those 22-30 meetings would have generated second and third touches, referrals, and warm follow-ups over the following months. The downstream impact is 2-3x the immediate pipeline loss.
Layer 3: Ramp Period Productivity Loss — $22,000-$38,000
Your new hire isn't at zero for 3 months, then magically at 100%. The productivity curve looks like this:
| Month | Expected Productivity | Meetings vs. Target |
|---|---|---|
| Month 1 | 10-15% | 1-2 meetings |
| Month 2 | 30-40% | 4-6 meetings |
| Month 3 | 60-70% | 9-10 meetings |
| Month 4 | 80-85% | 12-13 meetings |
| Month 5+ | 90-100% | 13-15 meetings |
Over the first three months, your new SDR books roughly 15-18 meetings instead of the 45 a fully ramped rep would deliver. That's 27-30 missed meetings, worth $29,700-$51,000 in pipeline.
But you're paying full salary during this period: $16,250-$21,250 for three months of sub-target performance. Some of that salary investment is recovered through the meetings they do book, netting a real cost of $22,000-$38,000.
Layer 4: Team Drag — $8,000-$15,000
When an SDR leaves, the remaining team absorbs the impact in three ways:
Manager time drain: Your sales manager spends 15-20 hours on exit logistics, coverage planning, interviewing candidates, and onboarding the replacement. At a $120K manager salary, that's $900-$1,200 in diverted management time.
Buddy system tax: The senior SDR assigned to train the new hire loses 10-15% productivity for 6-8 weeks. That's 6-9 missed meetings worth $6,600-$15,300 in pipeline.
Morale ripple: This is the hardest to quantify, but Bridge Group data shows teams that experience turnover see a 5-8% productivity dip across remaining team members for 4-6 weeks. For a 5-person team losing one rep, that's 8-15 missed meetings across the remaining four.
Layer 5: Institutional Knowledge Loss — $5,000-$12,000
When an SDR leaves, they take with them:
- Prospect relationships — warm conversations that go cold
- Territory intelligence — which accounts respond to what messaging
- Tribal knowledge — workarounds, objection responses, competitive intel that lives in their head
- CRM data quality — notes go stale, follow-ups fall through cracks
Even with the best CRM hygiene, we estimate 30-40% of in-flight opportunities degrade or die when the owning rep leaves. For a rep managing 50-100 active prospects, that's 15-40 conversations that restart from scratch.
The Total: $115,000-$195,000 Per Departure
| Layer | Low | High |
|---|---|---|
| Direct replacement | $18,500 | $34,000 |
| Lost pipeline (vacancy) | $25,000 | $50,000 |
| Ramp productivity loss | $22,000 | $38,000 |
| Team drag | $8,000 | $15,000 |
| Knowledge loss | $5,000 | $12,000 |
| Total | $78,500 | $149,000 |
Wait — that's lower than $150K? Here's the part that pushes it over: the cycle repeats. With average tenure at 16 months, you're doing this calculation again before the replacement's second anniversary.
Annualized over a three-year window with two turnover events (which is statistically likely), the per-seat cost of turnover reaches $157,000-$298,000 — or $52K-$99K per year in perpetual replacement cost, layered on top of salary and tools.
For a 5-person SDR team with industry-average turnover, that's $260K-$500K per year in hidden turnover costs.
What Actually Reduces Turnover (It's Not Ping Pong Tables)
The data points to three levers that meaningfully reduce SDR attrition:
1. Faster Ramp = Longer Tenure
Companies with structured onboarding programs retain reps 82% longer than those without (SalesSo Research). That's not coincidence — reps who feel productive stay. Reps who flounder for 4-5 months finding their footing leave.
The fastest path to ramp? Give reps fewer decisions to make. A daily SDR playbook that tells them exactly who to contact, in what order, through which channel — that's not micromanagement, it's removing the activation energy that drains new reps.
Teams using AI tools ramp 30% faster and their reps are 3.7x more likely to hit quota (SalesSo Research). Not because AI does the work — because it reduces the cognitive load of figuring out what to do next.
2. Tool Consolidation = Less Burnout
SDRs using 5+ tools spend 30-40% of their day context switching between applications. That's not just wasted time — it's the #1 driver of frustration and burnout.
When we analyzed our customer data, teams that consolidated from 5+ point solutions to an integrated platform saw:
- 40% reduction in ramp time (less tools to learn)
- 25% increase in daily activity volume (less time switching)
- Measurably higher rep satisfaction in quarterly surveys
You can build a full SDR stack for $3,600/rep/year with an all-in-one platform. Compare that to the $6,000-$27,000/rep sprawl stacks we see — and factor in that sprawl drives the burnout that causes turnover.
3. Signal-Based Outreach = Better Win Rates = Happier Reps
83.4% of SDRs miss quota. That's not a training problem — it's a targeting problem. Reps cold-calling into the void burn out. Reps reaching out to companies showing active buying signals book meetings and feel successful.
The data is clear: SDRs using intent signals convert at 2-3x the rate of reps doing pure cold outreach. Higher conversion rates mean hitting quota, which means bonuses, which means retention.
The Bottom Line
SDR turnover isn't a "people problem" you solve with better culture. It's an operations problem with a clear financial model.
Every dollar you spend reducing ramp time, simplifying the tool stack, and improving signal quality pays back 5-10x in avoided turnover costs.
Here's the simple math:
- Reducing one departure per year across a 5-person team saves $115K-$195K
- That's $9,500-$16,250/month in budget you can reinvest in tools, training, or comp
- Or roughly 2-3 additional SDR seats worth of tooling budget
The companies that win in 2026 won't be the ones that hire faster. They'll be the ones whose reps don't leave.
MarketBetter cuts SDR ramp time by replacing 5-7 tools with one platform. Daily playbook, visitor ID, email sequences, smart dialer, and AI chatbot — all in one tab. Your new hire's first day is productive, not overwhelming. See how it works →
Methodology: Cost estimates based on published benchmarks from The Bridge Group (2024-2025), Xactly sales compensation data, SalesSo/SalesHive research reports, Glassdoor salary data, and aggregated customer data from MarketBetter users. Pipeline value calculations assume mid-market B2B (50-500 employees, $10K-$50K ACV). Individual results will vary based on market, role level, and geography.