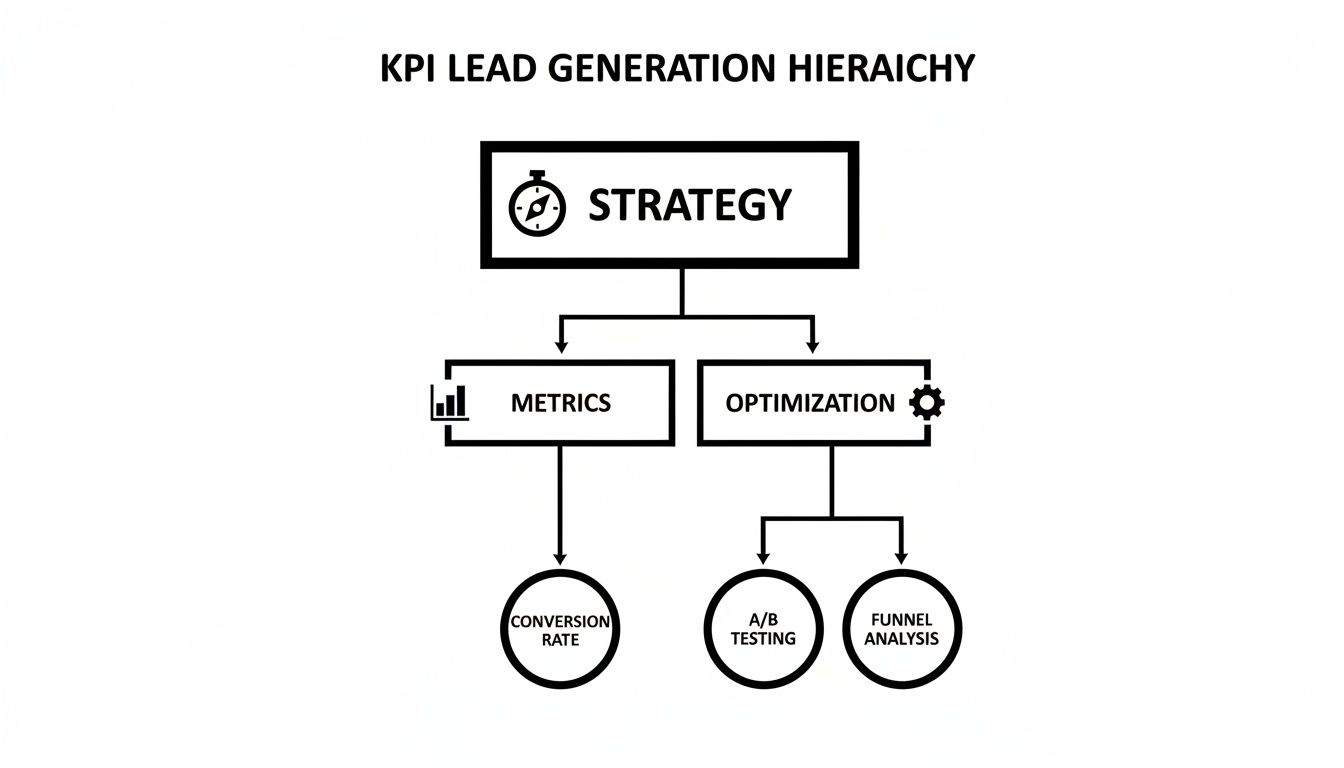
Top 10 KPIs for Lead Generation to Master in 2026
In B2B sales, the pressure to generate more leads is relentless. But focusing solely on volume is like celebrating a quarterback who only throws short passes; the stats look busy, but you never score. The real game-changer isn't just generating more leads; it's about creating better pipeline, faster and more efficiently. This requires a shift from vanity metrics to actionable insights that directly connect outbound efforts to revenue. So, what should you be measuring? The answer lies in a balanced scorecard of kpis for lead generation that track cost, speed, quality, and ultimately, business impact.
This guide breaks down the 10 essential KPIs that every Sales Development Representative (SDR), demand generation manager, and VP of Sales needs to master. We'll go beyond simple definitions, providing the specific formulas, industry benchmarks, and actionable steps required to turn raw data into a predictable revenue engine. Each metric is a lever you can pull to refine your process, improve team performance, and make smarter, data-driven decisions.
You'll learn not just what to measure but how to act on those measurements. We’ll compare metrics like Lead Response Time against Meeting Booking Rate to show how one directly influences the other, giving you a holistic view of your outbound funnel. To truly optimize this funnel, it's also crucial to understand the broader landscape of effective and modern top lead generation strategies. By combining the right KPIs with proven tactics, you can build a system that doesn't just fill the pipeline but fills it with opportunities that close.
1. Cost Per Lead (CPL)
Cost Per Lead (CPL) is one of the most fundamental KPIs for lead generation, measuring the total cost-effectiveness of your marketing and sales development efforts. It calculates the average expense incurred to generate a single new lead for your sales pipeline. Understanding this figure is critical for budget allocation, campaign optimization, and proving the ROI of your activities.
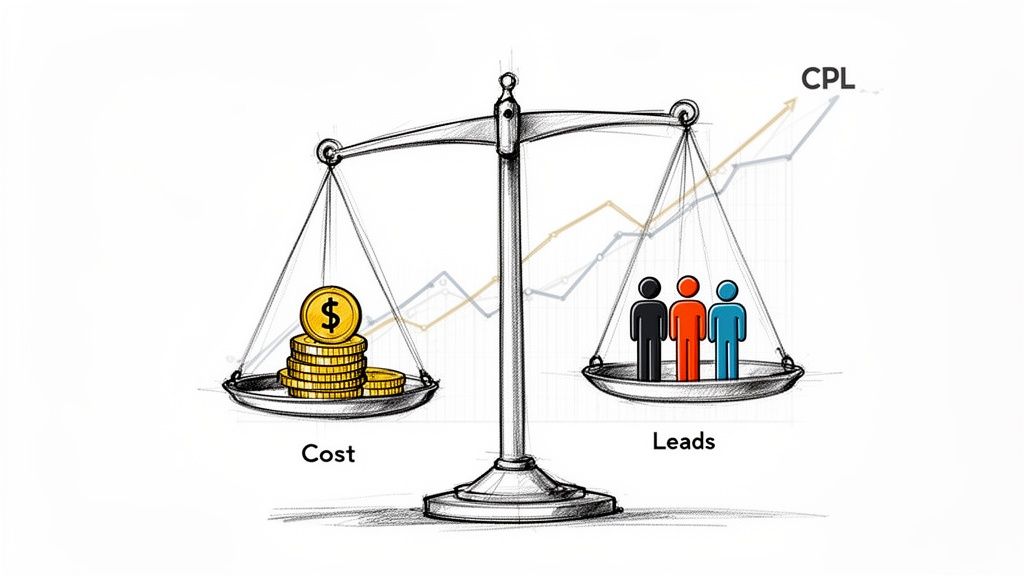
This metric directly ties your financial investment to tangible outcomes, answering the simple but vital question: "How much are we paying for each lead?"
How to Calculate and Use CPL
The formula is straightforward, but its components require careful tracking. To accurately calculate CPL and understand the effectiveness of your lead sources, it's crucial to implement essential UTM parameter best practices for flawless tracking.
-
Formula:
CPL = Total Marketing & Sales Spend / Total New Leads Generated -
What to Include: Your "Total Spend" should encompass ad spend, content creation costs, tool subscriptions (like your SDR platform and dialer), and a portion of salaries for the teams involved.
Comparison in Action: A B2B SaaS company finds their outbound SDR team has a CPL of $55. In contrast, their paid advertising CPL is $95. This direct comparison makes the next step actionable: confidently shift more budget toward hiring and enabling SDRs, as it's a 40% more efficient channel for generating leads.
Actionable Tips for CPL Optimization
Merely knowing your CPL isn't enough; you must act on it. Use these strategies to gain deeper insights and improve your lead generation efficiency.
- Actionable Step: Don't rely on a blended, company-wide CPL. Break it down by channel (outbound, paid social, SEO), campaign, or even target persona. This reveals which specific initiatives deliver the most value and which are draining resources.
- Actionable Step: Monitor your CPL on a monthly or quarterly basis. A sudden spike could signal an underperforming campaign, a broken tool, or a need for sales rep training. A steady decrease validates your optimization efforts.
- Actionable Step: A low CPL is useless if the leads don't convert. Always analyze CPL alongside Lead-to-Opportunity Rate. For example, a channel with a $50 CPL that converts 2% of leads to opportunities is less valuable than a channel with a $100 CPL that converts 10% of its leads.
2. Lead Response Time (LRT)
Lead Response Time (LRT) measures the speed at which a sales development representative (SDR) contacts a new lead after it enters your system or shows a high-intent buyer signal. In today's competitive landscape, speed is non-negotiable; research consistently shows that contacting a lead within the first five minutes dramatically increases the odds of qualification and conversion.
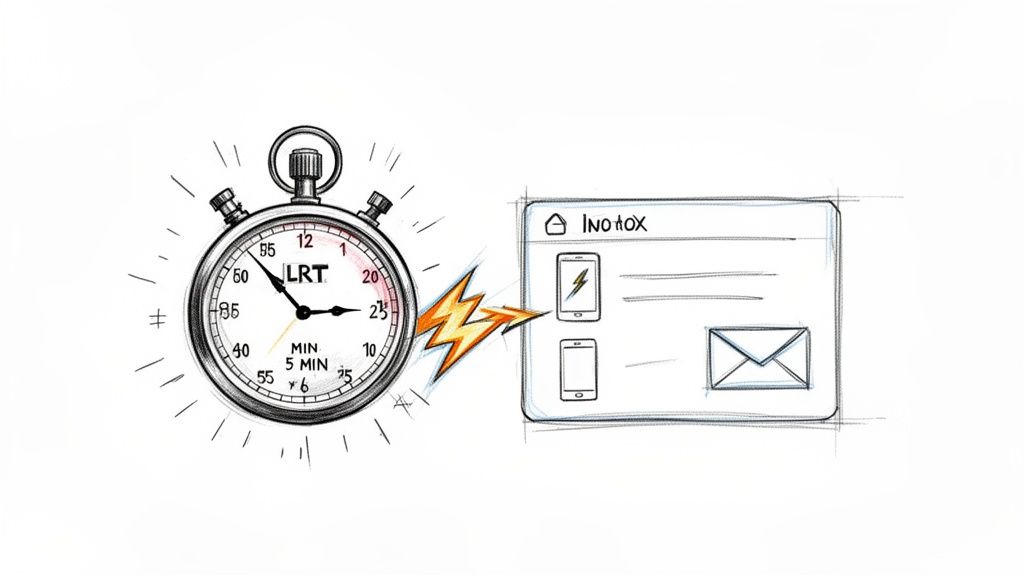
This metric directly correlates sales activity to lead intent, answering the critical question: "Are we engaging prospects while their interest is at its peak?" Tracking LRT is essential among all KPIs for lead generation because it highlights process efficiency and directly impacts pipeline velocity.
How to Calculate and Use LRT
Calculating LRT is simple, but it requires diligent logging of all inbound lead timestamps and first contact attempts. The goal is to minimize the time between these two events.
-
Formula:
LRT = Timestamp of First Contact Attempt - Timestamp of Lead Creation/Intent Signal -
What to Include: "Timestamp of Lead Creation" could be a form submission, a demo request, or an intent data signal. "First Contact Attempt" should be a logged call, email, or social touchpoint.
Comparison in Action: Team A uses a manual process and achieves an LRT of 2-3 hours. Team B uses an automated task inbox and achieves an average LRT of 8 minutes. This speed advantage alone can boost Team B's conversion rates by over 35%, showcasing a clear, actionable ROI on process optimization and automation.
Actionable Tips for LRT Optimization
A low LRT is a competitive advantage. Use these strategies to shorten your response window and capitalize on peak buyer interest.
- Actionable Step: Set tiered targets based on lead intent. For high-intent signals like demo requests, aim for an LRT under 5 minutes. For lower-intent leads like content downloads, a target of 24 hours is more practical.
- Actionable Step: Implement an automated escalation workflow. If an assigned rep doesn't meet the LRT target within a set period (e.g., 15 minutes for a high-intent lead), automatically re-route the lead to an available team member or a manager to ensure prompt follow-up.
- Actionable Step: Use tools that automatically create and prioritize tasks for reps based on lead source and intent. This eliminates manual sorting and reduces the context-switching that causes delays, allowing reps to focus purely on outreach.
3. Lead Quality Score (LQS)
Lead Quality Score (LQS) moves beyond lead volume to prioritize lead value. It's a composite ranking, typically on a 0–100 scale, that predicts a lead's likelihood to convert into a customer. By combining firmographic fit, behavioral signals, and intent data, LQS helps sales development teams focus their energy on the accounts with the highest potential, dramatically improving efficiency and conversion rates.
This metric answers the crucial question: "Which leads should our team work on right now for the best results?" It ensures your most expensive resources, your sales reps, are always working on the most valuable opportunities.
How to Calculate and Use LQS
Unlike simpler KPIs for lead generation, LQS is a weighted composite score rather than a direct formula. You assign points based on various attributes that correlate with successful deals. To master the nuances, you can explore detailed lead scoring best practices to implement today.
-
Formula:
LQS = (Weight₁ × Attribute₁) + (Weight₂ × Attribute₂) + ... -
What to Include: Your attributes should be a mix of:
- Firmographic: Company size, industry, revenue, tech stack (e.g., uses Salesforce).
- Behavioral: Website activity (visited pricing page), email engagement (opened 3+ emails), content downloads.
- Intent: Job changes, recent funding announcements, 3rd-party product searches.
Comparison in Action: Company A routes all leads round-robin. Company B uses an LQS model, automatically routing leads scoring over 80 to senior reps. As a result, Company B sees a 25% higher conversion rate on its top-tier accounts because experienced reps engage them immediately, a direct, actionable outcome of implementing LQS.
Actionable Tips for LQS Optimization
A static LQS model will quickly become obsolete. Use these strategies to build a dynamic, effective scoring system that drives real revenue.
- Actionable Step: Start with 3-4 high-impact signals like company size, industry, and a key behavioral trigger (e.g., demo request). Add more complex variables only after you can prove a strong correlation between your initial signals and closed-won deals.
- Actionable Step: Validate your model quarterly. Analyze your closed-won deals against their initial LQS. If low-scoring leads are consistently converting, your model is broken. Use this data to recalibrate your attribute weights.
- Actionable Step: For reps to trust the system, they need to understand the logic. Create a one-page document explaining what constitutes a "high-quality lead" and share it. This builds buy-in and encourages them to prioritize tasks based on the LQS.
4. Conversations Started / Connect Rate
While tracking outreach volume (dials, emails) is easy, it’s a vanity metric. The Conversations Started or Connect Rate KPI measures the actual effectiveness of that outreach, revealing what percentage of attempts result in a meaningful interaction with a prospect. This metric moves beyond activity to gauge true engagement, separating busy work from productive pipeline building.
This KPI is a direct indicator of your SDR team's ability to break through the noise and capture a prospect's attention, answering the critical question: "Is our outreach actually landing?"
How to Calculate and Use Connect Rate
Tracking this KPI requires diligence in your CRM and sales engagement platform. A "conversation" can be defined as a phone call where you speak to the intended prospect for a minimum duration (e.g., over 90 seconds) or a substantive email reply that isn't an out-of-office message.
-
Formula:
Connect Rate = (Total Conversations Started / Total Outreach Attempts) * 100 -
What to Include: "Total Outreach Attempts" includes all dials made and unique emails sent. "Total Conversations Started" includes all live phone conversations and meaningful email replies.
Comparison in Action: An SDR team using generic email templates has a reply rate of 1.2%. After switching to AI-written emails grounded in account-specific context, their reply rate jumps to 2.8%. This seemingly small lift more than doubles the number of conversations started from the same email volume, creating a massive downstream impact on meetings booked and pipeline generated.
Actionable Tips for Connect Rate Optimization
Improving your connect rate is one of the highest-leverage activities for any sales development team. A higher connect rate means more at-bats for your reps without increasing their workload.
- Actionable Step: Analyze connect rates by lead source and list quality. If one rep's connect rate is low, check if they were assigned a poor-quality list before assuming it's a performance issue. This prevents misattributing problems to the rep instead of the data.
- Actionable Step: Track connect rates by time of day and day of the week. If you find that calling prospects between 4-5 PM on a Tuesday yields a 30% higher connect rate, immediately block out this time on your team's calendar for focused call blitzes.
- Actionable Step: Coach reps that a higher connect rate comes from relevance, not volume. Implement a 3-minute pre-call planning checklist for top accounts, including finding one recent company news item and one personal detail from LinkedIn.
5. Pipeline Generated / Pipeline Contribution
While metrics like appointment setting measure activity, Pipeline Generated quantifies the direct revenue impact of your lead generation efforts. It measures the total dollar value of qualified sales opportunities created from a specific channel, such as your SDR team, during a given period. This is one of the most critical KPIs for lead generation because it bridges the gap between marketing or sales development activity and tangible financial outcomes.
This KPI answers the ultimate question from your CFO and board: "How is this team's work contributing to our revenue goals?" Pipeline Contribution takes this a step further by showing the percentage of the total company pipeline created by a specific team, clarifying its strategic importance.
How to Calculate and Use Pipeline Generated
Calculating this metric requires disciplined CRM hygiene and a clear, universally understood definition of what constitutes a "qualified" opportunity.
-
Formula:
Pipeline Generated = Sum ($) of All Qualified Opportunities Created in a Period -
Formula (Contribution):
Pipeline Contribution % = (SDR-Generated Pipeline / Total Company Pipeline) * 100 -
What to Include: Your "Qualified Opportunities" should be tied to a specific sales stage, like "Stage 2: Discovery" or "SAL (Sales Accepted Lead)." This ensures you aren't counting unqualified leads and inflating your numbers.
Comparison in Action: A company's SDR team of 8 generates $2.4M in qualified pipeline in a quarter. The total company pipeline for that quarter was $5.3M. This comparison yields a Pipeline Contribution of 45%, providing an actionable data point to justify further investment in headcount and tools for the outbound team.
Actionable Tips for Pipeline Optimization
Tracking pipeline is just the start; using it to drive strategy is what matters. These tips help you turn data into decisions.
- Actionable Step: Create a written, standardized definition of "pipeline" and ensure it's used across sales and marketing. A common definition is a qualified opportunity that has passed a specific sales stage (e.g., Discovery Confirmed). This prevents ambiguity and ensures data integrity.
- Actionable Step: Make the 'Opportunity Source' field mandatory in your CRM to clearly distinguish SDR-sourced deals from inbound, partner, or other channels. This is fundamental for accurate contribution reporting.
- Actionable Step: Don't just report on pipeline generated; compare it to the pipeline that eventually closes. A team creating high pipeline value that rarely converts needs better qualification training, not just a pat on the back for volume.
6. SDR Activity Metrics (Dials, Emails, Tasks Completed)
SDR Activity Metrics are foundational, top-of-the-funnel KPIs for lead generation that measure the raw output of your sales development team. These metrics track the volume of outreach activities, including the number of dials made, emails sent, and tasks completed per representative over a specific period. While they don't measure quality on their own, they are crucial leading indicators of effort, productivity, and pipeline health.
This set of metrics provides a clear, quantifiable view of your team's day-to-day work, answering the critical question: "Is my team putting in the necessary effort to hit their targets?"
How to Calculate and Use SDR Activity Metrics
Tracking these metrics is about diligent logging, often automated by modern sales engagement platforms. Accurate activity tracking is essential for diagnosing performance issues and understanding team capacity.
-
Formula: These are typically direct counts, not formulas.
Total Dials,Total Emails Sent, andTotal Tasks Completedare summed up per rep, per day, week, or month. -
What to Include: Your tracking should capture every meaningful outreach attempt. Tools like MarketBetter can automatically log these activities directly into your CRM, which eliminates manual data entry and increases tracked activity by 30-40% compared to manual systems where reps often forget to log tasks.
Comparison in Action: A top-performing SDR averages 45 dials and books 12 meetings weekly. A struggling rep averages 25 dials and books 2 meetings. This direct comparison provides an actionable coaching opportunity. By analyzing the data, the manager can help the struggling rep increase their activity to 40 dials and book 8 meetings within three weeks.
Actionable Tips for SDR Activity Metrics Optimization
Simply demanding more activity is a recipe for burnout. The goal is to drive effective activity that generates results. Use these strategies to refine your approach.
- Actionable Step: Set realistic, tiered targets based on experience. A new SDR might target 30 dials per day while they learn, whereas a tenured rep could aim for 50. Base these targets on historical data of activity-to-meeting conversion rates.
- Actionable Step: Correlate activity with outcomes by creating ratio metrics like
Dials to Conversation RateandEmails to Reply Rate. This helps you and your reps identify which activities are productive versus just busy work. - Actionable Step: Audit what percentage of assigned tasks your reps are completing. A figure below 80% is an early warning sign of a disengaged rep or an unmanageable workload. You can learn more about how this impacts your overall small business growth strategies.
7. Meeting Booking Rate / Qualified Meeting Rate (QMR)
The Meeting Booking Rate is a crucial outbound KPI, but it's often a vanity metric on its own. It simply tracks what percentage of outreach attempts result in a scheduled meeting. A far more powerful metric is the Qualified Meeting Rate (QMR), which measures meetings booked specifically with qualified decision-makers who have a genuine potential to buy.
This KPI separates raw activity from meaningful progress, answering the critical question: "Are our meetings leading to real sales conversations or just dead-end calls?" Focusing on QMR ensures your sales development team is setting up account executives for success, not just filling their calendars.
How to Calculate and Use QMR
Calculating QMR requires a clear, internally agreed-upon definition of what makes a meeting "qualified." This clarity is essential for accurate tracking and team alignment.
-
Formula:
QMR = (Number of Qualified Meetings Booked / Total Meetings Booked) x 100 -
What to Include: A "Qualified Meeting" must meet specific criteria, such as the prospect's title (e.g., Director level or above), their involvement in the buying process, and initial confirmation of budget, authority, need, and timeline (BANT).
Comparison in Action: An SDR team books 100 meetings in a month (Meeting Booking Rate). However, after review, only 65 of those meetings are with actual decision-makers who fit the ideal customer profile. This results in a QMR of 65%. The comparison between the raw number (100) and the qualified number (65) gives a much more accurate, actionable picture of pipeline health.
Actionable Tips for QMR Optimization
Improving your QMR directly enhances sales efficiency and accelerates the sales cycle. Use these strategies to ensure your team is booking conversations that matter.
- Actionable Step: Create and publish a one-page "Definition of a Qualified Meeting." Specify which titles count, what discovery information must be gathered, and the criteria for a legitimate sales opportunity. This document becomes your SDR team's source of truth.
- Actionable Step: Train SDRs to probe for budget, timeline, and authority during the initial booking conversation, not just to get a "yes" for a meeting. Role-play these specific qualification questions in team meetings.
- Actionable Step: Always analyze QMR alongside the Meeting-to-Opportunity conversion rate. A rep with a high QMR but low conversion rate may be misinterpreting qualifying signals, providing a clear coaching moment.
8. Sales Cycle Length / Time to Closed-Won
Sales Cycle Length measures the average time it takes for a lead to become a paying customer, typically from the first meaningful contact to a closed-won deal. This lagging indicator is crucial among KPIs for lead generation because it reveals the velocity of your entire go-to-market motion and the efficiency of the handoff from lead generation to sales execution.
This metric directly answers the question: "How quickly are the leads we generate turning into actual revenue?" A shorter cycle often indicates higher quality leads, better sales qualification, and a smoother internal process.
How to Calculate and Use Sales Cycle Length
The formula is a simple average, but the start and end points must be defined consistently. Tracking this requires tight integration between your CRM and marketing automation platforms.
-
Formula:
Sales Cycle Length = (Sum of Days from First Contact to Close for all Deals) / Total Number of Closed-Won Deals -
What to Include: Your "First Contact" could be an SDR's first email, a demo request, or a content download. "Close" is the date the contract is signed. Consistency is key to meaningful analysis.
Comparison in Action: A company notices that leads sourced by SDRs targeting high-fit accounts close in an average of 45 days. In contrast, leads from broader, low-fit inbound segments take 120 days. This actionable data empowers RevOps to prioritize SDR focus on the accounts that convert faster and more efficiently.
Actionable Tips for Sales Cycle Length Optimization
A long sales cycle can drain resources and delay revenue. Use these strategies to analyze and shorten the time it takes to win a deal.
- Actionable Step: Segment your sales cycle length reporting by deal size, product line, and lead source. Never blend a $10K SMB deal with a $250K enterprise contract, as their cycles are fundamentally different.
- Actionable Step: Track two timelines: 'first contact to close' and 'meeting booked to close'. A large gap between these figures indicates a weak point in the initial SDR qualification process, giving you a specific area to focus your coaching.
- Actionable Step: Correlate cycle length with Customer Lifetime Value (CLV). A long cycle isn't always bad if it results in a high-value, low-churn customer. This comparison prevents you from mistakenly "fixing" a long cycle that is actually profitable.
9. Lead-to-Customer Conversion Rate / Pipeline-to-Revenue Conversion
While top-of-funnel metrics are important, the Lead-to-Customer Conversion Rate is the ultimate indicator of lead quality and sales effectiveness. This KPI measures the percentage of leads that successfully navigate the entire sales funnel to become paying customers. It directly connects early-stage lead generation activities to bottom-line revenue, answering the crucial question: "Are our leads actually turning into business?"
This metric provides a holistic view of your funnel's health. A high rate indicates that marketing is attracting the right audience and sales is effectively closing deals, validating your entire go-to-market strategy. Conversely, a low rate signals a disconnect between the leads generated and the deals being won.
How to Calculate and Use Lead-to-Customer Conversion Rate
Calculating this KPI requires robust tracking from initial lead creation through to the final "closed-won" deal stage in your CRM.
-
Formula:
Lead-to-Customer Rate = (Total New Customers in a Period / Total New Leads in the Same Period) x 100 -
What to Include: Ensure "Total New Customers" only includes those originating from the specific lead cohort you are measuring. "Total New Leads" should be the gross number of new leads generated in that period.
Comparison in Action: A company's SDR-sourced leads convert at 3.2%, far surpassing the industry benchmark of 1.8% and their inbound content leads which convert at 1.5%. This 78% uplift provides a clear, actionable justification for investing more in the SDR team's tools and training.
Actionable Tips for Conversion Rate Optimization
Tracking this rate is the first step; improving it requires a granular, data-driven approach. Use these strategies to diagnose funnel leaks and drive more revenue.
- Actionable Step: Compare the conversion rates of different lead sources. If high-intent website demo requests convert at 10% while cold outbound lists convert at 0.5%, your action is clear: ensure every high-intent lead is handled with top priority. You can learn more about increasing your website conversions to boost this channel.
- Actionable Step: Isolate funnel stages by tracking micro-conversions like Lead-to-Opportunity and Opportunity-to-Close rates separately. This helps pinpoint whether the bottleneck is in SDR qualification or Account Executive closing execution.
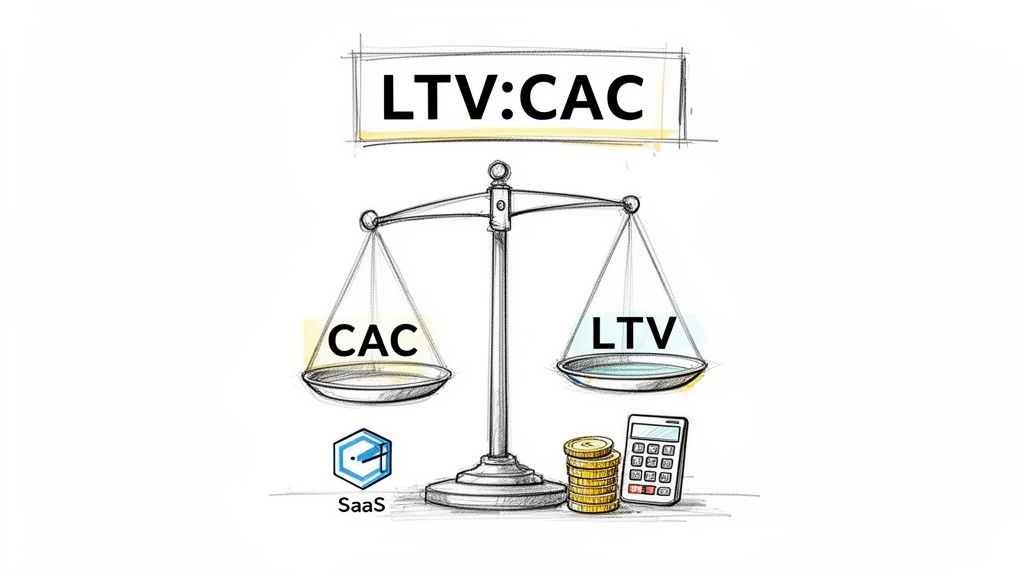
- Actionable Step: Analyze conversion rates alongside Customer Acquisition Cost (CAC) and Lifetime Value (LTV). A high conversion rate is only good if it's profitable. This comparison ensures you make sound business decisions, not just chase high percentages.
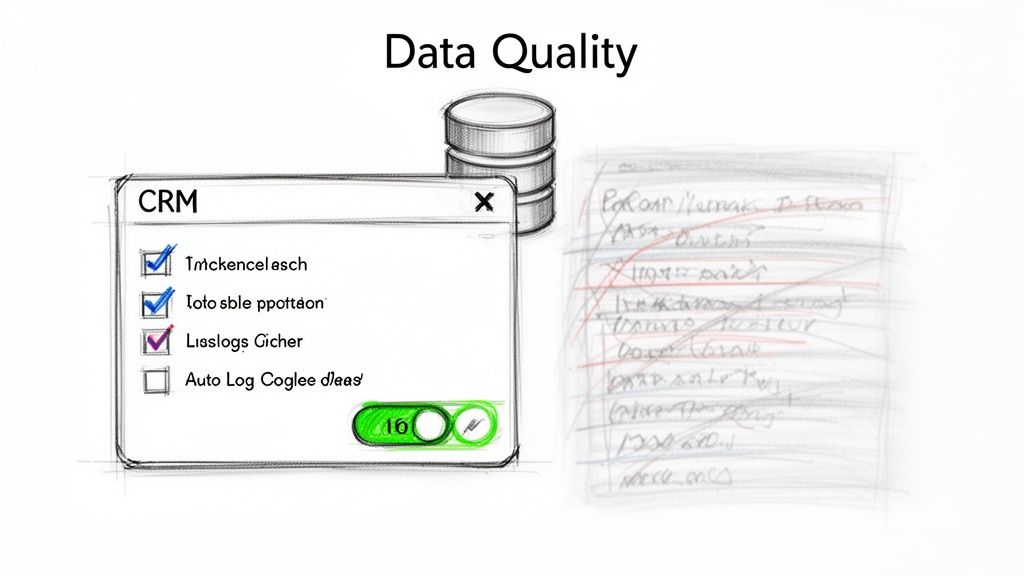
10. CRM Data Quality / Activity Logging Compliance
While not a traditional output metric, CRM Data Quality is a foundational KPI for lead generation that underpins the accuracy of every other metric you track. It measures how consistently and accurately your sales development team logs outreach activities, outcomes, and contextual notes in your CRM. Without clean, reliable data, your reporting becomes guesswork, making it impossible to diagnose problems or prove ROI.
This process-oriented KPI answers a critical question: "Can we trust the data we're using to make strategic decisions?" High compliance enables accurate forecasting, effective coaching, and a seamless handoff from SDRs to Account Executives.
How to Calculate and Use CRM Data Quality
This KPI is often measured through audits rather than a single formula. The goal is to track the percentage of activities that are logged correctly against the total number of activities that occurred.
-
Formula:
Compliance % = (Number of Correctly Logged Activities / Total Activities Audited) * 100 -
What to Include: Your audit should check for the logging of calls, emails, social touches, and meetings. "Correctly logged" means the activity is recorded, assigned the right outcome (e.g., "Connected," "Voicemail Left"), and includes sufficient context in the notes.
Comparison in Action: A team relying on manual logging has a compliance rate of 60%. After implementing an auto-logging tool, the rate jumps to 95%. This newfound data integrity reveals that one SDR has a "Not Interested" disposition rate of 60% on connected calls, compared to a team average of 20%, instantly flagging a clear and actionable coaching opportunity.
Actionable Tips for CRM Data Quality Optimization
Improving data quality requires a mix of technology, process, and culture. Use these strategies to build a reliable data foundation.
- Actionable Step: Automate everything possible with tools that auto-log calls, emails, and meetings. Manual data entry is the primary source of errors. Make auto-logging a non-negotiable part of your tech stack.
- Actionable Step: Create a required, standardized list of outcome codes for every activity (e.g., call outcomes: Connected, Voicemail, No Answer). Train the team on exactly when to use each one to ensure consistency.
- Actionable Step: Conduct weekly spot-audits. Randomly select 10-15 leads per SDR and verify that all activity is logged accurately. Track the pass/fail rate over time to measure improvement and identify reps who need more training.
Top 10 Lead Generation KPI Comparison
| Metric | 🔄 Implementation Complexity | ⚡ Resource Requirements | ⭐ Effectiveness / Expected Outcomes | 💡 Ideal Use Cases | 📊 Key Advantages |
|---|---|---|---|---|---|
| Cost Per Lead (CPL) | Medium — requires cost allocation across tools, salaries, overhead | Moderate — finance input, CRM tracking, MarketBetter integrations | ⭐⭐⭐ — clearer spend efficiency; can lower per-lead cost when automated | Budgeting, channel comparison (outbound vs inbound), tool ROI justification | Forces SDR ROI accountability; easy benchmarking; highlights efficiency gains |
| Lead Response Time (LRT) | Low–Medium — needs task automation & coverage policies | Low — task automation, dialer, notification workflows | ⭐⭐⭐⭐ — large conversion uplift when sub-5–10 minutes | High-intent signals, inbound leads, event follow-up, demos | Reduces lead decay; improves conversion probability and rep clarity |
| Lead Quality Score (LQS) | High — building and maintaining scoring model and weights | High — RevOps, clean data, third‑party intent sources, tuning | ⭐⭐⭐⭐ — prioritizes high-fit leads; improves conversion rates | Prioritizing SDR tasks, segment targeting, A/B testing routing | Focuses rep effort on best leads; aids coaching and dynamic prioritization |
| Conversations Started / Connect Rate | Low — metric easy to track; improvement needs training/tooling | Moderate — list quality, AI prep tools, call/email tooling | ⭐⭐⭐ — directly lifts pipeline if list and messaging are good | Rep coaching, messaging optimization, channel performance tests | Actionable for coaching; shows outreach relevance vs. raw volume |
| Pipeline Generated / Pipeline Contribution | Medium — needs clear attribution rules and CRM hygiene | High — strict opp tracking, integrations, RevOps processes | ⭐⭐⭐⭐ — directly ties SDR motion to revenue impact | Justifying SDR spend to leadership; measuring revenue contribution | Quantifies dollars created by SDRs; supports ROI and quota modeling |
| SDR Activity Metrics (Dials, Emails, Tasks) | Low — auto-logging simplifies capture | Moderate — dialer, task system, auto-log tools | ⭐⭐ — leading indicator of capacity, not quality | Capacity planning, early warning of disengagement, quota setting | Automatable; exposes engagement trends and enables fair benchmarking |
| Meeting Booking Rate / Qualified Meeting Rate (QMR) | Medium — requires qualification criteria and tracking | Moderate — training, call prep, calendar/booking tools | ⭐⭐⭐⭐ — predictive of pipeline quality when qualification is strict | Measuring SDR qualification skill; routing high-quality meetings to AEs | Distinguishes real buying conversations from gatekeeper activity |
| Sales Cycle Length / Time to Closed‑Won | Medium — calculation simple but influenced by many factors | Low–Moderate — CRM timestamps, segmentation, reporting | ⭐⭐⭐ — indicates efficiency and cash‑flow speed | Forecasting, segment analysis, diagnosing sales bottlenecks | Reveals bottlenecks; supports forecasting and segment strategy |
| Lead‑to‑Customer / Pipeline‑to‑Revenue Conversion | High — requires end‑to‑end attribution and long‑range data | High — revenue data, CRM discipline, cross-team alignment | ⭐⭐⭐⭐ — ultimate measure of lead quality and program ROI | Evaluating SDR program effectiveness, hiring, CAC/LTV analysis | Direct revenue linkage; validates targeting and tooling investments |
| CRM Data Quality / Activity Logging Compliance | Low–Medium — enforce policies; tooling reduces friction | Moderate — auto‑logging tools, audits, RevOps time | ⭐⭐⭐⭐ — critical for accurate metrics, forecasting, coaching | Forecasting accuracy, attribution, AE handoffs, coaching | Enables reliable reporting, faster handoffs, and accurate ROI measurement |
Try our AI Lead Generator — find verified LinkedIn leads for any company instantly. No signup required.
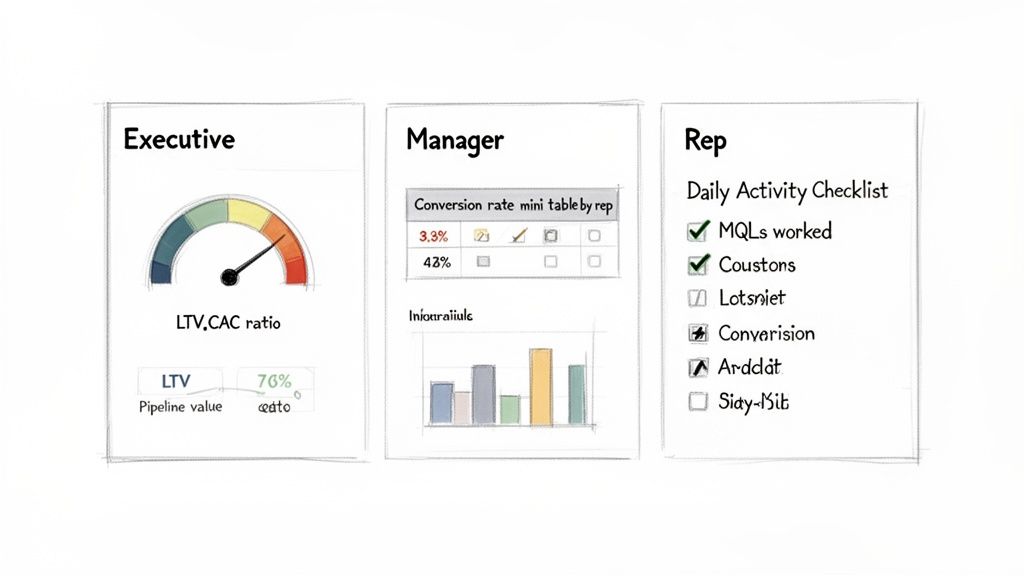
From Data Points to Decisions: Activating Your Lead Gen Insights
Navigating the complex world of B2B sales development requires more than just a list of contacts and a dialer. As we've detailed, mastering a specific set of KPIs for lead generation is the foundational step toward building a predictable revenue engine. From the high-level financial guardrail of Cost Per Lead (CPL) to the granular, on-the-ground reality of SDR Activity Metrics, each KPI tells a part of a larger story about your team's efficiency, effectiveness, and overall impact.
The journey, however, doesn't end with a well-organized dashboard. A dashboard merely diagnoses the symptoms; it doesn't prescribe the cure. The most successful sales organizations treat their KPIs not as historical reports but as real-time signals for immediate action. They have closed the gap between insight and execution, creating a culture of continuous, data-driven improvement.
Moving from Passive Reporting to Active Optimization
The true power of these metrics is unlocked when they are interconnected. A low Meeting Booking Rate isn't just a single problem to solve. It could be a symptom of a much deeper issue.
- Comparison 1: Is the root cause a poor Lead Quality Score (LQS)? Compare the meeting booking rate for high-LQS leads versus low-LQS leads. If there's a huge disparity, you need to revisit your ICP with marketing.
- Comparison 2: Is it a slow Lead Response Time (LRT)? Compare the booking rate for leads contacted in under 10 minutes versus those contacted after an hour. A significant drop-off means your routing and notification systems are broken.
- Comparison 3: Is it a low Conversations Started / Connect Rate? Compare the booking rates of reps with high vs. low connect rates. This isolates the problem to outreach effectiveness, pointing to a need for better scripts or call coaching.
Without this holistic, comparative view, you risk "solving" the wrong problem. You might run a training blitz on objection handling when the real issue is that marketing is sending you unqualified leads. The key is to treat your KPIs as a diagnostic toolkit, not just a report card.
Key Takeaway: Don't analyze KPIs in a vacuum. A decline in one metric is often a leading indicator for another. Map the relationships between your KPIs to find the true root cause of performance issues and avoid wasting resources on surface-level fixes.
Building a System for Action and Accountability
Once you've diagnosed the problem, the next step is swift, decisive action. This is where many teams falter. They see the data, discuss it in a meeting, and then... nothing changes. The chasm between knowing what to do and actually doing it can be vast.
To bridge this gap, your process needs to be systematic. This involves creating a direct feedback loop where data triggers a specific, pre-defined action plan.
- Identify the Trigger: A specific KPI falls below a set threshold (e.g., Lead-to-Customer Conversion Rate drops by 15% month-over-month).
- Launch a Diagnostic Sprint: Use connected KPIs to investigate why. Are deals stalling at a certain stage, indicating a low Pipeline Generated from a particular campaign? Is the Sales Cycle Length extending for a specific industry vertical?
- Implement a Targeted Intervention: Based on the diagnosis, deploy a specific solution. This could be a focused coaching session on discovery calls, an A/B test on email sequences, or a joint sales-marketing workshop to refine lead scoring criteria.
- Measure and Iterate: Monitor the initial KPI and related metrics closely to see if your intervention worked. Did the conversion rate recover? Did the sales cycle shorten? Use this new data to inform your next move.
Ultimately, mastering your KPIs for lead generation transforms your sales development function from an unpredictable art into a repeatable science. It empowers your leaders to make strategic decisions based on evidence, not intuition, and enables your SDRs and BDRs to focus their energy where it will have the greatest impact. This data-driven approach is no longer a luxury for elite teams; it is the essential blueprint for sustainable growth and market leadership.
Tired of manually connecting the dots between your CRM data and your team's daily actions? marketbetter.ai embeds an AI-powered execution layer directly into your workflow, automatically turning insights from your lead generation KPIs into prioritized tasks for your team. Stop just tracking metrics and start improving them by visiting marketbetter.ai to see how you can close the gap between data and revenue.