How to Conduct AB Testing: An Actionable Growth Guide
A/B testing isn't just a buzzword; it's a fundamental shift in how you make decisions. Forget guesswork. This is about comparing two versions of a single variable—Version A (the control) versus Version B (the variation)—to see which one actually gets you more clicks, sign-ups, or sales.
The process is straightforward and highly actionable: you start with a data-backed hypothesis, create a new version to test against the original, and then show each version to a random slice of your audience. The results provide concrete proof of what works, allowing you to implement changes with confidence.
Why A/B Testing Is Essential for Growth

Let’s be real. At its heart, A/B testing is your best defense against making choices based on ego or opinion. It single-handedly kills the "I think this blue button looks better" conversation.
Instead of debating preferences, you can compare the data. Imagine a scenario: one team member prefers a blue "Sign Up" button, another prefers green. An A/B test settles it. You run both versions and find that the green button drives 15% more sign-ups. That's not a small shift—it's the bedrock of sustainable growth and true data-driven decision making. Without it, you're just flying blind.
The Power of Incremental Improvements
Never underestimate the small wins. A minor tweak to a headline on a high-traffic landing page can have a massive ripple effect. Consider the comparison: a complete page redesign might take months and yield a 5% lift, while a simple headline test could take an hour and deliver a 2% lift in conversions. When applied to thousands of visitors, that small, fast win can easily translate into thousands of dollars in new revenue.
This is exactly why so many companies have woven testing into their DNA. Today, roughly 77% of companies are running A/B tests on their websites. Their primary targets? Landing pages (60%) and email campaigns (59%). The industry has clearly moved on from opinion-based marketing to data-backed optimization.
When you start treating every design change and marketing message as a testable hypothesis, you build a culture of continuous improvement. The learnings—from both wins and losses—become a powerful asset that fuels smarter decisions down the road.
A Roadmap for Successful Testing
To get real value from your tests, you need a repeatable system. Every successful experiment follows a structured path that ensures your results are reliable and your insights are actually useful. This guide is your map, designed to walk you through each critical phase and help you turn good ideas into measurable wins.
Before we dive in, here’s a high-level look at the key stages involved in any successful A/B test. Think of this as your cheat sheet for the entire process.
Key Stages of a Successful AB Test
| Phase | Objective | Key Action |
|---|---|---|
| 1. Identify Opportunities | Pinpoint high-impact areas for testing. | Use analytics and user behavior data to find leaks. |
| 2. Formulate a Hypothesis | Craft a clear, testable statement. | Define the change, the expected outcome, and why. |
| 3. Design & Execute | Build your variation and launch the test. | Use the right tools to create and run the experiment. |
| 4. Analyze & Act | Interpret the results and turn them into growth. | Determine the winner and implement the changes. |
This table lays out the fundamental workflow we're about to unpack. Getting these four stages right is the difference between random testing and strategic optimization that actually moves the needle.
Finding High-Impact Testing Opportunities

The best A/B tests aren’t born from brainstorming sessions about button colors. They start long before you even think about building a variation. The real wins come from finding a genuine, measurable problem to solve.
Your goal is to become a detective—to pinpoint the exact moments of friction in your user journey that are costing you money.
This diagnostic phase is non-negotiable. Throwing spaghetti at the wall to see what sticks is a slow, expensive way to learn. Compare these two approaches: randomly testing your homepage CTA versus finding a pricing page with an 80% exit rate and testing its layout. The latter is a targeted, data-informed approach that ensures every test you run has a real shot at moving the needle.
Digging for Data-Driven Clues
The first place to look is your analytics. User behavior leaves a trail of digital breadcrumbs, telling you exactly where your funnel is leaking.
Start by hunting for pages with unusually high drop-off rates. These are flashing red lights, signaling that something on the page is frustrating visitors or failing to meet their expectations. Once you have a problem page, you need to figure out why people are leaving.
- Heatmaps: These show you where users are clicking—and, more importantly, where they aren't. A heatmap might reveal that your primary call-to-action is practically invisible compared to a non-clickable graphic that gets all the attention.
- Session Recordings: Watching recordings of real users is like looking over their shoulders. You can see them rage-clicking a broken button or scrolling endlessly because they can’t find what they need.
Analytics tells you what is happening. Heatmaps and recordings help you understand why.
Prioritizing Your Test Ideas
You’ll probably end up with a long list of potential problems. Don't just start at the top. You have to prioritize. Not all opportunities are created equal.
Focus your energy on changes that will have the biggest potential impact on your bottom line.
A small copy change on your high-traffic checkout page will almost always deliver more value than a complete redesign of a low-traffic "About Us" page. Compare the potential: a 2% conversion lift on a page with 10,000 monthly visitors is far more valuable than a 10% lift on a page with 500 visitors. It’s also critical to look at your data through different lenses; what frustrates new visitors might not bother returning customers. Digging into various customer segmentation strategies will give you a much clearer picture.
A great test idea isn't about what you think will work; it's about what the data suggests is broken. Let your users' behavior guide your experimentation roadmap.
Crafting a Powerful Hypothesis
With a problem identified and prioritized, it’s time to build your hypothesis. This isn't just a guess. It’s a structured, testable statement that connects a change to an outcome, with a clear reason why. This is your test’s North Star.
Use this simple but powerful framework:
By changing [Independent Variable], we can improve [Desired Metric] because [Rationale].
Let's compare a weak hypothesis to a strong, actionable one.
- Bad Hypothesis: "Testing a new CTA will improve clicks." (This is too vague and doesn't explain anything.)
- Good Hypothesis: "By changing the CTA button text from 'Submit' to 'Get Your Free Quote,' we can improve form submissions because the new copy is more specific and value-oriented."
This structure forces you to link a specific action to a measurable result, all backed by clear logic. That clarity is what helps you learn from every single test—win or lose.
Choosing the Right AB Testing Tools
Picking the right software is one of those decisions that can quietly make or break your entire testing program. Seriously. The right tool becomes your command center for spinning up variations, launching tests, and digging into the results. Without it, you’re left wrestling with clunky manual processes that are slow, error-prone, and just plain frustrating.
The decision usually comes down to a trade-off: power, simplicity, and cost. If you’re a solo founder testing a headline on a landing page, your needs are worlds apart from an enterprise team optimizing a complex, multi-step user journey. The good news? There’s a tool for just about every scenario.
Let’s break down the main categories to help you find the perfect fit for your budget, team, and technical comfort level.
Integrated Platforms vs. Dedicated Tools
One of the first forks in the road is deciding between an all-in-one marketing platform and a specialized testing tool.
Integrated platforms, like HubSpot, bake A/B testing right into their larger suite of tools. This is a huge win for convenience. You can test an email campaign or a landing page in the exact same environment you used to build it. The learning curve is usually flatter, and you aren’t juggling yet another piece of software. The trade-off is that their testing features can be less robust, offering limited control over advanced targeting compared to dedicated solutions.
Dedicated tools, on the other hand, live and breathe experimentation. Think platforms like VWO or Optimizely. They are built from the ground up for one thing: running tests. This means you get immense power and flexibility—complex multi-page tests, sophisticated audience segmentation, and hardcore statistical analysis. Of course, all that specialization often comes with a higher price tag and a steeper learning curve.
You can see the difference just by looking at the dashboard. A dedicated tool like VWO gives you a much richer view of what’s happening.
This kind of dashboard gives you an immediate, at-a-glance view of how your variations are stacking up against the control, complete with conversion rates and confidence levels.
The Rise of AI-Powered Testing
There’s a new player on the field: AI-driven testing platforms. These tools go way beyond just comparing Version A to Version B. They use machine learning to suggest test ideas, automatically generate copy and design variations, and even predict which user segments will respond best to certain changes. This can slash your experimentation cycle time.
This isn't just a gimmick; it's a major trend. It’s predicted that by 2025, AI-driven testing will dramatically speed up experimentation by helping ideate variables and generate content. But let’s be real—the initial cost and the need for skilled analysts can be a hurdle, especially for smaller businesses.
If you're curious about how AI is reshaping the entire marketing toolkit, our guide on AI marketing automation tools is a great place to start.
The best tool for you is the one your team will actually use. A super-powerful platform that gathers digital dust is far less valuable than a simpler tool that’s wired into your daily workflow.
Your choice really hinges on where you are in your journey. Just starting out? An integrated solution might be the perfect entry point. As your testing program matures and your questions get more complex, a dedicated or AI-powered tool will likely become a smart investment.
Comparison of AB Testing Tool Types
To make the decision a bit clearer, I've put together a table that breaks down the different types of tools. Think of it as a cheat sheet for matching your needs to the right software category.
| Tool Type | Best For | Pros | Cons | Example Tools |
|---|---|---|---|---|
| Integrated Platforms | Beginners & teams wanting simplicity and an all-in-one solution. | Lower learning curve; convenient workflow; cost-effective if you already use the platform. | Limited testing features; less control over targeting; basic analytics. | HubSpot, Mailchimp, Unbounce |
| Dedicated Tools | Mature testing programs & teams needing advanced features. | Powerful analytics; advanced segmentation; flexible test types (MVT, server-side). | Higher cost; steeper learning curve; can require developer support. | VWO, Optimizely, AB Tasty |
| AI-Powered Tools | High-volume testing & teams looking to accelerate the ideation process. | Automated variation generation; predictive analytics; faster experimentation cycles. | Can be expensive; may feel like a "black box"; requires skilled analysts to interpret. | Evolv AI, Mutiny |
Ultimately, the goal is to find a tool that removes friction, not adds it. Whether you're a team of one or one hundred, the right platform will feel less like a taskmaster and more like a trusted lab partner, helping you find the answers you need to grow.
How to Run Your Test and Avoid Common Mistakes
Alright, you've pinpointed a high-impact opportunity and picked your tools. Now it's time to move from theory to practice. Actually launching your A/B test is where the rubber meets the road, but this stage is also littered with common pitfalls that can easily invalidate all your hard work.
Getting this right means setting up a clean, reliable experiment from the get-go.
One of the first big decisions is your sample size. This isn't a number you can just guess. It needs to be large enough to give you statistically significant results, meaning the outcome is genuinely due to your changes, not just random chance. Most testing tools have built-in calculators to help, but the principle is simple: higher-traffic sites can run tests faster, while lower-traffic sites need more time to gather enough data.
The obsession with data-driven marketing has made this process more critical than ever. The global A/B testing software market was valued at around $517.9 million in 2021 and is on track to blow past $3.8 billion by 2032. That explosive growth isn't just hype; it reflects a universal need for reliable, data-backed optimization.
Setting Your Test Duration
A classic mistake is running a test until it hits a certain number of conversions or a set number of days. Don't do it. Instead, you should aim to run your test for at least one full business cycle—typically one or two full weeks. This helps smooth out the natural peaks and valleys of user behavior.
Why is this so important? Compare these scenarios:
- Scenario A (Bad): Run a test for 3 days. It captures high-intent traffic from a weekday email blast, making the variation look like a huge winner.
- Scenario B (Good): Run a test for 7 days. It captures both the high-intent weekday traffic and the more casual weekend browsing traffic, giving you a truer, more balanced picture of performance.
Stopping a test the moment it hits 95% statistical significance is another tempting but dangerous shortcut. Early results can be incredibly misleading. Let the test run its planned course to ensure your data is stable and trustworthy.
Think of statistical significance as your confidence score. A 95% level means you can be 95% sure that the difference between your control and variation is real and not just a fluke. But this number needs time to stabilize.
Avoiding Cross-Contamination and Bias
Once your test is live, the single most important rule is this: don't peek at the results every day. Seriously. Constantly checking the numbers creates confirmation bias and a powerful temptation to end the test early if you see a result you like. This is one of the fastest ways to get a false positive.
The infographic below shows the different paths you can take when selecting tools, which is a foundational step you should have already sorted before running your test.
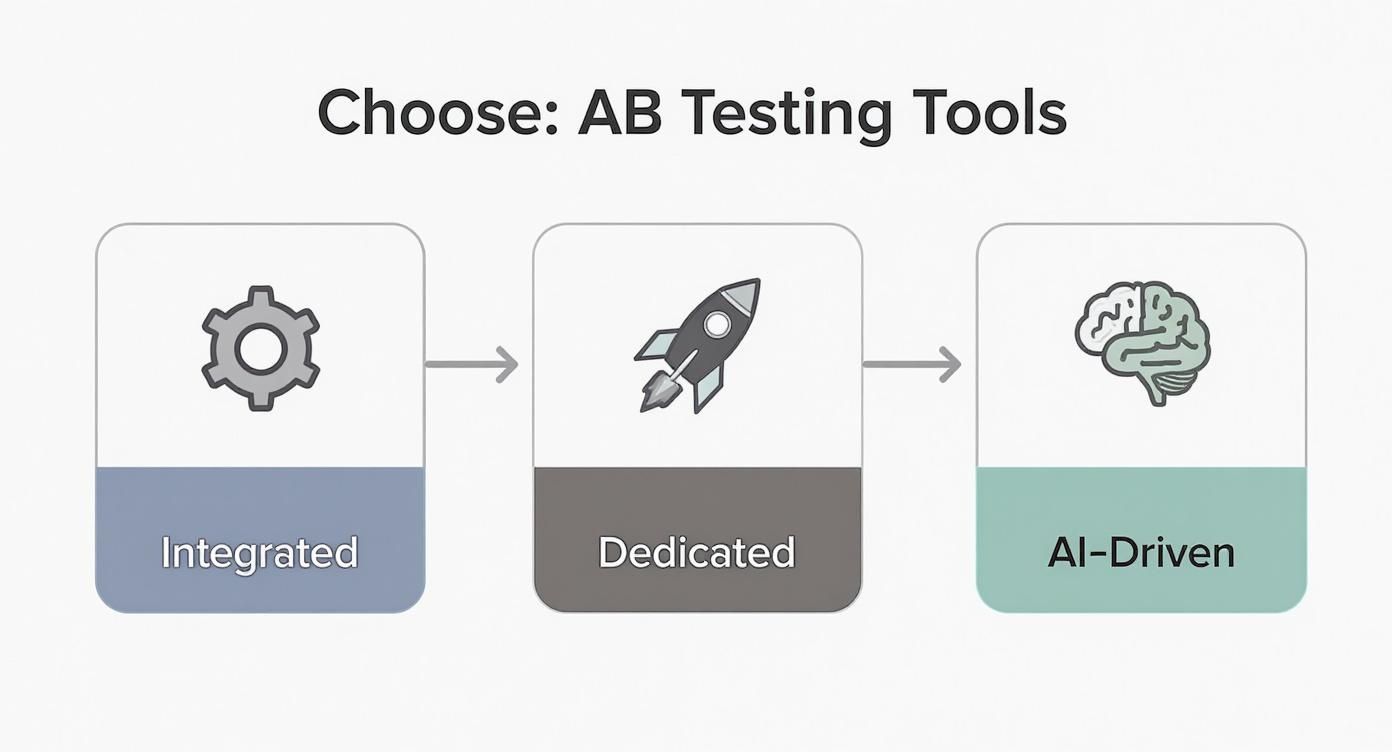
As you can see, your choice of tool—from a simple integrated solution to a complex AI-driven platform—directly impacts how you execute and monitor your experiment.
Finally, make sure your test is technically sound. Double-check that your variations render correctly across different browsers and devices. A broken element in your "B" version will obviously perform poorly, but it won't teach you anything useful about your hypothesis.
And once you master the basics, you can get more advanced. For instance, you might consider multivariate testing for video creatives to simultaneously optimize multiple elements and scale your results. But no matter the complexity, a clean setup is the foundation of a reliable conclusion.
Turning Test Results Into Actionable Insights
An A/B test is only as good as what you do after it’s over. Once the experiment wraps up and the data is in, the real work starts. This is where raw numbers become a strategic edge—the moment of truth for your hypothesis.
Sometimes, you get a clean win. The variation beats the control with statistical significance, and the path forward is clear: roll out the winner. When this happens, document the lift, share it with the team, and build momentum for the next round of testing.
But what happens when the results aren't so black and white?
Analyzing the 'Why' Behind the Numbers
Even with a clear winner, don't stop at the primary conversion metric. A test that bumps up sign-ups but also sends your bounce rate through the roof isn't a victory—it's a warning sign. To get the full story, you have to dig into the secondary metrics.
Look at the data that adds context and color to the main result.
- Time on Page: Did the winning version actually get people to stick around and engage more? Compare the average time on page for Version A and Version B.
- Bounce Rate: Did your brilliant change accidentally make more people hit the back button? If the bounce rate for Version B is significantly higher, you may have a problem.
- Average Order Value (AOV): For an e-commerce site, did the new design lead to bigger carts, even if the conversion rate stayed flat?
Looking at these secondary data points helps you understand the qualitative ripples your changes created. For a deeper dive on this, check out our guide on how to measure marketing effectiveness. This is what separates a basic testing process from a mature, high-impact optimization program.
When a Test Fails or Is Inconclusive
It's easy to write off a "failed" or flat test as a waste of time. That’s a huge mistake. A losing variation or an inconclusive result is one of the most valuable things you can get. It proves your hypothesis was wrong, which is just as important as proving it was right.
A failed test isn't a failure to optimize; it's a success in learning. It stops you from rolling out a change that would have hurt performance and gives you rock-solid intel on what your audience doesn't want.
Instead of just tossing the result, ask what it taught you. Compare the losing variation against your original hypothesis. Did the new headline completely miss the user's intent? Was that "simplified" design actually harder to navigate? Document these learnings like they're gold.
This creates an invaluable knowledge base that makes your next hypothesis smarter and more targeted. Every single experiment, win or lose, deepens your understanding of what makes your audience tick. This cycle—test, learn, refine—is the engine that drives real, sustainable growth.
Try our Marketing Plan Generator — generate a complete AI-powered marketing plan in minutes. No signup required.
Common A/B Testing Questions, Answered
Even with the slickest testing plan, you’re going to hit a few bumps. It happens to everyone. Let’s walk through some of the most common questions that pop up once you actually start running experiments.
Getting these right is what separates the teams that get real results from those who just spin their wheels.
So, What Should I Actually Be Testing?
It’s tempting to go for the big, flashy redesign right out of the gate. Resist that urge. The most powerful tests are often the most focused ones. Start small, learn fast, and build momentum.
- Calls-to-Action (CTAs): This is the classic for a reason. Compare specific, value-driven copy like "Get Your Free Quote" against a generic "Submit." Also test high-contrast colors (e.g., orange vs. blue) to see what stands out.
- Headlines: Your headline is your five-second pitch. Test different angles. Pit a benefit-driven headline ("Save 2 Hours Every Week") against one that pokes at a specific pain point ("Tired of Wasting Time?"). You’ll quickly learn what language actually grabs your audience.
- Images and Media: The visuals create the vibe. Compare an image of your product in action against a photo showing a happy customer. Or, test a static image against a short, punchy video to see if it boosts engagement metrics like time on page.
Can I Test More Than One Thing at Once?
This is a big one, and it’s where you hear people throw around terms like A/B testing and multivariate testing (MVT). It’s crucial to know the difference and when to use each.
A/B testing is your workhorse. It’s clean, simple, and direct. You’re testing one variable at a time—one headline against another, one button color against another. This simplicity is its strength; when you get a winner, you know exactly what caused the lift.
Multivariate testing (MVT) is the more complex cousin. It lets you test multiple variables and all their combinations at the same time. For instance, you could test two headlines and two hero images in a single experiment, which creates four unique variations for your audience to see.
The catch with MVT? It’s a traffic hog. To get statistically significant results for every single combination, you need a massive amount of volume. For most teams just starting out, sticking with classic A/B tests is the smarter, more practical path to getting actionable insights.
How Do I Know When a Test Is Really Done?
This is where discipline comes in. The golden rule is to run your test long enough to capture a full cycle of user behavior. For most businesses, that means at least one full business week. This smooths out the data, accounting for the natural peaks and valleys between a busy Monday morning and a quiet Saturday afternoon.
Whatever you do, don't stop a test just because it hits 95% statistical significance on day three. Early results are notoriously fickle. A variation that looks like a world-beater on Tuesday can easily regress to the mean by Friday.
Let the test run its planned course. This is what separates professional testers from amateurs. It’s how you ensure your data is solid and the decisions you make actually lead to growth.
Ready to stop guessing and start growing? marketbetter.ai uses predictive analytics and automated A/B testing to help you find winning variations faster. See how our AI-powered platform can improve your campaign conversions by 15% and give you back hours for strategic work. Get your demo today at marketbetter.ai.