Reducing customer churn: Practical retention strategies that work
Let's be honest: tackling customer churn isn't about just plugging a leak. It’s about understanding the true cost of losing a customer and reframing retention as a core growth engine. The game shifts entirely when you move from a reactive mindset—frantically trying to save customers who are already leaving—to a proactive strategy that builds loyalty from day one. Inaction is a strategy of its own, leading to a slow bleed of revenue, whereas a proactive approach turns retention into your most powerful growth lever.
Why Churn Is So Much More Than Just a Number
Customer churn often gets flattened into a single percentage on a dashboard. But that simple metric hides a far more complex and costly reality. It's not just a number; it’s a direct reflection of your company's health, your product-market fit, and the actual value you deliver.
One of the biggest mistakes is treating churn as a lagging indicator. This locks businesses into an expensive and exhausting cycle of constantly acquiring new customers just to replace the ones who leave—a treadmill you can't win on. A reactive approach means you're always playing catch-up, whereas a proactive one lets you set the pace.
The financial drain is almost always bigger than teams realize. That seemingly small monthly churn rate? It has a massive compounding effect. For instance, a 3% monthly churn rate doesn't just mean you lose 36% of your customers annually. Because of compounding losses, you actually lose nearly 43% of your customer base. Your sales and marketing teams end up running faster and faster just to stand still.
The Real-World Cost of a Leaky Bucket
The damage from high churn goes way beyond lost subscription fees. Globally, companies are estimated to lose $4.7 trillion every single year because of poor customer experiences, with a huge chunk of that coming directly from churn.
Think about this: 67% of consumers will jump to a competitor after just one bad experience. That's how little room for error you have. Nextiva's research digs into the impact of poor service, and it's a real eye-opener.
This is why having a simple, repeatable framework to understand and act on your churn data is non-negotiable.
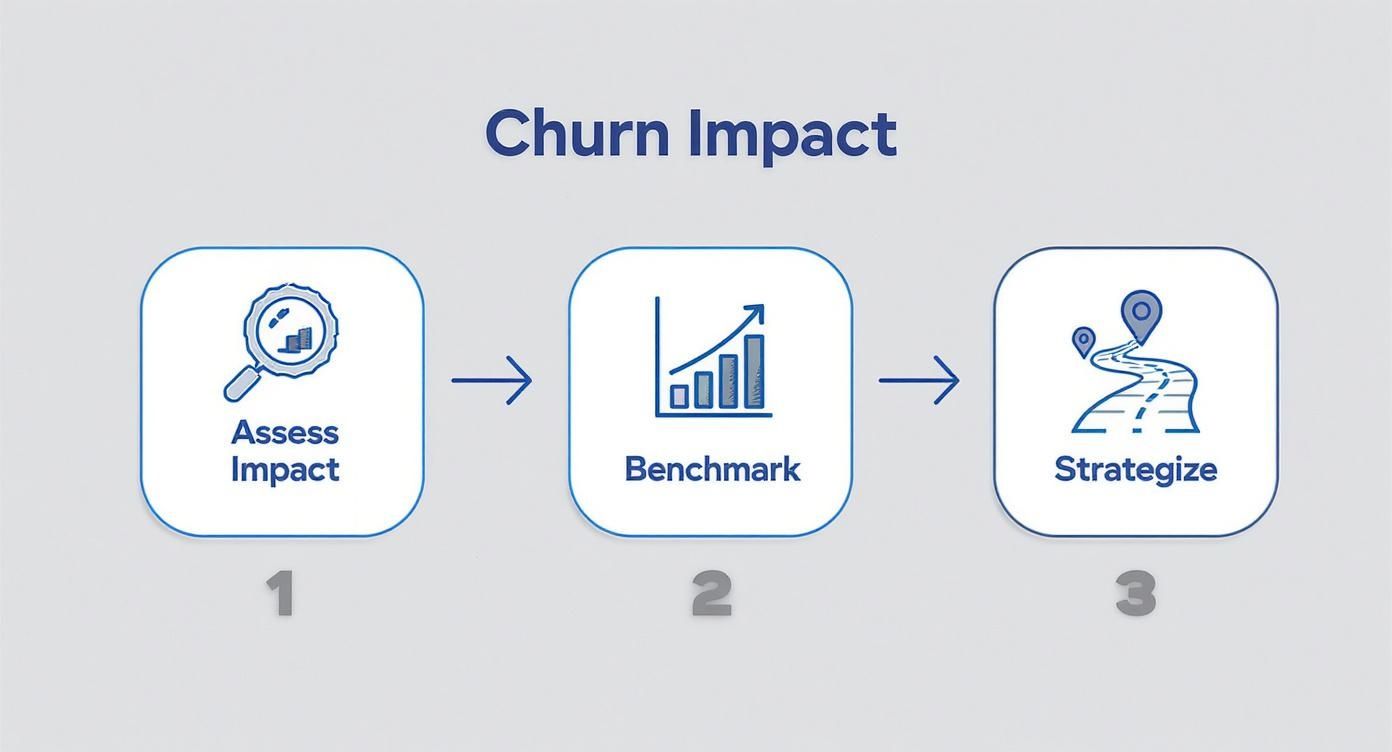
The path forward is clear: assess the real impact, benchmark your performance against what’s possible, and then build a targeted plan to fix it. This guide will walk you through each of those pillars, providing actionable steps you can implement today.
Your Churn Reduction Strategy at a Glance
| Strategy Area | Key Action | Primary Goal |
|---|---|---|
| Measurement & Analysis | Implement cohort analysis and track churn KPIs. | Gain a clear, accurate picture of when and why churn happens. |
| Root-Cause Diagnosis | Conduct qualitative surveys and customer interviews. | Uncover the "human story" behind the numbers. |
| Segmentation & Prediction | Use predictive modeling to identify at-risk customers. | Focus retention efforts where they'll have the most impact. |
| Proactive Engagement | Optimize onboarding and drive product adoption. | Build loyalty and "stickiness" from the very beginning. |
| Personalized Retention | Launch targeted campaigns for at-risk segments. | Deliver the right message at the right time to save customers. |
| Cross-Functional Alignment | Create feedback loops between CS, Product, and Marketing. | Make retention a company-wide responsibility. |
| AI-Powered Operationalization | Automate workflows and personalization with tools like marketbetter.ai. | Scale your retention efforts efficiently and effectively. |
This table is your roadmap. Each area builds on the last, creating a comprehensive system for turning churn into a source of sustainable growth.
Customer Churn vs. Revenue Churn
Before we dive deeper, it's absolutely critical to distinguish between two types of churn. They tell very different stories about your business, and you need to be tracking both.
- Customer Churn (or Logo Churn): This is the percentage of customers you lose in a given period. Actionable Step: Calculate this weekly to get an early warning signal on volume. It tells you exactly how many logos walked out the door.
- Revenue Churn (or MRR Churn): This measures the percentage of monthly recurring revenue lost from existing customers. This includes downgrades and cancellations. Actionable Step: Track this monthly alongside customer churn to understand the financial impact.
Imagine you lose ten small, low-tier customers but manage to keep one massive enterprise client. Your customer churn rate might look terrible, but your revenue churn could be minimal. Conversely, losing just one of those enterprise clients could obliterate your revenue, even if your customer churn percentage barely moves. This is why revenue churn is often the more critical metric for understanding the financial health of a subscription business. It’s where the real pain is felt.
Finding the Real Reasons Customers Leave
Guesswork is the enemy of retention. To stop customers from walking away, you must kill your assumptions and find out why they actually leave. Churn isn't just a single event; it's the final, painful outcome of a journey that went sideways long before they hit "cancel." Comparing a guess-based strategy to a data-driven one is like navigating with a treasure map versus a GPS—one leads to dead ends, the other to your destination.
Your overall churn rate is just a flashing red light on the dashboard. It tells you there's a problem, but it doesn't tell you where the engine is smoking. The real answers only surface when you blend different types of data.

Using Cohort Analysis to Pinpoint Problems
One of the most powerful tools in your diagnostic kit is cohort analysis. Instead of lumping all your customers into one giant pool, you group them by the month they signed up. This lets you track each group's behavior over their lifecycle, revealing patterns that are otherwise invisible.
Imagine your cohort analysis shows that customers who signed up in March have a 30% higher churn rate in their first month compared to those who joined in February. That’s a massive red flag.
Suddenly, you're not just guessing. Your investigation shifts from a vague "is our product bad?" to a laser-focused "what happened in March?"
The culprit could be anything:
- A buggy new feature release that soured the initial experience.
- A tweak to the onboarding flow that created a new point of friction.
- A new marketing campaign that brought in a flood of poorly-fit customers.
Actionable Step: Run a cohort analysis this week. Compare the first 90-day retention rates for your last three monthly cohorts. If you see a dip, start investigating marketing campaigns or product changes from that period.
Blending Quantitative and Qualitative Insights
Pinpointing the "when" is only half the battle; you still need to understand the "why." This is where you combine the hard numbers from your analytics with the human stories from your customers. The best churn reduction strategies live at this intersection.
| Data Type | What It Tells You | How to Collect It |
|---|---|---|
| Quantitative (The "What") | Identifies behavior at scale—feature adoption, login frequency, time in-app. | Product analytics tools (like Mixpanel or Amplitude), CRM data, usage logs. |
| Qualitative (The "Why") | Uncovers the motivations, frustrations, and context behind the numbers. | Exit surveys, NPS comments, customer interviews, support tickets, sales call notes. |
Let's say your quantitative data shows 70% of churned users never touched your "Project Reporting" feature. That’s an interesting correlation. This is where qualitative data closes the loop. Digging into exit surveys, you might find comments like, "I couldn't figure out how to generate a report." Now you have a clear, actionable problem to solve.
Your product analytics show you where the smoke is, but your customer feedback tells you what’s actually on fire. Neglecting one for the other is like trying to diagnose a patient by only looking at their lab results without ever speaking to them.
Turning Raw Data into a Clear Narrative
The final step is to weave all this information into a cohesive story. You're not just collecting data points; you're building a narrative that explains why a specific group of customers isn't succeeding.
Here’s an actionable framework to connect the dots:
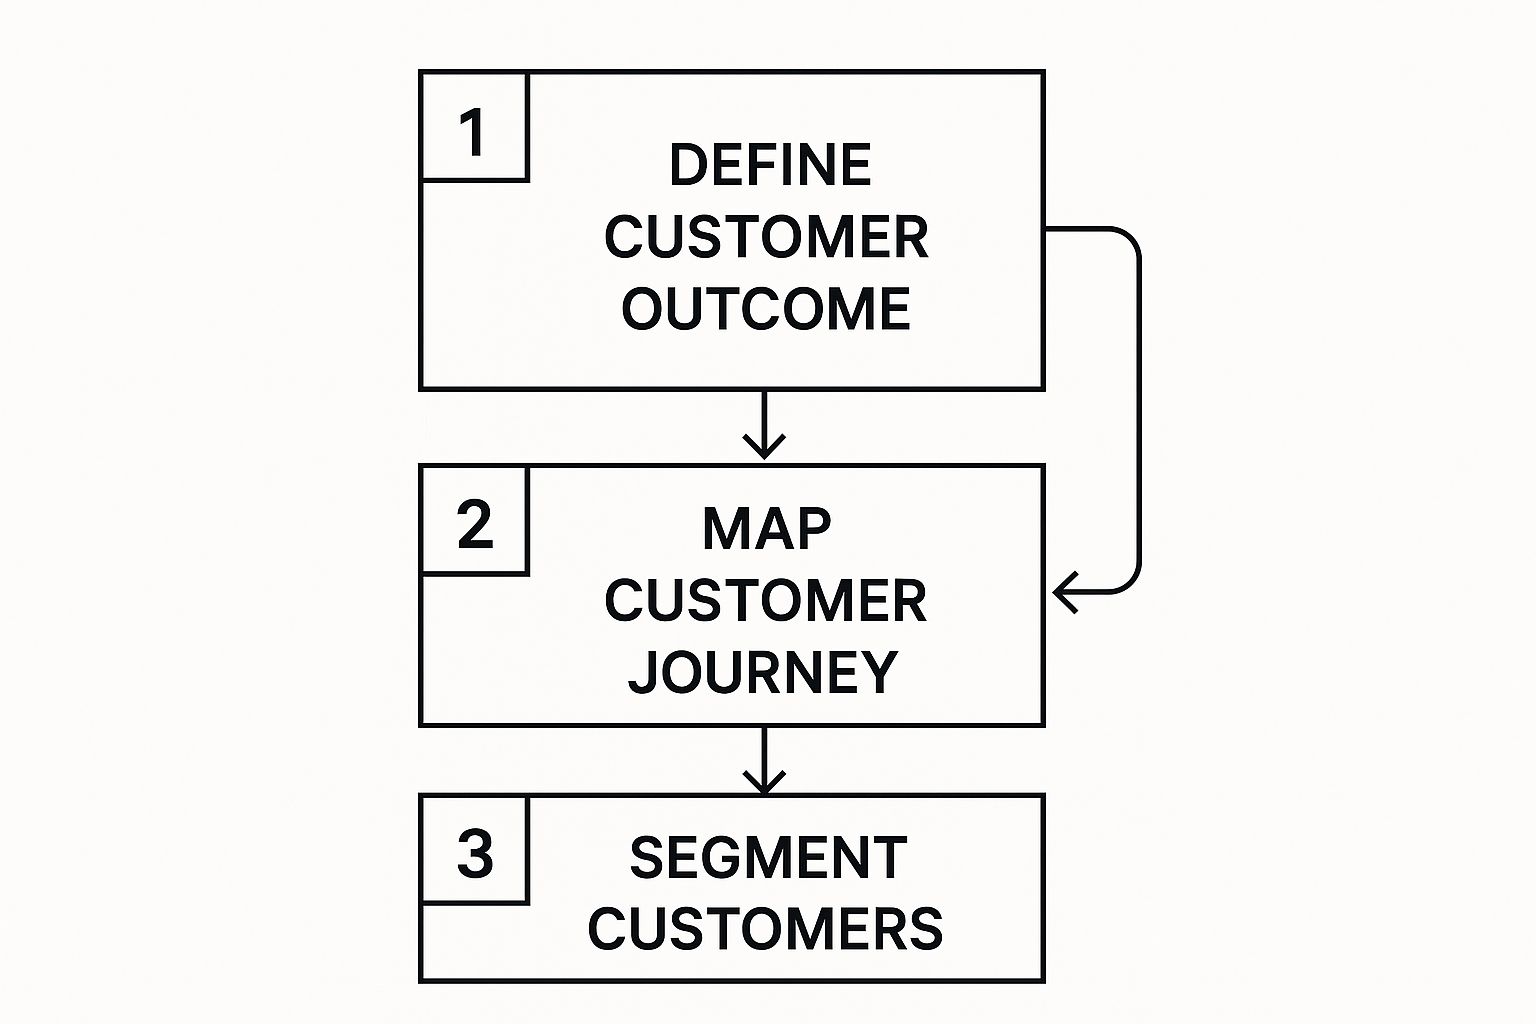
- Map the Churned Customer Journey: Use analytics to trace the typical path of a user who churns. Compare it to the path of a highly retained power user. Actionable Step: Identify the top 3 divergence points where at-risk users fail to take a critical action—like inviting a teammate or completing onboarding.
- Analyze In-App Behavior vs. Support Tickets: Cross-reference product usage data with support tickets. If you see tickets about "billing confusion" from users with low login rates, it’s a signal that perceived value isn't justifying the price.
- Listen to the Voice of the Customer (VoC): Systematically categorize feedback. Create buckets for every source (surveys, support) and tag themes. You can find excellent voice of customer examples and frameworks to structure this. This transforms anecdotes into quantifiable insights like "poor onboarding experience."
By combining these diagnostic tools, you move past symptoms and uncover true root causes—be it a confusing onboarding process or a competitor's killer offer—and build a targeted retention plan that actually works.
Don’t Just React to Churn—Get Ahead of It
The best time to stop a customer from leaving is long before they’ve even thought about it.
If you’re only scrambling to save accounts after they hit the cancel button, you’re playing a losing game. A proactive strategy isn’t damage control; it's about creating an environment where customers are so successful that looking elsewhere never crosses their minds. This is the difference between being a firefighter and an architect—one reacts to disasters, the other designs a structure to prevent them.
And you need to get on this, fast. A monthly churn rate of just 5% might sound manageable, but it compounds to losing nearly half (46%) of your customers over a year. As the Churnkey’s 2025 State of Retention report shows, it gets catastrophic very quickly.

Segment Your Customers to Make Your Outreach Count
Trying to talk to all your customers at once is like shouting into a void. The foundation of any good proactive strategy is smart segmentation. You group customers by shared traits to deliver timely, personalized help.
Here are a few powerful ways to slice up your customer base:
- Lifecycle Stage: A new user needs help getting started; a two-year veteran might be a fit for a beta program. Match your message to their journey.
- Customer Health Score: This early-warning system combines metrics like login frequency, key feature adoption, and NPS scores. Segment customers into "Healthy," "At-Risk," and "Endangered" buckets to create a specific playbook for each.
- Behavioral Data: Group users based on what they do. Actionable Step: Build a segment of users who haven’t used a key sticky feature in their first 30 days and hit them with a targeted tutorial campaign this month.
High-Touch vs. Low-Touch: Know When to Automate and When to Call
Once you have your segments, you can decide how much attention each one gets. Wasting your best customer success manager on a low-value account is as inefficient as neglecting an enterprise client with a generic email.
Here’s how the two approaches stack up:
| Tactic Comparison | High-Touch (Top-Tier Accounts) | Low-Touch (Scalable for Everyone Else) |
|---|---|---|
| Onboarding | Dedicated 1-on-1 calls, custom implementation plan, and success goals. | Automated email sequences, in-app product tours, and group webinars. |
| Engagement | Quarterly business reviews (QBRs), proactive check-ins, direct line of access. | Monthly newsletters, product update announcements, educational content. |
| At-Risk Intervention | A personal call from their CSM, a custom success plan, and maybe even executive outreach. | An automated re-engagement email campaign or targeted in-app messages. |
| Loyalty & Advocacy | Exclusive access to new features and invitations to customer advisory boards. | Milestone-based rewards and bonuses for the referral program. |
This two-pronged approach ensures your most critical accounts get white-glove service while you still nurture the rest of your customers efficiently.
Actionable Campaigns That Keep Customers Hooked
Okay, you have your segments and you know your tactics. Now it’s time to build campaigns that continuously prove your value.
Here are three campaigns you can implement this quarter:
- The "Aha!" Moment Onboarding Flow: Forget the generic welcome email. Map out the one critical action a new user must take to see your product's value. Then, focus your entire onboarding sequence on getting them to complete just that.
- The "Sleeping User" Re-engagement Drip: Set up an automated email sequence for users who haven't logged in for 30 days. The first email highlights a new feature. The next shares a case study. The last is a simple, plain-text email asking for feedback.
- The Proactive "Feature Adoption" Nudge: When you launch a new reporting tool, send a targeted email to power users of a related feature, explaining exactly how this new tool solves a problem you know they have.
A core component of any proactive retention strategy is fostering deep brand loyalty, which can be significantly enhanced by providing exceptional customer support. Learn more about building brand loyalty through exceptional customer support.
This kind of targeted effort is what separates companies with killer retention from those stuck on the hamster wheel of endless acquisition. By getting the right message to the right customer at the right time, you don't just stop churn—you create opportunities for expansion and end up improving customer lifetime value across the board.
Using AI to Predict and Prevent Churn��
Welcome to the new era of customer retention. The game has shifted from a reactive scramble to a proactive, intelligent system that spots trouble long before it ever surfaces. This is where you learn to see the future.
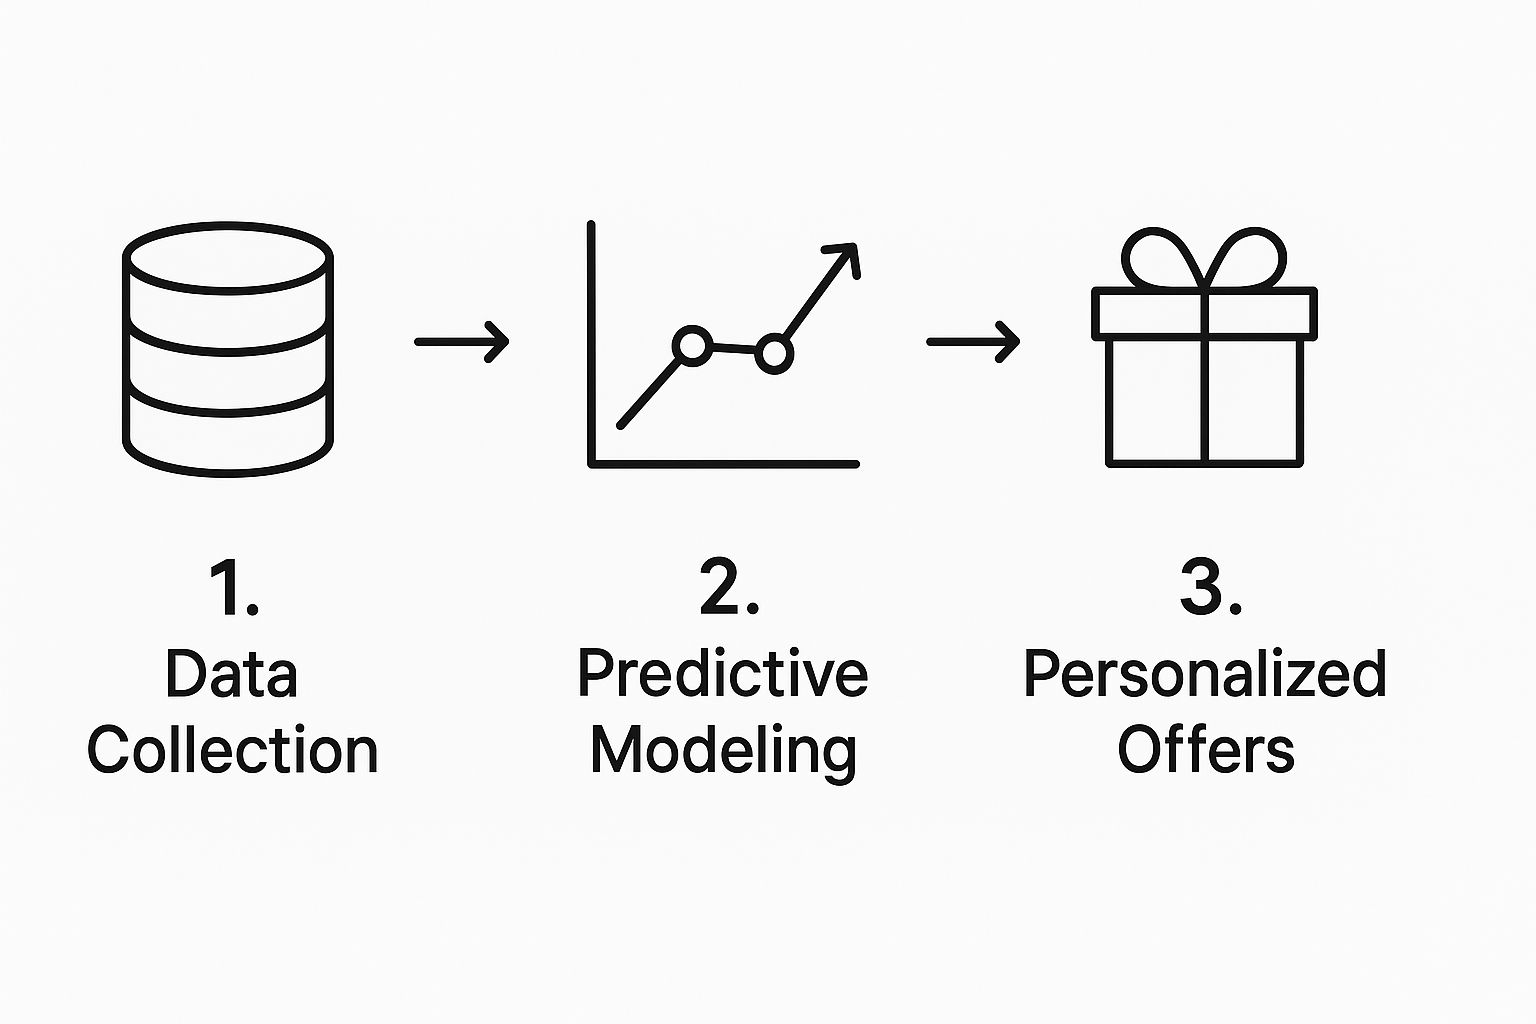
Forget waiting for a customer to complain or stop logging in. Modern AI tools analyze massive datasets in real time—support ticket sentiment, login frequency, payment history, and feature usage patterns. This creates a rich, multi-dimensional view of each customer's health.
The goal is to get beyond simple metrics. A drop in logins is a clue, but an AI model might find that a drop in logins combined with a recent failed payment and a support ticket tagged "bug" is a 90% predictor of churn within 30 days. That’s the kind of insight you can act on.
From Raw Data to Actionable Health Scores
This is where the magic happens. AI solutions synthesize raw data into a simple, actionable metric: a predictive customer health score. Think of it like a credit score for customer loyalty, telling your team who needs attention right now.
Here's how the old way compares to the new:
-
Rule-Based Systems (The Old Way): You manually set triggers like, "If a user hasn't logged in for 14 days, mark them as 'at-risk'." It's rigid and misses subtle signals. It's like only looking at a patient's temperature to diagnose an illness.
-
AI-Powered Predictive Models (The New Way): These systems learn from your actual historical data. They identify the complex, non-obvious patterns your past churned customers exhibited. The model might discover that users who ignore a specific feature during onboarding and then contact support about billing are your highest flight risk. It’s far more nuanced and accurate.
By using predictive analytics, companies can reduce churn by up to 15%. The power lies in spotting disengagement early, giving you more time and options to intervene with the right support.
Turning AI Insights into Proactive Interventions
A predictive score is useless if it just sits on a dashboard. The real value comes from plugging these AI insights directly into your operational workflows. To pull this off, businesses often need to integrate real-time customer data. Understanding how to approach integrating customer insights via a Widget API can be a key technical step in making these insights truly operational.
Here’s how you can make it actionable:
- Automated Alerts for Customer Success: When a high-value customer's health score drops from "Green" to "Yellow," the system should automatically create a task in your CRM for their CSM: "Proactive Check-In: [Customer Name]'s engagement has dipped."
- Personalized Marketing Campaigns: For a segment of "at-risk" users who haven’t adopted a key feature, trigger an automated email campaign showing them exactly how to use it. This is a core part of how predictive analytics in marketing is changing the game.
- In-App Nudges and Guidance: If a user’s behavior indicates they are struggling, an AI-driven tool can trigger a helpful in-app pop-up or guided tour at the perfect moment.
This approach completely flips the script on churn management. You stop fighting fires and start fireproofing your entire customer base.
Making Retention a Company-Wide Mission
Too many companies treat customer churn like a leaky faucet in the Customer Success team's office. But churn isn't a CS problem. It's a company problem. It's a lagging indicator of a breakdown that happened much earlier in the customer's journey. Lasting retention happens when every single team views the customer journey as a shared mission. A unified front isn't just nice to have; it's the only way to win.

Building Your Cross-Functional Feedback Loops
The bedrock of a retention-focused culture is a set of powerful, automated feedback loops. Imagine a customer fills out an exit survey, saying they left because a key reporting feature was too confusing. In a siloed company, that feedback dies in a spreadsheet. In a connected company, it becomes a catalyst for action.
Here’s how that looks in the real world:
- CS to Product: Insights from support tickets and exit surveys are tagged and funneled directly into the product team's backlog in a tool like Jira or Asana. The product team stops guessing and starts building based on direct user pain.
- Product to Marketing: Once the product team ships a fix, they close the loop with marketing. Marketing can then craft campaigns to re-engage users who churned for that exact reason, reinforcing the message: "We hear you, and we're taking action."
- CS to Marketing: Churn data is a goldmine for refining your ideal customer profile (ICP). By analyzing the traits of customers who churn quickly versus those who stay, CS provides priceless intel to Marketing to attract better-fit prospects.
The most powerful retention strategies aren't born from last-minute heroics. They are the cumulative result of hundreds of small, interconnected improvements made across the entire organization.
How Each Team Fights Customer Churn
Every department plays a crucial, distinct role in the fight against churn. Clearly defining these roles and the metrics they own is the key to creating accountability. When responsibilities are clear, finger-pointing disappears.
Here’s a simple breakdown of how different departments contribute to a unified customer retention strategy.
How Each Team Fights Customer Churn
| Department | Primary Role in Retention | Key Metrics Owned |
|---|---|---|
| Marketing | Attract and qualify the right customers who align with the product's core value. | Lead-to-Customer Conversion Rate, Customer Acquisition Cost (CAC) by Channel, and Churn Rate by Acquisition Cohort. |
| Product | Build an intuitive, valuable, and "sticky" product that solves real problems and encourages deep engagement. | Feature Adoption Rate, Time to Value (TTV), and User Engagement Scores. |
| Customer Success | Ensure customers achieve their desired outcomes through proactive guidance, support, and relationship management. | Net Revenue Retention (NRR), Customer Health Score, and Net Promoter Score (NPS). |
This table isn't just about assigning tasks; it’s about creating a common language and shared goals.
Running Meetings That Actually Drive Action
Building these feedback loops isn't just about software; it demands a structured, human touch. A recurring, cross-functional churn meeting is where raw data gets turned into actionable strategy.
Here's an actionable agenda to keep the meeting focused:
- Review the Numbers (5 mins): Briefly look at key churn and retention metrics from the last period.
- Analyze the "Why" (15 mins): CS presents the top 3-5 themes from recent churn feedback.
- Connect to the Roadmap (10 mins): Product discusses how these themes align with or challenge current priorities.
- Refine the Target (10 mins): Marketing shares how these insights are being used to sharpen targeting.
- Assign Action Items (5 mins): No discussion ends without a clear "who, what, and when."
This simple process transforms churn from a dreaded metric into a strategic asset. And that’s critical, because churn rates vary wildly by industry. For instance, the average churn rate for professional services can be 27%, while the wholesale sector can see rates as high as 56%. This data underscores why a one-size-fits-all approach fails. You can dig into more of these numbers by checking out these churn benchmarks from Customer Gauge's 2025 report.
Try our Lookalike Company Finder — find companies similar to your best customers in seconds. No signup required.
Common Questions About Reducing Churn
When you're in the trenches trying to plug the leaks, a handful of questions always pop up. Let's tackle some of the most common ones head-on.
What Is a Good Customer Churn Rate?
This is the million-dollar question, and the honest answer is: it depends. A young B2B SaaS company might be okay with a 3-5% monthly churn. But an established enterprise player? The expectation is to keep that number well under 1%. A B2C subscription box will naturally have a much higher churn rate than enterprise software.
Comparison Point: Instead of chasing an arbitrary benchmark, compare your churn rate to your own performance last quarter. The goal is a consistent downward trend. Improvement is the name of the game.
How Do You Calculate Customer Churn?
The basic formula is straightforward: take the number of customers you lost, divide it by the number you had at the start, and multiply by 100.
(30 lost customers ÷ 1,000 starting customers) x 100 = 3%
But that only tells you part of the story. You must also track revenue churn (MRR churn) to measure the actual dollars you lost. Losing three small customers is a completely different problem than losing one massive enterprise account.
Actionable Step: Calculate both customer churn and revenue churn for the last month. The difference between the two will immediately tell you if you are losing high-value or low-value customers.
What Is the First Step to Reduce Churn?
Before you do anything else, you have to diagnose the root cause. Jumping straight into solutions without understanding why people are leaving is like trying to fix an engine by randomly replacing parts.
To get started, triangulate your data:
- Set up an Exit Survey: This is non-negotiable. When a customer cancels, an automated survey should immediately ask them why.
- Dive into Product Analytics: Look for patterns among churned users. Did they never adopt that one sticky feature?
- Talk to Your Front-Line Teams: Your support and success teams are a goldmine of insights. Actionable Step: Schedule a 30-minute meeting with them this week and ask one simple question: "What are the top three frustrations you hear from customers?"
By blending the quantitative "what" (analytics) with the qualitative "why" (surveys and team feedback), you can build a retention roadmap that solves real problems.
Should I Focus on Churn Prevention or New Customers?
Both are critical, but pound for pound, retention almost always delivers a better return. It can be anywhere from 5 to 25 times more expensive to acquire a new customer than to keep an existing one. A tiny 5% bump in customer retention can boost profits by 25% to 95%.
Think of your business as a leaky bucket. Pouring more water (new customers) in is a fool's errand if you don't plug the holes first. A balanced approach is ideal, but a rock-solid retention strategy creates the stable foundation you need for sustainable growth. Plus, happy, loyal customers become part of your acquisition engine through referrals.
Ready to stop guessing and start predicting? marketbetter.ai uses AI to identify at-risk customers, automate personalized retention campaigns, and give your teams the insights they need to act before it's too late. See how you can reduce churn and drive sustainable growth by visiting https://www.marketbetter.ai today.