What Is a Good Conversion Rate? Benchmarks, Comparisons, and Actionable Optimization Tips
At its heart, conversion rate is your e-commerce batting average. Globally, most stores settle around 1.9%, while seasoned Shopify sellers often push into the 2.5–3.0% range. Compared to a new site converting at 1.2%, hitting 2.5% puts you in the top quartile. Use these numbers as your starting line—and then outpace them with targeted optimizations.
Quick Answer And Conversion Benchmarks
Conversion rates aren’t one-size-fits-all. They shift depending on your visitor’s device, how you acquire traffic, and the niche you’re in. Think of it as adjusting your swing for a fastball versus a curveball.
- Device Type influences click patterns and checkout friction. Compare desktop at 5.06% vs mobile at 2.49%.
- Acquisition Channel drives cost per sale and ROI. Paid search often rates 3.2%, while referral sits near 1.8%.
- Vertical Niche shapes visitor intent and buying behavior. Finance sites average 3.1%, apparel under 1.9%.
A solid rule of thumb: about 2 out of every 100 visitors convert when you hit the 1.9%–2.0% global mark. In contrast, veteran Shopify shops often break the 2.5% threshold, sometimes nearing 3.0%. Learn more about these findings on Blend Commerce.
Key Insight: The global e-commerce conversion rate hovers near 2%, but mature platforms can exceed 3%.
Overview Of Good Conversion Rate Benchmarks
Use this summary of global, platform, and industry figures to guide your goal setting—and see where you compare:
| Scope | Typical Conversion Rate | How You Compare |
|---|---|---|
| Global Average | 1.9%–2.0% | Baseline for sites of all sizes |
| Shopify Stores | 2.5%–3.0% | Top 25% of Shopify merchants |
| Early-Stage Sites | 1.0%–1.5% | New brands finding their footing |
| Subscription | 3.0%–5.0% | Recurring-revenue champions |
Use this table as your compass when defining realistic targets.
How To Use Benchmarks
- Benchmark your current rate against the table above.
- Highlight areas where you lag by 0.5% or more.
- Prioritize tests: start with your biggest gaps (e.g., mobile checkout if you’re 1.8% vs 2.49% device average).
- Set monthly and quarterly targets that nudge you 0.2–0.5% above each milestone.
Treat this as an ongoing cycle—measure, compare, optimize, and watch your conversion average climb.
Understanding Conversion Rate Impact
Conversion rate is more than just a percentage on your dashboard. It’s the real story of how well your site turns casual visitors into customers. A site at 1.9% is converting half as many people as a site at 3.8%, doubling revenue potential on equal traffic.
Imagine a bustling retail shop. All that foot traffic doesn’t pay off until people reach the cash register. In the online world, that cash register is your signup or checkout page. Even a 0.5-point uptick can translate into meaningful revenue gains.
Key Takeaway: Small conversion uplifts drive noticeable ROI shifts—benchmarked against your peers, a 0.5% boost could leapfrog you into the top quartile.
Why Small Changes Matter
It may feel trivial to move from 2.0% to 2.5%, but the math tells a different tale. On 10,000 monthly visits, that half-point boost delivers 50 additional actions. Compared to your competitor at 1.8%, you unlock an extra 70 conversions.
- Refine your calls-to-action so there’s no doubt about the next step. Compare “Buy Now” vs “Shop Now” button performance.
- Experiment with headlines that mirror visitor search intent. Test “Free 30-Day Trial” against “Start Your Free Trial”.
- Cut down form fields—every extra box is another reason someone might bail. Test 3-field vs 5-field checkouts.
Linking Budget To Results
Conversion rate is the bridge between your marketing spend and the dollars hitting your bank account. When more visitors convert, your cost per acquisition (CPA) drops—letting you stretch each advertising dollar further.
Pair your cost-per-click figures with conversion data for crystal-clear ROI insights. Then follow this simple process:
- Gather traffic and conversion data over a 30-day window.
- Calculate CPA by dividing total spend by total conversions.
- Spot campaigns with below-average conversion rates and sketch out A/B test plans.
- Shift budget toward your top performers and iterate.
Learn more about tying conversion metrics back to spend in our guide on measuring marketing effectiveness.
Action Steps To Elevate Impact
- Map out every conversion touchpoint from ad click to purchase confirmation—compare drop-off rates at each step.
- Pinpoint high-leverage spots where drop-offs exceed 30%, then apply targeted optimizations.
- Layer in behavioral tools like heatmaps or session recordings to catch any friction before it costs you.
- Run rapid A/B tests—aim for a new test every 2 weeks, swapping headlines, CTAs, or page layouts.
Remember: Small optimizations compound over time into major performance gains. Compare each test variant’s lift side-by-side to choose winners.
Real World Comparison
When Company A rolled out a redesigned checkout path, their conversion rate jumped from 1.8% to 2.4% in just two weeks. Meanwhile, Company B tweaked their email signup flow with personalized triggers and saw an increase from 2.1% to 3.0%.
| Company | Before CVR | After CVR | Relative Lift |
|---|---|---|---|
| Company A | 1.8% | 2.4% | 33% |
| Company B | 2.1% | 3.0% | 43% |
Use these real-world lifts as benchmarks for your own A/B and multivariate tests—and set goals that push you well beyond the industry averages.
Calculating Conversion Rate With Examples
Conversion rate is (total conversions ÷ total visits) × 100. If 2,000 people drop by and 50 complete a purchase, you’ve nailed a 2.5% rate—compared to the 2.0% global average, you’re outperforming many peers.
- Total Conversions: Number of completed goals (sales, signups).
- Total Visits: Unique visitors or sessions in a chosen timeframe.
- Time Window: Always match your conversion and visit dates.
Even a one-day mismatch or aggressive rounding can send your numbers off track. Sync your Google Analytics goals and date ranges for rock-solid accuracy.
Step By Step Calculation
- Define your goal in Google Analytics (or your analytics platform).
- Choose a consistent time window (last 30 days vs last quarter).
- Pull your total sessions or unique visitors.
- Pull your total goal completions.
- Calculate conversions ÷ visits × 100—and compare against your benchmarks.
Examples:
- E-Commerce Store: 1,500 visitors and 30 orders → 2%, matching the 1.9% global average.
- Lead Generation Funnel: 5,000 clicks and 250 form fills → 5%, outperforming many e-commerce sites.
- SaaS Trials: 2,000 signups and 400 activations → 20%, a benchmark for strong onboarding.
A well-tracked funnel reveals where visitors drop off and how small tweaks can lift your conversion by up to 20% in weeks.
Avoid Common Calculation Pitfalls
- Mixing sessions with user counts can skew your rate—pick one and document it.
- Ignoring multi-step funnels hides where people bail—break your funnel into stages and compare stage-by-stage.
- Over-rounding prematurely drifts your results—round only once at the end.
Follow this repeatable routine and your conversion calculations will stay accurate and actionable. Ready to streamline your conversion tracking? See how marketbetter.ai automates goal setup and reporting so you can focus on campaign optimization tasks.
Industry Conversion Rate Benchmarks
No two markets play by the same rules. Industries with urgent needs—like legal services—outperform those where decisions take longer. Compare your sector to these averages:
| Industry | Typical CVR | How You Compare |
|---|---|---|
| Food & Beverage | 2–3% | Seasonal spikes may push higher |
| Beauty/Skincare | 2–3% | Loyal followers boost repeat |
| Apparel | <1.9% | Compare your seasonal peaks |
| B2B E-Commerce | 1.6–1.9% | Long cycles, high deal value |
| Finance | 3.1% | Trust and service justify purchase |
| Legal | 3.4% | High urgency drives action |
For device-level insights, see the Statista global conversion rate report.
Vertical Medians And Quartiles
Benchmarking goes beyond averages. Think of percentiles as race positions on a track:
- 25th Percentile: Below-average performance
- 50th Percentile: Industry median
- 75th Percentile: Top performers
Plot your current rate on these percentiles and set incremental uplifts of 0.5% to move up one bracket each quarter.
Setting Sector Targets
- Pinpoint your current rate and find your percentile.
- Define incremental uplifts—start with 0.3–0.5% steps.
- Compare test outcomes: e.g., a 0.5% lift in finance equals moving from 3.1% to 3.6%, closing in on top-tier firms.
- Calibrate your roadmap: allocate more budget to strategies that outperform your sector by at least 10%.
Factors Influencing Industry Conversion Rates
Benchmarks don’t tell the full story. Three forces can shift your numbers:
- Order Value: Higher-ticket items often convert at 1–1.5%, but pay off with larger AOV.
- Purchase Frequency: Consumables (food & beverage) may convert at 2–3% regularly.
- Consumer Behavior: Holidays or economic shifts can temporarily boost or depress rates.
Comparing Different Approaches
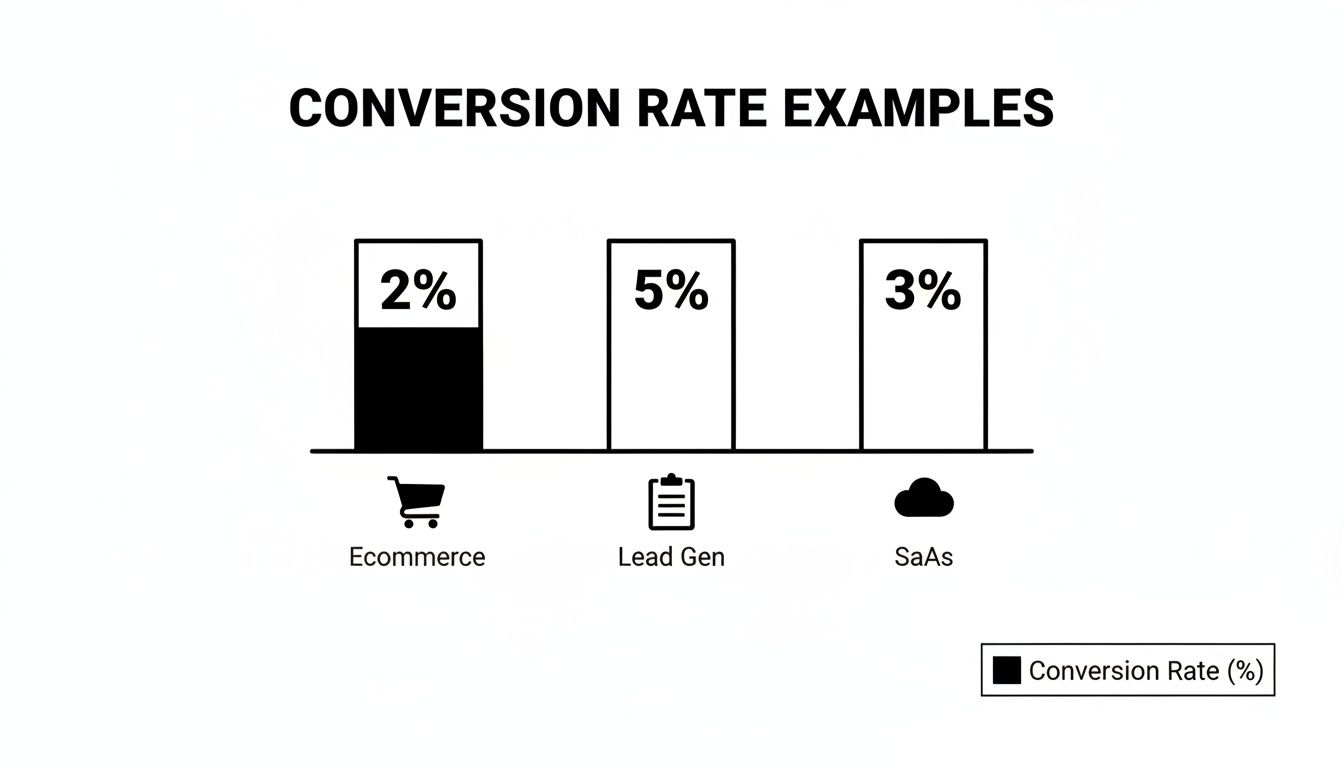
Each funnel type has its norms:
- E-commerce: ~2%
- Lead Gen: ~5%
- SaaS Trials: ~3% after onboarding
Compare your funnel’s performance to these norms and allocate resources to the highest-yielding ones.
Reducing Cart Abandonment
Even small hiccups cost. Compare your checkout abandonment (often 70%+) to a lean flow—aim for under 60%. Then:
- Minimize form fields to 3–4.
- Offer guest checkout vs forced sign-up.
- Provide multiple payment methods.
- Display trust badges prominently.
For automated testing and reporting, explore Marketing Performance Metrics.
Even minor checkout changes can translate into major conversion wins.
Channel And Device Conversion Benchmarks
Not every visitor behaves the same. Breaking down conversion by channel and device shows where to pour budget and effort. For instance, paid search often lands at 3.2%, topping the global average, while organic search sits near 2.7%. Desktop users convert at 5.06%, more than double mobile at 2.49%. Dive into the full Ruler Analytics research to see raw numbers.
Segmenting Reports For Action
Once you slice by channel and device, gaps jump off the page:
| Channel | Conversion Rate | Compared To Global Avg |
|---|---|---|
| Paid Search | 3.2% | +1.3% |
| Organic Search | 2.7% | +0.8% |
| 2.5% | +0.6% | |
| Referral | 1.8% | -0.1% |
Assign distinct conversion targets to each of these. For example, if your paid search is at 2.5%, plan tests to push it to 3.2% in 60 days.
Optimizing Based On Device Insights
Mobile often lags—improve yours from 2.49% to 3.5% by:
- Reducing checkout fields from 5 to 3.
- Implementing one-click payment options.
- Leveraging mobile-specific UI patterns (sticky CTA buttons).
Tablet sits between desktop and mobile at around 3.8%—capitalize on its larger screen with richer visuals.
Comparing Mixed Segments
Dig into combined segments for deeper insights:
- Mobile Email: ~1.5%, test mobile-optimized email templates.
- Desktop Referral: ~4.5%, amplify partner programs here.
Action Steps To Improve Conversion
- Segment reporting by channel-device pairs.
- Set 0.5%–1.0% lift goals for underperformers.
- Run A/B tests on top segments monthly.
- Shift budget toward overachieving segments biweekly.
Applying Benchmarks And Tactics
By applying these benchmarks, you can:
- Track ROI and CPA by segment.
- Measure LTV per channel-device combo.
- Spot emerging high-performers in real time.
Automate these reports to catch trends fast and refine strategy on the fly.
Diagnosing Conversion Rate Challenges
When your conversion rate plateaus, finding the root cause becomes non-negotiable. Below is a step-by-step framework—from A/B experiments to AI-powered enhancements—complete with comparisons and actionable next steps.
A/B Testing Framework
A rigorous A/B test cuts guesswork and surfaces true win-loss outcomes. Compare variant A vs B head-to-head:
- Define Clear Goals so every test targets a measurable outcome (e.g., button color vs placement).
- Segment Traffic to avoid cross-contamination.
- Use Control Groups to isolate external factors.
- Log Variations for a transparent audit trail.
Aim for 95% confidence and a consistent test window. Compare your test lifts: a 0.3% increase in CTA color changes is on par with industry averages.
Tracking And Reporting
Clean, organized data is the bedrock of optimization:
- Centralized logging for full visibility.
- Side-by-side segmented comparisons.
- Anomaly alerts to catch unexpected shifts.
Compare period-over-period results and share findings in weekly reports.
Personalization Tactics
When your site feels like it “knows” the visitor, engagement follows. Compare generic vs personalized pages:
- Pre-populate user names for returning visitors.
- Tailor offers by geography or past behavior.
- Trigger contextual pop-ups for high-value segments.
Personalization tests can reveal which audience slices react best—compare uplift by segment.
Post Test Diagnostics
After each test, audit results before declaring a winner:
- Verify sample size met thresholds.
- Confirm traffic sources remained consistent.
- Ensure variants stayed in their assigned segments.
Archive findings and compare success rates over multiple tests to spot patterns.
Comparative Method Analysis
No single method rules all scenarios—compare yields:
- A/B Tests: single change focus, quick insights.
- Multivariate Tests: complex combos, need more traffic.
- Surveys: uncover qualitative roadblocks.
- Session Recordings: highlight real-time UX friction.
Use the method that best fits your traffic volume and urgency.
Friction Reduction Audit
Map every step in your funnel and compare before/after fixes:
| Audit Item | Before Fix | After Fix |
|---|---|---|
| Checkout Fields | 5 fields | 2 fields |
| Page Load Time | 3s | 1.5s |
| Form Error Rates | 8% | 3% |
Removing just two fields often adds 0.5% to your CVR. Compare metrics weekly to track impact.
AI Driven Test Ideas
AI can accelerate your test pipeline. Compare manual vs AI-driven ideation:
- Predictive Text for subject lines and CTAs.
- Dynamic Content Blocks that adjust in real time.
- Automated Scheduling to hit traffic peaks.
- Real-Time Alerts for out-of-bounds metrics.
Each feature can boost conversions—compare lifts side-by-side.
Case Studies In UX Tweaks
| Company | Change | Before CVR | After CVR | Relative Lift |
|---|---|---|---|---|
| Company X | 6→3 checkout fields | 1.8% | 2.2% | 22% |
| Company Y | Dynamic banners for intent | 2.0% | 3.1% | 55% |
Combine A/B testing with personalization for compounding gains. Learn segmentation tactics in Customer Segmentation Strategies.
Channel Comparison
| Channel | Baseline CVR | Lifted CVR | Relative Lift |
|---|---|---|---|
| Paid Search | 3.0% | 3.6% | 20% |
| 2.5% | 3.0% | 20% | |
| Organic | 2.7% | 3.2% | 19% |
Set similar lift goals—compare test outcomes to your baselines.
Optimization Checklist
- Hypothesis drafted and documented.
- Audience segments defined and tagged.
- Traffic channels tracked separately.
- UI changes logged and versioned.
- Impact metrics selected and monitored.
- Statistical significance verified.
- Learnings shared with the team.
Compare your checklist completion rate to past sprints to speed up cycles.
Scaling Your Improvements
When you’ve identified winners, rollout quickly and compare adoption:
- Update style guides with proven microcopy.
- Sync development sprints around optimization wins.
- Automate rollout for stable variants.
- Schedule recurring audit cycles and compare performance across time.
Next Steps With AI Powered Platform
With marketbetter.ai, you can automate tests, track outcomes instantly, and optimize across channels at scale. Compare manual vs AI-augmented workflows for speed:
- AI-driven hypothesis generation.
- Automated segmentation-based testing.
- Live performance alerts.
- Unified reporting suite.
By systematically diagnosing conversion challenges, you build a data-driven roadmap for continuous lifts.
Diagnostic Tools Comparison
Pick the tool that fits your stack and test volume:
- Google Optimize for free A/B testing.
- Optimizely for enterprise-grade flexibility.
- VWO for intuitive visual editing.
- marketbetter.ai for AI-augmented diagnostics.
Key Insight: Consistent diagnostics and data-driven testing are the foundation of conversion rate mastery.
Try our Marketing Plan Generator — generate a complete AI-powered marketing plan in minutes. No signup required.
FAQ About Conversion Rates
Visitors often ask, “What counts as a good conversion rate?” Answers shift by industry and channel, but real benchmarks clear the fog and help you set targets that actually make sense.
- What is a good conversion rate for e-commerce versus B2B? Compare 2% e-commerce to 1.6–1.9% B2B.
- How often should I measure and update my CVR? High-traffic sites: daily; mid-traffic: weekly; low-traffic: monthly.
- Can I line up rates from email, search, and social side by side? Yes—segment before comparing to avoid blending highs (5% email) with lows (1.8% referral).
Knowing your baseline turns guesswork into action. For instance, if your email converts at 2% vs the 2.5–5% norm, that gap shows you where to focus next.
Tip From Experts: Always break your traffic into segments before you draw comparisons. A blended average can hide big wins (or losses).
Common Questions Answered
- Gather data from your last 30 days.
- Compare each channel’s rate against industry norms.
- Highlight gaps larger than 0.5% and prioritize A/B tests or tweaks.
Consistent tracking shines a light on trends and keeps surprises at bay. With these insights, you can sharpen landing pages, refine bids, and rally your team around clear, data-driven goals.
Boost conversions effortlessly with marketbetter.ai. Start optimizing and grow today at marketbetter.ai