
156 posts tagged with "Comparisons & Alternatives"

Side-by-side tool comparisons, alternatives, and competitive analysis

View All Tags

MarketBetter vs Warmly: Visitor ID + SDR Workflow [2026]

· 7 min read

Looking for a Warmly alternative? You're not alone.

Warmly is a strong player in visitor identification and intent data. But if you need more than just knowing who visited your site—if you need help acting on it—there's a gap.

MarketBetter fills that gap.

This comparison breaks down features, pricing, and the real differences so you can make the right call for your team.

Quick Comparison

FeatureMarketBetterWarmly
Website Visitor Identification✅ Company + person level✅ Company + person level
Intent Scoring✅ Fit + intent combined✅ ML-based intent scoring
Real-Time Alerts✅ Slack/Teams✅ Slack/Teams
AI Chatbot✅ Qualified-style with live handoff✅ AI-powered chatbot
CRM Integration✅ Salesforce + HubSpot (bidirectional)✅ Salesforce + HubSpot
SDR Task Assignment✅ Daily AI-generated task lists❌ Not included
Personalized Outreach✅ AI writes researched emails⚠️ Add-on (AI SDR agent)
Pre-Meeting Briefs✅ Auto-generated before every call❌ Not included
SDR Playbook/Workflow✅ Step-by-step guidance for reps❌ Not included
LinkedIn Integration✅ Connection + message tracking⚠️ LinkedIn Ads only
Missed Meeting Recovery✅ Auto-follow-up with gifts❌ Not included
3rd Party Intent Signals⚠️ Coming soon✅ Bombora integration
Starting PriceContact for pricing$15,000/year ($1,250/mo)

What Warmly Does Well

Let's be honest: Warmly is a solid product. Here's where they shine:

Strong Visitor Identification

Warmly reports identifying 15% of individual visitors and 65% of companies visiting your website. Their person-level de-anonymization is one of the best in the market.

Deep Intent Signals

Warmly aggregates 1st, 2nd, and 3rd party intent signals including:

  • Website behavior (page views, time on site)
  • Job changes and new hires
  • Bombora research intent data
  • Competitor keyword monitoring

Enterprise-Ready Infrastructure

With 220M+ people profiles, 40M+ company profiles, and SOC 2 compliance, Warmly is built for enterprise scale.

Strong G2 Reviews

Warmly has earned multiple G2 badges and positive reviews, particularly for their website visitor tracking capabilities.

Where MarketBetter Goes Further

Knowing who visited your site is table stakes. The question is: what happens next?

Warmly tells you who. MarketBetter tells you who, then tells your SDRs exactly what to do about it.

1. AI-Powered Task Assignment

MarketBetter doesn't just identify visitors—it creates daily task lists for your SDRs based on:

  • Visitor fit score
  • Intent signals
  • Geographic territory
  • Account ownership

Result: SDRs open their dashboard and know exactly who to contact, in what order, and why. No manual prioritization. No analysis paralysis.

2. Personalized Outreach at Scale

MarketBetter's AI writes first-draft emails that are:

  • Researched to the prospect's company (recent news, job postings, tech stack)
  • Personalized to the individual (role, seniority, likely pain points)
  • Ready for SDR review and send

With Warmly, AI outreach is an add-on to their base package.

3. Pre-Meeting Intelligence Briefs

Before every demo or call, MarketBetter automatically generates:

  • Company background and ICP fit
  • Pricing guidance based on company size
  • Talking points tailored to their browsing behavior
  • Potential objections and responses

Your AEs walk into calls prepared—without spending 30 minutes researching.

4. SDR Playbook Built In

New SDRs onboard in days, not months. MarketBetter's playbook tells them:

  • What tasks to do each day
  • What to say in outreach
  • When to follow up
  • What "good" looks like

This is the difference between "here's some intent data" and "here's how to turn that data into pipeline."

5. Full Workflow Coverage

MarketBetter covers the entire SDR motion:

StageMarketBetterWarmly
Identify
Prioritize✅ AI scoring✅ Intent scoring
Assign✅ Automated routing⚠️ Manual or via CRM
Research✅ AI-generated❌ Manual
Outreach✅ AI-drafted emails⚠️ Add-on
Follow-up✅ Automated sequences⚠️ Partial
Meeting Prep✅ Auto briefs❌ Manual
Reporting✅ Full SDR activity⚠️ Engagement only

Pricing Breakdown

Warmly Pricing (2026)

Warmly offers three tiers, all requiring annual commitment:

PlanPriceWhat's Included
TAM$15,000/year ($1,250/mo)Outbound orchestration, intent signals, dynamic audiences, email/LinkedIn push
Inbound$30,000/year ($2,500/mo)Everything above + visitor ID, chatbot, real-time alerts, lead routing
Full GTMCustom pricingUnified inbound + outbound, API access, SSO/SAML

Add-ons:

  • AI Outbound SDR Agent (additional cost)
  • AI Inbound Lead Caller (via Unibound, additional cost)

MarketBetter Pricing

MarketBetter offers flexible pricing that scales with your usage. Contact us for a custom quote based on:

  • Number of SDRs
  • Monthly website traffic
  • Outreach volume

What's included in every plan:

  • Visitor identification (company + person)
  • AI task assignment
  • Personalized outreach drafts
  • Pre-meeting briefs
  • SDR playbook
  • CRM sync (HubSpot + Salesforce)
  • Slack/Teams alerts

No surprise add-ons. No "AI agent" upsells.

Who Should Choose Warmly?

Warmly might be the better fit if:

  • You already have a mature SDR process and just need better visitor data
  • Enterprise scale is critical—you need 220M+ profiles and Bombora integration today
  • You want best-of-breed point solutions and plan to stitch together your own workflow
  • Budget isn't a primary concern and you can commit $15K-30K+ annually

Who Should Choose MarketBetter?

MarketBetter is the better fit if:

  • Your SDR team needs guidance, not just data
  • You're scaling a smaller team and need every rep to perform like a veteran
  • You want one platform for visitor ID + outreach + workflow (not 3 tools)
  • Onboarding speed matters—you need new SDRs productive in days
  • Budget flexibility is important—you want to avoid $15K+ annual commitments upfront

Real Results

MarketBetter Customer Outcomes

MetricResult
Positive Reply Rate29% average
SDR OnboardingDays instead of months
Missed RepliesZero (AI alerts on everything)
Customer Retention95%+ (1 downgrade in 18 months)

"Before MarketBetter, our SDRs spent half their day figuring out who to call. Now they just follow the tasks. We 2x'd meetings booked in the first month." — B2B IoT Company, 100 employees

Frequently Asked Questions

Does MarketBetter integrate with my CRM?

Yes. MarketBetter offers bidirectional sync with HubSpot and Salesforce. Activities, contacts, and deal updates flow both ways automatically.

How does visitor identification accuracy compare?

Both platforms use industry-standard methods for visitor identification. MarketBetter identifies companies via IP and enrichment, with person-level identification for logged-in users and high-intent visitors.

Can I use MarketBetter for just visitor identification?

Yes, but you'd be leaving value on the table. The real power is the combined workflow: identify → prioritize → assign → outreach → track. That's where pipeline comes from.

Does MarketBetter have Bombora intent data?

Third-party intent integration is on our roadmap. Currently, MarketBetter uses first-party intent signals (page views, time on site, return visits) combined with firmographic fit scoring.

Is there a free trial?

Contact us for a personalized demo. We'll show you MarketBetter working with your website traffic, not a generic demo.

The Bottom Line

Choose Warmly if you need enterprise-grade visitor identification and intent data, and you'll build the SDR workflow yourself.

Choose MarketBetter if you want visitor identification AND a complete SDR command center that tells your team what to do with that data.

Most companies don't struggle with knowing who visited. They struggle with what to do next.

MarketBetter solves both.

Free Tool

Try our AI Lead Generator — find verified LinkedIn leads for any company instantly. No signup required.

Ready to See the Difference?

Book a demo and we'll show you:

  1. Who's visiting your site right now
  2. How MarketBetter would prioritize those visitors
  3. What AI-generated outreach looks like for your actual prospects

Book a Demo →


Have questions? Email us at [email protected]

What Is a Good Conversion Rate? Benchmarks, Comparisons, and Actionable Optimization Tips

· 15 min read

At its heart, conversion rate is your e-commerce batting average. Globally, most stores settle around 1.9%, while seasoned Shopify sellers often push into the 2.5–3.0% range. Compared to a new site converting at 1.2%, hitting 2.5% puts you in the top quartile. Use these numbers as your starting line—and then outpace them with targeted optimizations.

Quick Answer And Conversion Benchmarks

Conversion rates aren’t one-size-fits-all. They shift depending on your visitor’s device, how you acquire traffic, and the niche you’re in. Think of it as adjusting your swing for a fastball versus a curveball.

  • Device Type influences click patterns and checkout friction. Compare desktop at 5.06% vs mobile at 2.49%.
  • Acquisition Channel drives cost per sale and ROI. Paid search often rates 3.2%, while referral sits near 1.8%.
  • Vertical Niche shapes visitor intent and buying behavior. Finance sites average 3.1%, apparel under 1.9%.

A solid rule of thumb: about 2 out of every 100 visitors convert when you hit the 1.9%–2.0% global mark. In contrast, veteran Shopify shops often break the 2.5% threshold, sometimes nearing 3.0%. Learn more about these findings on Blend Commerce.

Key Insight: The global e-commerce conversion rate hovers near 2%, but mature platforms can exceed 3%.

Overview Of Good Conversion Rate Benchmarks

Use this summary of global, platform, and industry figures to guide your goal setting—and see where you compare:

ScopeTypical Conversion RateHow You Compare
Global Average1.9%–2.0%Baseline for sites of all sizes
Shopify Stores2.5%–3.0%Top 25% of Shopify merchants
Early-Stage Sites1.0%–1.5%New brands finding their footing
Subscription3.0%–5.0%Recurring-revenue champions

Use this table as your compass when defining realistic targets.

Screenshot from https://blendcommerce.com/blogs/shopify/ecommerce-conversion-rate-benchmarks-2025

How To Use Benchmarks

  1. Benchmark your current rate against the table above.
  2. Highlight areas where you lag by 0.5% or more.
  3. Prioritize tests: start with your biggest gaps (e.g., mobile checkout if you’re 1.8% vs 2.49% device average).
  4. Set monthly and quarterly targets that nudge you 0.2–0.5% above each milestone.

Treat this as an ongoing cycle—measure, compare, optimize, and watch your conversion average climb.

Understanding Conversion Rate Impact

Conversion rate is more than just a percentage on your dashboard. It’s the real story of how well your site turns casual visitors into customers. A site at 1.9% is converting half as many people as a site at 3.8%, doubling revenue potential on equal traffic.

Imagine a bustling retail shop. All that foot traffic doesn’t pay off until people reach the cash register. In the online world, that cash register is your signup or checkout page. Even a 0.5-point uptick can translate into meaningful revenue gains.

Key Takeaway: Small conversion uplifts drive noticeable ROI shifts—benchmarked against your peers, a 0.5% boost could leapfrog you into the top quartile.

Why Small Changes Matter

It may feel trivial to move from 2.0% to 2.5%, but the math tells a different tale. On 10,000 monthly visits, that half-point boost delivers 50 additional actions. Compared to your competitor at 1.8%, you unlock an extra 70 conversions.

  • Refine your calls-to-action so there’s no doubt about the next step. Compare “Buy Now” vs “Shop Now” button performance.
  • Experiment with headlines that mirror visitor search intent. Test “Free 30-Day Trial” against “Start Your Free Trial”.
  • Cut down form fields—every extra box is another reason someone might bail. Test 3-field vs 5-field checkouts.

Linking Budget To Results

Conversion rate is the bridge between your marketing spend and the dollars hitting your bank account. When more visitors convert, your cost per acquisition (CPA) drops—letting you stretch each advertising dollar further.

Pair your cost-per-click figures with conversion data for crystal-clear ROI insights. Then follow this simple process:

  1. Gather traffic and conversion data over a 30-day window.
  2. Calculate CPA by dividing total spend by total conversions.
  3. Spot campaigns with below-average conversion rates and sketch out A/B test plans.
  4. Shift budget toward your top performers and iterate.

Learn more about tying conversion metrics back to spend in our guide on measuring marketing effectiveness.

Action Steps To Elevate Impact

  1. Map out every conversion touchpoint from ad click to purchase confirmation—compare drop-off rates at each step.
  2. Pinpoint high-leverage spots where drop-offs exceed 30%, then apply targeted optimizations.
  3. Layer in behavioral tools like heatmaps or session recordings to catch any friction before it costs you.
  4. Run rapid A/B tests—aim for a new test every 2 weeks, swapping headlines, CTAs, or page layouts.

Remember: Small optimizations compound over time into major performance gains. Compare each test variant’s lift side-by-side to choose winners.

Real World Comparison

When Company A rolled out a redesigned checkout path, their conversion rate jumped from 1.8% to 2.4% in just two weeks. Meanwhile, Company B tweaked their email signup flow with personalized triggers and saw an increase from 2.1% to 3.0%.

CompanyBefore CVRAfter CVRRelative Lift
Company A1.8%2.4%33%
Company B2.1%3.0%43%

Use these real-world lifts as benchmarks for your own A/B and multivariate tests—and set goals that push you well beyond the industry averages.

Calculating Conversion Rate With Examples

Conversion rate is (total conversions ÷ total visits) × 100. If 2,000 people drop by and 50 complete a purchase, you’ve nailed a 2.5% rate—compared to the 2.0% global average, you’re outperforming many peers.

  • Total Conversions: Number of completed goals (sales, signups).
  • Total Visits: Unique visitors or sessions in a chosen timeframe.
  • Time Window: Always match your conversion and visit dates.

Even a one-day mismatch or aggressive rounding can send your numbers off track. Sync your Google Analytics goals and date ranges for rock-solid accuracy.

Step By Step Calculation

  1. Define your goal in Google Analytics (or your analytics platform).
  2. Choose a consistent time window (last 30 days vs last quarter).
  3. Pull your total sessions or unique visitors.
  4. Pull your total goal completions.
  5. Calculate conversions ÷ visits × 100—and compare against your benchmarks.

Examples:

  • E-Commerce Store: 1,500 visitors and 30 orders → 2%, matching the 1.9% global average.
  • Lead Generation Funnel: 5,000 clicks and 250 form fills → 5%, outperforming many e-commerce sites.
  • SaaS Trials: 2,000 signups and 400 activations → 20%, a benchmark for strong onboarding.

A well-tracked funnel reveals where visitors drop off and how small tweaks can lift your conversion by up to 20% in weeks.

Avoid Common Calculation Pitfalls

  • Mixing sessions with user counts can skew your rate—pick one and document it.
  • Ignoring multi-step funnels hides where people bail—break your funnel into stages and compare stage-by-stage.
  • Over-rounding prematurely drifts your results—round only once at the end.

Follow this repeatable routine and your conversion calculations will stay accurate and actionable. Ready to streamline your conversion tracking? See how marketbetter.ai automates goal setup and reporting so you can focus on campaign optimization tasks.

Industry Conversion Rate Benchmarks

No two markets play by the same rules. Industries with urgent needs—like legal services—outperform those where decisions take longer. Compare your sector to these averages:

IndustryTypical CVRHow You Compare
Food & Beverage2–3%Seasonal spikes may push higher
Beauty/Skincare2–3%Loyal followers boost repeat
Apparel<1.9%Compare your seasonal peaks
B2B E-Commerce1.6–1.9%Long cycles, high deal value
Finance3.1%Trust and service justify purchase
Legal3.4%High urgency drives action

For device-level insights, see the Statista global conversion rate report.

Vertical Medians And Quartiles

Benchmarking goes beyond averages. Think of percentiles as race positions on a track:

  • 25th Percentile: Below-average performance
  • 50th Percentile: Industry median
  • 75th Percentile: Top performers

Plot your current rate on these percentiles and set incremental uplifts of 0.5% to move up one bracket each quarter.

Setting Sector Targets

  1. Pinpoint your current rate and find your percentile.
  2. Define incremental uplifts—start with 0.3–0.5% steps.
  3. Compare test outcomes: e.g., a 0.5% lift in finance equals moving from 3.1% to 3.6%, closing in on top-tier firms.
  4. Calibrate your roadmap: allocate more budget to strategies that outperform your sector by at least 10%.

Factors Influencing Industry Conversion Rates

Benchmarks don’t tell the full story. Three forces can shift your numbers:

  • Order Value: Higher-ticket items often convert at 1–1.5%, but pay off with larger AOV.
  • Purchase Frequency: Consumables (food & beverage) may convert at 2–3% regularly.
  • Consumer Behavior: Holidays or economic shifts can temporarily boost or depress rates.

Comparing Different Approaches

Each funnel type has its norms:

  • E-commerce: ~2%
  • Lead Gen: ~5%
  • SaaS Trials: ~3% after onboarding

Compare your funnel’s performance to these norms and allocate resources to the highest-yielding ones.

Reducing Cart Abandonment

Even small hiccups cost. Compare your checkout abandonment (often 70%+) to a lean flow—aim for under 60%. Then:

  • Minimize form fields to 3–4.
  • Offer guest checkout vs forced sign-up.
  • Provide multiple payment methods.
  • Display trust badges prominently.

Infographic about what is a good conversion rate

For automated testing and reporting, explore Marketing Performance Metrics.

Even minor checkout changes can translate into major conversion wins.

Channel And Device Conversion Benchmarks

Not every visitor behaves the same. Breaking down conversion by channel and device shows where to pour budget and effort. For instance, paid search often lands at 3.2%, topping the global average, while organic search sits near 2.7%. Desktop users convert at 5.06%, more than double mobile at 2.49%. Dive into the full Ruler Analytics research to see raw numbers.

Segmenting Reports For Action

Once you slice by channel and device, gaps jump off the page:

ChannelConversion RateCompared To Global Avg
Paid Search3.2%+1.3%
Organic Search2.7%+0.8%
Email2.5%+0.6%
Referral1.8%-0.1%

Assign distinct conversion targets to each of these. For example, if your paid search is at 2.5%, plan tests to push it to 3.2% in 60 days.

Optimizing Based On Device Insights

Mobile often lags—improve yours from 2.49% to 3.5% by:

  • Reducing checkout fields from 5 to 3.
  • Implementing one-click payment options.
  • Leveraging mobile-specific UI patterns (sticky CTA buttons).

Tablet sits between desktop and mobile at around 3.8%—capitalize on its larger screen with richer visuals.

Comparing Mixed Segments

Dig into combined segments for deeper insights:

  • Mobile Email: ~1.5%, test mobile-optimized email templates.
  • Desktop Referral: ~4.5%, amplify partner programs here.

Action Steps To Improve Conversion

  1. Segment reporting by channel-device pairs.
  2. Set 0.5%–1.0% lift goals for underperformers.
  3. Run A/B tests on top segments monthly.
  4. Shift budget toward overachieving segments biweekly.

Applying Benchmarks And Tactics

By applying these benchmarks, you can:

  • Track ROI and CPA by segment.
  • Measure LTV per channel-device combo.
  • Spot emerging high-performers in real time.

Automate these reports to catch trends fast and refine strategy on the fly.

Diagnosing Conversion Rate Challenges

When your conversion rate plateaus, finding the root cause becomes non-negotiable. Below is a step-by-step framework—from A/B experiments to AI-powered enhancements—complete with comparisons and actionable next steps.

A/B Testing Framework

A rigorous A/B test cuts guesswork and surfaces true win-loss outcomes. Compare variant A vs B head-to-head:

  • Define Clear Goals so every test targets a measurable outcome (e.g., button color vs placement).
  • Segment Traffic to avoid cross-contamination.
  • Use Control Groups to isolate external factors.
  • Log Variations for a transparent audit trail.

Aim for 95% confidence and a consistent test window. Compare your test lifts: a 0.3% increase in CTA color changes is on par with industry averages.

Tracking And Reporting

Clean, organized data is the bedrock of optimization:

  • Centralized logging for full visibility.
  • Side-by-side segmented comparisons.
  • Anomaly alerts to catch unexpected shifts.

Compare period-over-period results and share findings in weekly reports.

Personalization Tactics

When your site feels like it “knows” the visitor, engagement follows. Compare generic vs personalized pages:

  • Pre-populate user names for returning visitors.
  • Tailor offers by geography or past behavior.
  • Trigger contextual pop-ups for high-value segments.

Personalization tests can reveal which audience slices react best—compare uplift by segment.

Post Test Diagnostics

After each test, audit results before declaring a winner:

  • Verify sample size met thresholds.
  • Confirm traffic sources remained consistent.
  • Ensure variants stayed in their assigned segments.

Archive findings and compare success rates over multiple tests to spot patterns.

Comparative Method Analysis

No single method rules all scenarios—compare yields:

  • A/B Tests: single change focus, quick insights.
  • Multivariate Tests: complex combos, need more traffic.
  • Surveys: uncover qualitative roadblocks.
  • Session Recordings: highlight real-time UX friction.

Use the method that best fits your traffic volume and urgency.

Friction Reduction Audit

Map every step in your funnel and compare before/after fixes:

Audit ItemBefore FixAfter Fix
Checkout Fields5 fields2 fields
Page Load Time3s1.5s
Form Error Rates8%3%

Removing just two fields often adds 0.5% to your CVR. Compare metrics weekly to track impact.

AI Driven Test Ideas

AI can accelerate your test pipeline. Compare manual vs AI-driven ideation:

  1. Predictive Text for subject lines and CTAs.
  2. Dynamic Content Blocks that adjust in real time.
  3. Automated Scheduling to hit traffic peaks.
  4. Real-Time Alerts for out-of-bounds metrics.

Each feature can boost conversions—compare lifts side-by-side.

Case Studies In UX Tweaks

CompanyChangeBefore CVRAfter CVRRelative Lift
Company X6→3 checkout fields1.8%2.2%22%
Company YDynamic banners for intent2.0%3.1%55%

Combine A/B testing with personalization for compounding gains. Learn segmentation tactics in Customer Segmentation Strategies.

Channel Comparison

ChannelBaseline CVRLifted CVRRelative Lift
Paid Search3.0%3.6%20%
Email2.5%3.0%20%
Organic2.7%3.2%19%

Set similar lift goals—compare test outcomes to your baselines.

Optimization Checklist

  • Hypothesis drafted and documented.
  • Audience segments defined and tagged.
  • Traffic channels tracked separately.
  • UI changes logged and versioned.
  • Impact metrics selected and monitored.
  • Statistical significance verified.
  • Learnings shared with the team.

Compare your checklist completion rate to past sprints to speed up cycles.

Scaling Your Improvements

When you’ve identified winners, rollout quickly and compare adoption:

  • Update style guides with proven microcopy.
  • Sync development sprints around optimization wins.
  • Automate rollout for stable variants.
  • Schedule recurring audit cycles and compare performance across time.

Next Steps With AI Powered Platform

With marketbetter.ai, you can automate tests, track outcomes instantly, and optimize across channels at scale. Compare manual vs AI-augmented workflows for speed:

  • AI-driven hypothesis generation.
  • Automated segmentation-based testing.
  • Live performance alerts.
  • Unified reporting suite.

By systematically diagnosing conversion challenges, you build a data-driven roadmap for continuous lifts.

Diagnostic Tools Comparison

Pick the tool that fits your stack and test volume:

  • Google Optimize for free A/B testing.
  • Optimizely for enterprise-grade flexibility.
  • VWO for intuitive visual editing.
  • marketbetter.ai for AI-augmented diagnostics.

Key Insight: Consistent diagnostics and data-driven testing are the foundation of conversion rate mastery.

Free Tool

Try our Marketing Plan Generator — generate a complete AI-powered marketing plan in minutes. No signup required.

FAQ About Conversion Rates

Visitors often ask, “What counts as a good conversion rate?” Answers shift by industry and channel, but real benchmarks clear the fog and help you set targets that actually make sense.

  • What is a good conversion rate for e-commerce versus B2B? Compare 2% e-commerce to 1.6–1.9% B2B.
  • How often should I measure and update my CVR? High-traffic sites: daily; mid-traffic: weekly; low-traffic: monthly.
  • Can I line up rates from email, search, and social side by side? Yes—segment before comparing to avoid blending highs (5% email) with lows (1.8% referral).

Knowing your baseline turns guesswork into action. For instance, if your email converts at 2% vs the 2.5–5% norm, that gap shows you where to focus next.

Tip From Experts: Always break your traffic into segments before you draw comparisons. A blended average can hide big wins (or losses).

Common Questions Answered

  1. Gather data from your last 30 days.
  2. Compare each channel’s rate against industry norms.
  3. Highlight gaps larger than 0.5% and prioritize A/B tests or tweaks.

Consistent tracking shines a light on trends and keeps surprises at bay. With these insights, you can sharpen landing pages, refine bids, and rally your team around clear, data-driven goals.


Boost conversions effortlessly with marketbetter.ai. Start optimizing and grow today at marketbetter.ai

Best Marketing Campaign Management Software: 10 Tools Compared (2026)

· 23 min read

Running multi-channel marketing campaigns across email, ads, social, and events without a central platform is a recipe for missed deadlines, wasted budget, and duplicate outreach.

Marketing campaign management software solves this by giving your team one place to plan, launch, track, and optimize every campaign. We compared 10 platforms — from HubSpot's all-in-one suite to Monday.com's project-first approach — to help you pick the right one without wasting months on trials.

  • The Problem: The content team writes a blog post in Google Docs. The social media manager schedules posts in a separate app. The email marketer designs a newsletter in another tool. The ads specialist is buried deep inside the Google Ads interface.
  • The Actionable Fix: A unified platform connects these dots. It lets you see that a specific blog post led to an email signup, which then warmed up a lead who finally converted from a retargeting ad-all within a single dashboard.

Each tool has its own island of data. Trying to stitch it all together to see the big picture is a manual, soul-crushing nightmare. You're left guessing which channel actually brought in the sale. A proper campaign management platform connects these dots.

The real magic of campaign management software is its ability to turn fragmented tasks into a cohesive, measurable strategy. It shifts the conversation from, "What did we do?" to "What worked, and why?"

This isn't just about making life easier; it's about driving tangible business results. And the market reflects this. The advertiser campaign management software market was valued at a hefty USD 10,327.4 million in 2021 and is projected to skyrocket to USD 25,710.1 million by 2033. That explosive growth shows just how vital this kind of centralized control has become. You can dig into the numbers yourself in this comprehensive market report.

Solving Critical Marketing Challenges

This kind of software hits the biggest marketing pain points head-on. It provides real solutions for those chronic problems that keep teams from growing, like inconsistent brand messaging across channels, wasted effort from team members accidentally doing the same work, and the endless struggle to prove ROI to the higher-ups.

By bringing your tools and data under one roof, it helps you finally get a grip on the complexity and focus on what really matters: creating campaigns that make an impact.

What Features Actually Matter in a Marketing Campaign Tool?

Picking the right marketing campaign software can feel like a chore. Every platform flashes shiny features and promises the world, and it's easy to get lost in the sales pitches. To cut through the noise, you need to ignore the fluff and zero in on the core functions that actually move the needle on your campaigns.

Think of it like this: without these key features, a platform is just a fancy to-do list. But with them, it becomes the central engine powering your entire marketing strategy, turning a bunch of separate tasks into a coordinated, high-impact machine.

Let's break down the non-negotiables you should look for.

H3: Multi-Channel Campaign Orchestration

Modern marketing isn't a one-trick pony. Your campaigns live across social media, email, paid ads, and your blog all at once. True multi-channel orchestration lets you manage all these moving parts from a single command center.

  • Comparison: A basic project management tool might let you list tasks for email and social, but a true campaign management platform lets you execute and track them from one place.
  • Actionable Takeaway: When evaluating software, ask to see a demo of a single campaign's calendar view. If you can't see the email send dates, social post schedules, and ad flight times all on one screen, it lacks true orchestration.

H3: Intelligent Workflow Automation

Repetitive tasks are the enemy of good marketing. Workflow automation is your secret weapon, letting you put all that manual drudgery on autopilot so your team can focus on big-picture strategy. In fact, smart automation can boost marketing productivity by 20%.

The infographic below shows this in action-how automated workflows can create a perfect sequence of events, which is the whole point of modern marketing efficiency.

  • Comparison: Simple automation might just send a thank-you email. Intelligent automation can create branching logic: if a lead opens the email but doesn't click, send a follow-up with a different subject line in two days. If they do click, notify a sales rep immediately.
  • Actionable Takeaway: Ask vendors for specific examples of "if-this-then-that" logic their platform supports. Can it trigger actions based on website behavior, email engagement, and CRM data?

H3: Centralized Digital Asset Library

"Hey, where can I find the latest logo?" If you've heard that question one too many times, you need a centralized digital asset library (or DAM). It puts an end to the chaos by creating a single source of truth for every creative file-from images and videos to ad copy and brand guides.

  • Comparison: Using a tool like Google Drive is better than nothing, but a native DAM within your campaign software adds version control, usage rights, and the ability to link assets directly to specific campaigns for performance tracking.
  • Actionable Takeaway: During a demo, test the search functionality of the asset library. Can you find an image by its color, orientation, or the campaign it was used in? This level of detail separates a basic folder system from a professional DAM.

A centralized asset library doesn't just save time; it protects your brand's integrity. It's the difference between a polished, professional presence and a fragmented, inconsistent one.

This feature often integrates with or completely replaces many of the top content marketing tools, helping you consolidate your tech stack and work more efficiently.

H3: Robust Analytics and Reporting

You can't improve what you don't measure. Solid analytics and reporting are probably the most important features of any marketing software because they turn your marketing from a guessing game into a data-driven science.

With good reporting, you can see which email subject lines get the most opens, which social channels bring in the best leads, and how your ad spend is actually turning into revenue. Some platforms even have predictive analytics to help you forecast results. To get a better sense of how data can sharpen your focus, check out our guide on using https://marketbetter.ai/playbooks/ai-lead-scoring to prioritize your best prospects.

A solid platform should give you the core features needed to track and optimize your entire funnel. Here's a quick breakdown of what to look for.

Essential Features of Marketing Campaign Management Software

FeatureCore FunctionalityKey Benefit
Multi-Channel OrchestrationManage email, social, ads, and content from one dashboard.Creates a consistent customer experience and unified campaign view.
Workflow AutomationSet up "if-then" rules to automate repetitive marketing tasks.Frees up team time for strategic work and reduces human error.
Centralized Asset LibraryA single, searchable hub for all brand and creative assets.Ensures brand consistency and stops version control nightmares.
Analytics & ReportingTrack KPIs, attribute results to specific channels and campaigns.Provides clear data to measure ROI and make smarter decisions.
Budget & Expense TrackingAllocate and monitor spending for campaigns in real-time.Prevents overspending and proves the financial impact of marketing.

Ultimately, these features work together to give you a complete, 360-degree view of your marketing operations, from the initial idea to the final sale.

H3: Granular Budget and Expense Tracking

Finally, you have to know where the money is going. Granular budget tracking lets you assign funds to specific campaigns, channels, or even individual ads, then watch your spending in real time.

Think of this feature as your financial command center. It helps you stop overspending before it happens, pinpoint which channels deliver the best return on ad spend (ROAS), and confidently walk into any meeting ready to justify your marketing budget with cold, hard data.

An Actionable Comparison of Top Platforms

Picking the right campaign management software isn't about finding the one with the longest feature list. It's about matching a tool to your team's real, day-to-day problems. What works for a scrappy startup could easily bog down a massive enterprise, and the reverse is just as true.

So, instead of a generic rundown, let's look at this through the lens of actual business needs. Once you understand the core philosophy behind the leading platforms, you can connect your team's specific pain points to the right software and make a decision you won't regret.

For Teams Focused on Project Management and Visibility

Your Problem: "I have no idea who is working on what. Deadlines are a suggestion, and our campaign launches are pure chaos." The Solution: Platforms like Monday.com and Asana are built to solve this exact collaboration headache.

Think of these tools as the mission control for your projects. Their superpower lies in visual task management, crystal-clear timelines, and making team collaboration feel effortless.

  • Monday.com vs. Asana: Monday.com excels in visual, customizable dashboards-it's like building with LEGOs for your workflow. It's ideal if you want to design your process from scratch. Asana is the master of task dependencies and structured projects; it's perfect for complex campaigns where Step B cannot start until Step A is complete.
  • Actionable Use Case: If you are a creative agency juggling 20 client projects, Monday.com's visual boards can give each client a unique workflow. If you are launching a multi-stage product, Asana's timeline and dependency features ensure a smooth, sequential rollout.

These platforms are less about deep customer data and more about getting the work done efficiently. They're the right call for creative agencies, content teams, or any marketing department where the biggest challenge is managing the production line of campaign assets.

For Organizations Needing All-in-One CRM and Marketing

Your Problem: "Our sales and marketing teams are strangers. We get leads, but we have no idea which ones are good or what happens to them after we pass them over." The Solution: An all-in-one platform with a CRM at its core, like HubSpot, is designed to bridge this gap.

HubSpot's strength is its unified view of the customer. By combining marketing, sales, and service tools around a single CRM, it provides a complete timeline for every contact.

With a platform like HubSpot, you can trace a lead's entire story without jumping between tabs. You see the blog post they read, the email they opened, the sales call they had, and the support ticket they submitted-all in one timeline.

  • Actionable Use Case: Use HubSpot's lead scoring to automatically notify a sales rep when a prospect visits your pricing page three times. This simple automation, powered by the integrated CRM and marketing tools, turns a marketing action into a direct sales opportunity.

This integrated approach is a game-changer for businesses focused on lead nurturing, aligning sales and marketing, and proving how marketing actually contributes to the bottom line. It's a fantastic choice for mid-market companies that have outgrown their mess of scattered tools and just need one source of truth.

For Enterprises Demanding Powerful Automation and Analytics

Your Problem: "We have massive amounts of data and complex customer journeys. We need to execute highly personalized campaigns at scale and prove revenue attribution down to the dollar." The Solution: A marketing automation powerhouse like Adobe Marketo Engage delivers the necessary power and granularity.

Marketo's strength is its raw power and flexibility. It offers some of the most advanced automation workflows, lead nurturing capabilities, and revenue attribution models you can find.

  • HubSpot vs. Marketo: While both platforms automate, HubSpot is generally more user-friendly and built for the entire customer lifecycle. Marketo offers deeper, more complex automation and analytics capabilities, making it the preferred choice for data-driven enterprises with dedicated marketing ops teams who can leverage its full potential.
  • Actionable Use Case: Use Marketo to build a multi-path nurturing campaign. If a user from a Fortune 500 company downloads a whitepaper, route them to an enterprise sales rep and a specific email track. If a user from a small business does the same, route them to a self-service demo track. This level of granular control is where Marketo shines.

Choosing the right tool is a strategic call. For a detailed look at how different platforms compare for specific jobs, our MarketBetter vs. Sendspark comparison gives a focused analysis that can help bring your needs into focus.

Software Comparison for Different Business Needs

To make the choice even clearer, here's a quick breakdown of how these platforms stack up against each other based on what you're trying to accomplish.

SoftwareBest ForKey StrengthPricing Model
Monday.comProject & Task ManagementVisual workflow customizationPer-user subscription
AsanaComplex Project CollaborationTask dependencies & timelinesPer-user subscription
HubSpotAll-in-One GrowthIntegrated CRM & marketing suiteTiered, based on contacts/features
MarketoEnterprise AutomationAdvanced automation & analyticsCustom, based on database size

Ultimately, the best platform is the one that solves your most pressing problem today while giving you room to grow tomorrow.

The market for these tools is heating up for a reason. The global campaign management system market is expected to jump from USD 5.50 billion in 2025 to USD 10.86 billion by 2032, which is a compound annual growth rate of 10.2%. You can dive into the numbers in this insightful industry report. This trend shows just how critical it's become for businesses to get their campaigns organized on a central platform if they want to stay in the game.

How to Pick the Right Software for Your Team

Choosing the right marketing campaign management software can feel like you're staring at a wall of TVs, each one shouting different promises. Every vendor claims their tool will change the game, but here's the secret: the best tool is the one that solves your team's actual problems, not just the ones on a feature checklist.

The process doesn't start with demos. It starts with a hard look in the mirror. Before you even glance at a product page, you need to be brutally honest about your team's biggest headaches.

Actionable First Step: Get your team in a room for 30 minutes and ask one question: "What is the single most repetitive or frustrating task in our marketing process?" Write every answer on a whiteboard. The most common themes are your starting point for evaluating software.

First, Audit Your Current Tech Stack

No tool is an island. Your shiny new platform has to play nice with the software your team already lives in every day. So, the next critical step is to take inventory of what you're already using.

Make a simple list of every tool your marketing, sales, and customer service teams touch. That means your CRM, email platform, social media schedulers, analytics tools, and whatever project management system you're using to hold it all together.

For each one, ask these questions:

  • What does it actually do? Get specific about its main job.
  • Is it a "must-have" or a "nice-to-have"? Be honest. Which tools would cause a riot if they disappeared tomorrow?
  • How does it connect to other things? Does it have an open API? Does it offer pre-built integrations?

This audit gives you a blueprint for your integration needs. A powerful campaign platform that can't talk to your CRM is a complete non-starter. You're looking for a central hub, not another silo.

Involve Your Stakeholders Early On

Choosing software by committee can be a slog, but making the decision alone is a recipe for disaster. If you want people to actually use the tool you pick, you have to bring them into the process from the jump.

Get people from sales, creative, and even finance in the room (or on the Zoom). The sales team knows exactly what they need from marketing to help them close deals. Your creative team can tell you what they need to manage hundreds of assets without losing their minds.

By bringing other departments into the fold, you're not just picking a marketing tool; you're choosing a central growth engine for the whole company. It's a collaborative move that ensures the software solves problems across teams, which pays off big time in adoption rates later.

Ask the Right Questions During Demos

Alright, you've got your shortlist. Now it's demo time. This is your chance to slice through the polished sales pitch and see how the software holds up in the real world. Don't let the sales rep drive the whole time. Come armed with a list of sharp, specific questions based on your earlier pain-point audit.

Instead of asking a lazy question like, "Do you have analytics?" try this instead: "Show me exactly how your platform tracks ROI from a campaign running on Google Ads, LinkedIn, and email."

Here are a few other critical questions to have in your back pocket:

  1. On Workflows: "Can you walk me through building an automated workflow for a new lead who just downloaded an ebook? Show me every step."
  2. On Integrations: "Don't just tell me you integrate with Salesforce. Show me how the data syncs between the two platforms live."
  3. On Support: "What does your onboarding process actually look like for a team our size? What level of support is included, and what costs extra?"

This kind of direct, hands-on questioning forces vendors to prove their claims in the context of your challenges. It shifts you from being a passive viewer to an active evaluator, making sure you end up with a tool that doesn't just look good on paper but truly helps your team win.

Implementing Your New Software for Maximum Impact

Alright, you've picked your new marketing campaign management software. That's a huge step. But the real work? It starts now. The success of this whole thing doesn't ride on the feature list-it hinges on how well you weave the tool into your team's daily rhythm. A sloppy rollout turns a powerful platform into just another ignored login.

The goal isn't to add another chore to everyone's plate. It's to make the software an indispensable part of their job. That takes a thoughtful plan, one focused on getting people on board smoothly and proving the tool's value from day one.

Start with a Pilot Team and Phased Rollout

Going for a big-bang, company-wide launch is a recipe for chaos. Don't do it. Start small with a hand-picked pilot team instead. This could be a single campaign squad or a mix of marketers from different functions who are generally good with tech and open to change.

Think of it as a controlled experiment. This small group can stress-test workflows, find weird bugs, and give you honest feedback in a low-stakes environment. Their experience is gold-you'll use it to polish your training materials and create a solid process before you roll it out to everyone else.

A phased rollout is just as important for your data. Instead of a massive, one-time data dump, moving things over gradually lets you:

  • Clean As You Go: Find and ditch outdated contacts or duplicate assets before they clutter up your shiny new system.
  • Test Connections: Make sure integrations with your CRM and other critical tools are working perfectly without putting your entire database at risk.
  • Minimize Disruption: Keep the day-to-day operations running smoothly while you methodically bring your information across.

Build Standardized Templates from Day One

One of the biggest wins you'll get from this software is consistency. Don't wait to figure out best practices later-build them directly into the platform from the very beginning with standardized campaign templates.

Think of these templates as pre-built playbooks for your most common marketing moves. A product launch template might include tasks for blog posts, email announcements, a social media schedule, and ad creation. A webinar template could have pre-set timelines for promo emails and follow-ups.

Standardizing your campaigns with templates does more than save time. It creates a unified process that ensures no critical step is ever missed, regardless of who is running the campaign.

Actionable Step: Your first template should be for your most frequent campaign type. If you run monthly webinars, build that template first. This guarantees an immediate win and demonstrates the value of standardization to the entire team. You can learn more about how to systemize your processes and never miss a follow-up again.

Focus on Adoption by Demonstrating Value

The single biggest hurdle to any new tool is user resistance. To get past it, you have to show each person on your team how the software makes their specific job easier. Frame the entire training around solving their personal pain points.

  • For the Content Writer: Show them how the central asset library means they'll never have to hunt through messy folders for the latest logo again.
  • For the Social Media Manager: Demonstrate how the scheduler lets them knock out a week's worth of posts in an hour, freeing them up for more creative work.
  • For the Marketing Leader: Walk them through the automated dashboard that proves campaign ROI without spending hours wrestling with spreadsheets.

This user-first approach changes the conversation. The tool stops being a mandate from management and starts being a genuine benefit. This is critical in a market that's blowing up. The marketing campaign management software market size was valued at USD 5.3 billion in 2024 and is expected to hit USD 12.3 billion by 2033. This growth shows just how much teams need tools that can tame complex, multi-channel marketing-a key selling point for your team. You can dive deeper by checking out the full market growth report.

By focusing on these practical steps-a pilot launch, smart templates, and value-driven training-you'll ensure your new software becomes the growth engine it was meant to be.

A Few Common Questions

Jumping into the world of marketing campaign software can feel like a big step. It's a decision that touches your team's day-to-day work, your budget, and ultimately, your results. We get it. Here are some of the most common questions we hear, answered straight up.

Wait, Isn't This Just a CRM?

It's an easy mistake to make. Both handle customer data, but they have completely different jobs. A simple comparison: a CRM is a database, while a campaign management platform is an action engine.

  • A Customer Relationship Management (CRM) platform is your system of record. It's a digital filing cabinet answering the question, "Who is this person and what's our entire history with them?"
  • Marketing campaign management software, on the other hand, is a system of action. It uses CRM data to answer the question, "How do we talk to this specific group of people, right now, to get them to do something?"

The two are a power couple:

  • The CRM knows a lead is in the "consideration" stage and has clicked on three pricing-page emails.
  • The campaign software uses that info to automatically send them a case study and show them a targeted social media ad.

Can a Small Business Actually Afford This?

This is the big one, isn't it? The short answer: yes, absolutely. The old idea that this kind of software is only for massive companies with eye-watering budgets is dead. The market is full of scalable, surprisingly affordable options built for businesses on the way up.

Most of the best platforms use tiered pricing. You can start with a basic plan that covers the essentials and add more firepower as your company grows. Some even have generous free plans to get you off the ground.

Here's the mental shift you have to make: this software isn't a cost. It's an investment. A good platform pays for itself by automating tasks that used to eat up dozens of hours a month and by fine-tuning campaigns to bring in more revenue.

Actionable Tip: Calculate the hourly rate of your marketing team members. Then, estimate how many hours per month are spent on repetitive tasks like reporting or manual posting. Compare that "cost of inefficiency" to the price of the software to see the potential ROI.

What Are the Most Important Metrics to Track?

You can't prove marketing is working if you aren't measuring the right things. Every platform will throw a sea of data at you, but if you want a clear picture of success, you have to ignore the noise. Forget vanity metrics like "likes" and focus on the numbers that connect directly to business goals.

Your campaign software absolutely must help you track these three heavy hitters:

  1. Customer Acquisition Cost (CAC): This is the bottom line on what it costs you-in both marketing and sales effort-to land one new customer. The goal is simple: get this number as low as you can. A great first step is comparing the CAC from different channels. Is Google Ads cheaper than LinkedIn? Now you know where to double down.

  2. Return on Marketing Investment (ROMI): This is the ultimate proof. It calculates the revenue your campaigns generated divided by what you spent to run them. Anything over 1.0 means you're making money. If you spend $1,000 on a campaign that brings in $5,000 in new business, your ROMI is a beautiful 5.0.

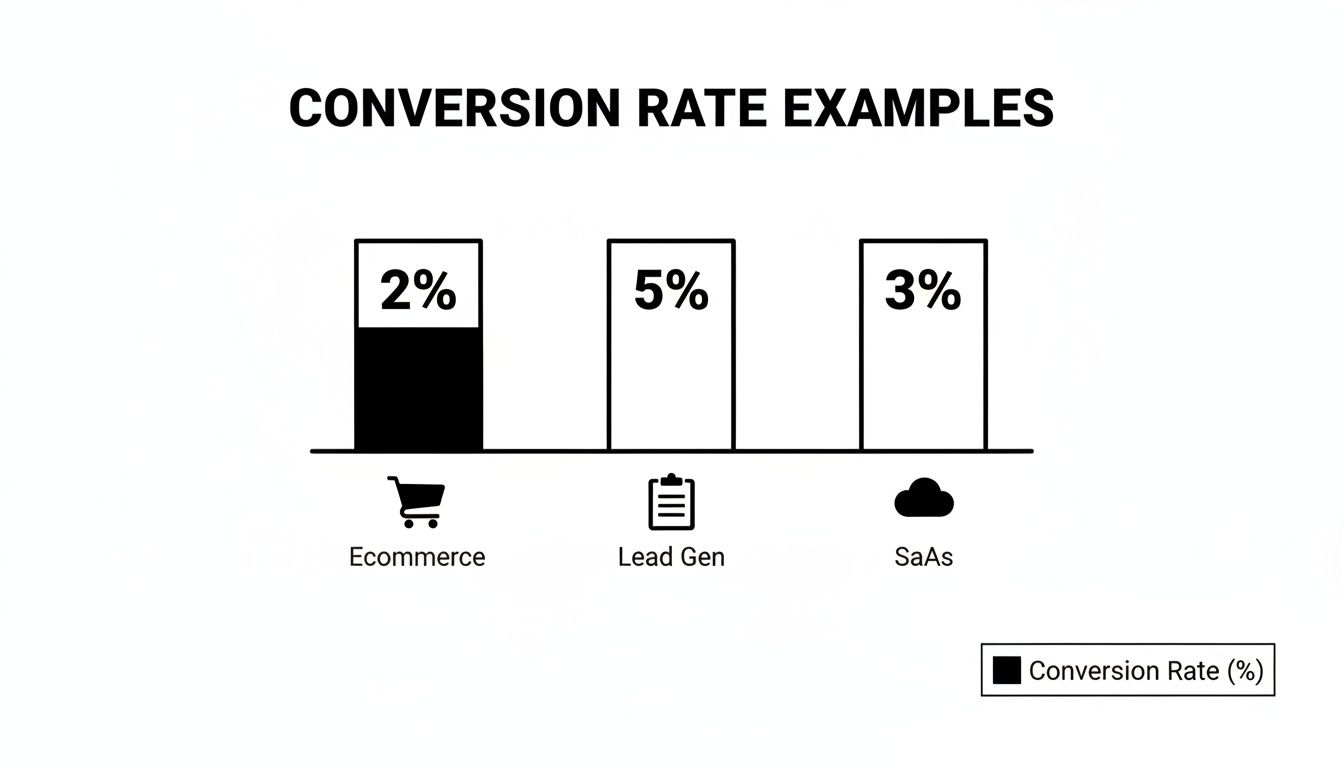
  3. Lead-to-Customer Conversion Rate: This metric tells you what percentage of your leads are actually becoming paying customers. A low number here is a huge red flag. It often points to a disconnect between what marketing is promising and what sales is delivering, giving you a crystal-clear problem to solve.

Nailing these core metrics is how you turn your marketing department from a cost center into a predictable revenue engine.


Ready to bring clarity, efficiency, and powerful AI to your marketing efforts? marketbetter.ai integrates content creation, campaign management, and customer engagement into a single, intelligent platform. Stop juggling disconnected tools and start driving measurable results. Discover how marketbetter.ai can transform your campaigns today.