B2B Customer Journey Mapping: A Practical, Actionable Guide
A B2B customer journey map is your attempt to visualize every single interaction a business customer has with your company. Think of it as a strategic roadmap, charting the course from that first flicker of awareness all the way through to post-purchase loyalty. An effective map pinpoints the key touchpoints, decision-makers, and pain points so you can get marketing, sales, and service singing from the same hymn sheet.
Why Most B2B Journey Maps Fail to Deliver
Let’s be honest. A lot of B2B customer journey maps are just pretty documents. They look great in a quarterly meeting, get pinned to a Miro board, and then... nothing. They gather digital dust. The core problem? Teams treat mapping as a one-and-done project instead of a dynamic, actionable playbook.
This static approach fundamentally misunderstands the B2B buying process. It's not a straight line like buying a pair of sneakers; it's a messy, cyclical process involving multiple stakeholders, ridiculously long evaluation cycles, and a tangled web of interactions. A simple, linear diagram can't capture that reality.
Worse yet, many teams just copy-paste B2C mapping techniques. Compare the two: a B2C map might follow one person buying one thing. A B2B map, however, must account for an entire buying committee—from the engineer who will use the product to the CFO signing the check—and each of them has different goals and headaches. You can get a better handle on these groups by exploring different customer segmentation strategies.
The Digital Shift Changes Everything
The way businesses buy has fundamentally changed. Gartner’s research shows that by 2025, a whopping 80% of B2B sales interactions will happen on digital channels. The days of relying solely on face-to-face meetings are over. Today's buyers expect smart, personalized experiences everywhere they look. For more on this, check out the B2B digital transformation insights on linkgraph.com.
This digital-first world makes static maps obsolete the second you finish them. To be effective, a B2B journey map has to be a living, breathing tool. It needs to be plugged into your CRM, marketing automation, and analytics, evolving right alongside your customers.
The infographic below really drives home what happens when you move from a static diagram to a dynamic, actionable map.
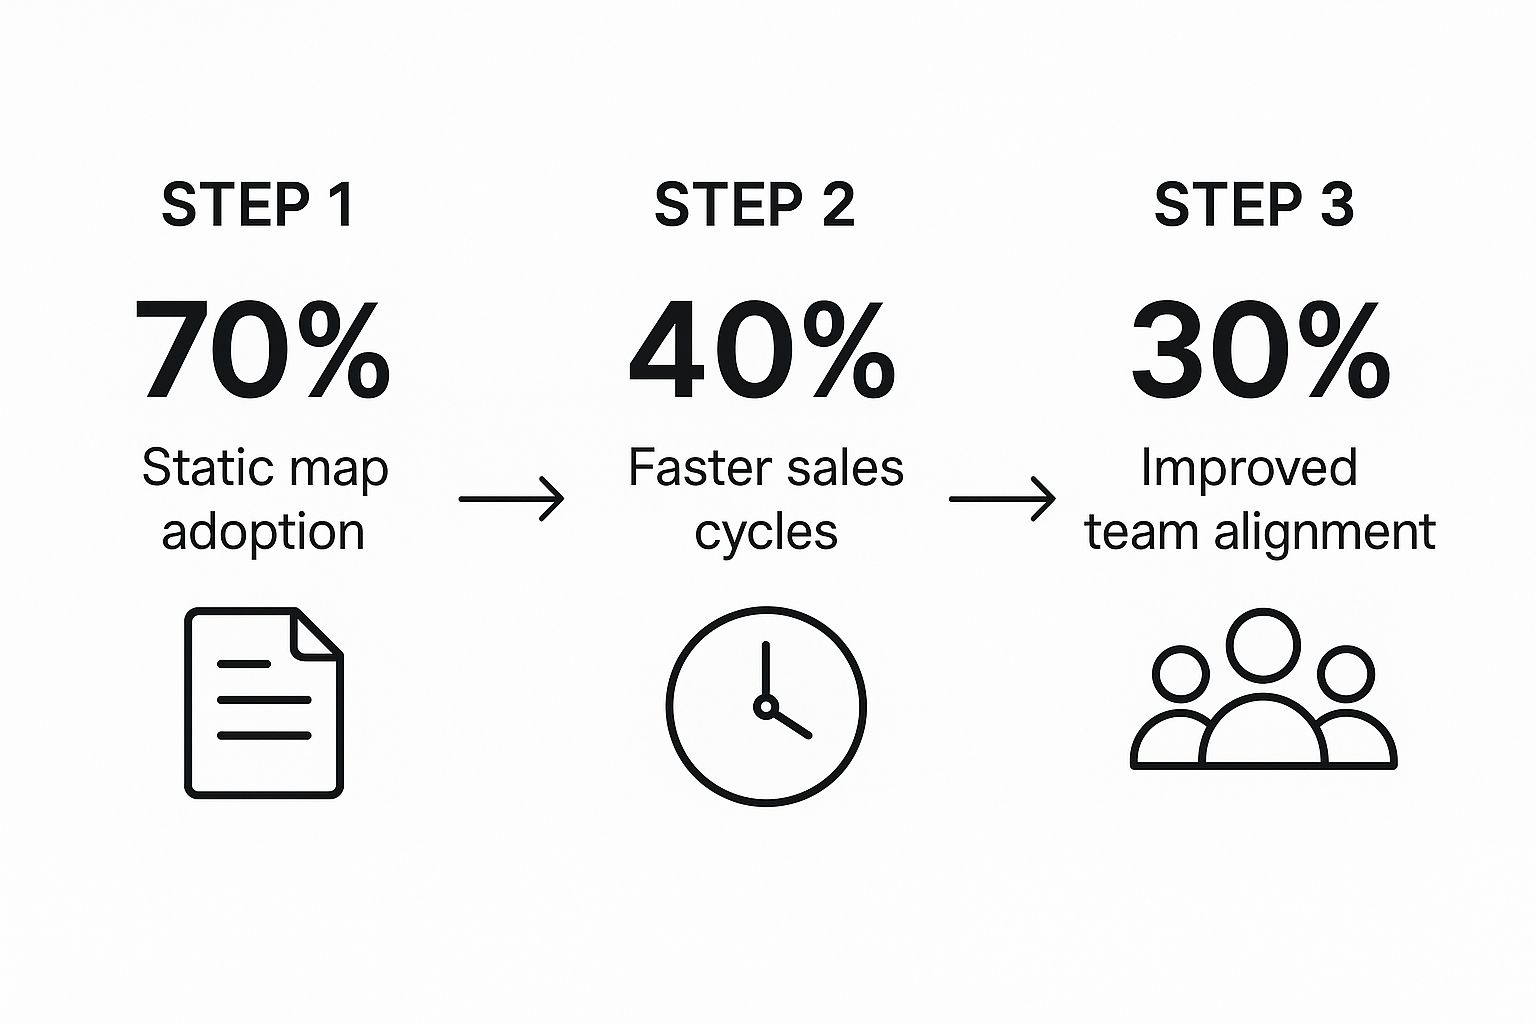
As you can see, making that shift isn't just a theoretical exercise—it leads to faster sales cycles and gets everyone on the same page.
From Theoretical Diagram to Revenue Driver
The difference between a map that works and one that doesn't comes down to one word: action. An actionable map doesn't just sit there. It forces conversations and guides your strategy.
A successful journey map is not a deliverable; it’s a decision-making tool. It should provoke questions, challenge assumptions, and guide your marketing, sales, and customer success teams toward a unified goal.
Let’s quickly compare the old way versus the right way.
Outdated vs Actionable B2B Journey Maps
Too many maps are built on guesswork and end up in a forgotten folder. A modern, actionable map is a living tool powered by real data that your entire revenue team can use to spot and fix friction.
| Characteristic | Outdated Approach | Actionable Approach |
|---|---|---|
| Format | Static PDF or slide deck | Dynamic, cloud-based platform |
| Data Source | Internal assumptions, workshops | Real-time customer data (CRM, analytics) |
| Team Focus | Siloed (e.g., marketing-only) | Cross-functional (sales, marketing, success) |
| Primary Goal | Create a "finished" document | Identify and fix friction points continuously |
When you stop treating journey mapping as a box-checking exercise and start seeing it as a dynamic, collaborative tool, it transforms. It goes from a theoretical project to a powerful engine for driving real revenue and keeping customers happy.
Building Your B2B Journey Map From Scratch

Alright, enough with the theory. This is where the real work of B2B customer journey mapping kicks in. Building a map that actually works isn't some abstract whiteboard session; it’s a hands-on process to create a visual playbook your entire company—from sales and marketing right through to customer success—can rally around.
First thing to accept: the B2B buying process is messy. Forget the idea of a neat, linear path. It’s cyclical, confusing, and dragged out by multiple people with competing agendas. Your map has to reflect that chaos to be of any real use.
It all starts with a crystal-clear business goal and a genuine understanding of the people you’re trying to help.
First Things First: What’s the Point?
Before you touch a single sticky note, you have to answer one simple question: Why are we even doing this? Without a clear objective, your journey map will be a fuzzy, aimless document that gathers digital dust. A map designed to shorten a bloated sales cycle looks completely different from one built to stop new customers from churning.
Compare these two very different goals:
- Goal A: Shrink the Sales Cycle. Here, your map becomes a magnifying glass for friction. You'll hunt for bottlenecks in the consideration phase, pinpoint where decision-makers get stuck, and scrutinize every single interaction from the demo request to the final signature. Your action item might be to create a "competitor comparison" one-pager for champions.
- Goal B: Drive Product Adoption After the Sale. This map stretches far beyond the "buy" button. It’s all about the first 90 days—the onboarding experience, initial logins, support tickets, and training webinars. The whole point is to find opportunities to deliver value faster. Your action item could be to launch a targeted email nurture sequence for new users.
Tying your map to a specific, measurable outcome is non-negotiable. It’s what keeps this from becoming just another pretty diagram.
You’re Selling to a Committee, Not a Person
This is one of the biggest traps in B2B mapping: focusing on a single buyer persona. B2B deals are almost never made by one individual. You’re selling to a buying committee, a quirky cast of characters who each have their own worries, motivations, and definitions of "success."
For a typical mid-market software purchase, that committee probably looks something like this:
| Stakeholder Role | Their Big Question | Actionable Content to Create for Them |
|---|---|---|
| The End User (e.g., Marketing Manager) | "Is this going to make my day-to-day job less painful?" | Simple tutorials, interactive product tours, and no-nonsense quick-start guides. |
| The IT Specialist (e.g., Security Lead) | "Is this secure? Will it break our existing tech stack?" | Hardcore technical docs, security compliance reports, and clear integration guides. |
| The Economic Buyer (e.g., CFO/VP Finance) | "What's the real ROI here, and what's the total cost?" | Transparent pricing, case studies with hard numbers, and a solid business case. |
| The Champion (e.g., Director of Marketing) | "How do I convince my boss to sign off on this?" | Shareable slides, competitor smackdowns, and a compelling executive summary. |
Your journey map has to chart the parallel—and often conflicting—journeys of every single one of these people. The IT lead could be buried in your API documentation at the exact same moment the CFO is scrutinizing your pricing page. Both are critical touchpoints, and they’re happening at the same time.
A truly effective B2B journey map doesn't just track a company logo. It tracks the individuals inside that company as they stumble toward a collective "yes." Nail these micro-journeys, and you'll win the deal.
This multi-threaded view is what gives you the full picture, not just one narrow slice of it.
Map Every Single Touchpoint—Even the Small Ones
With your goal set and your committee profiled, it's time to map out every single interaction a potential customer has with your brand. And I mean every interaction. A touchpoint isn’t just a visit to your homepage; it’s any moment of engagement, big or small.
Start by brainstorming all the possibilities, then group them into the classic journey stages.
1. Awareness Stage Touchpoints
This is where it all begins. A prospect realizes they have a problem and starts poking around for answers. Your job is to be the most helpful resource they find.
- Content: They stumble upon a blog post you wrote about a common industry headache.
- Social Media: A targeted LinkedIn ad catches their eye, or they see a smart post from someone on your team.
- Events: They sign up for a webinar you’re hosting on a relevant topic.
- Third-Party Sites: They see your name pop up on a review site like G2 or Capterra.
2. Consideration Stage Touchpoints
Okay, now they’re serious. The committee is actively vetting solutions, comparing features, and trying to figure out who to trust.
- Website: They’re playing with your pricing calculator or digging into a product comparison page.
- Sales: The first discovery call happens, or they sit through a personalized demo.
- Product: They sign up for a free trial or click through an interactive demo.
- Proof: They download a case study that speaks directly to their industry’s challenges.
3. Decision Stage Touchpoints
We’re in the home stretch. The committee is trying to build internal consensus and de-risk the purchase. The focus shifts from "what it does" to "how we justify it."
- Paperwork: They’re reviewing your formal proposal and negotiating the contract terms.
- Security: Your team is fielding questions for a security and compliance review.
- References: They’re on the phone with one of your happy customers.
- Kickoff: They have their first onboarding call with your customer success team to plan the rollout.
Plotting these touchpoints visually is what makes the journey tangible. You can literally see how different people engage with you at different times. It also shows you where all your data is coming from—each touchpoint is a source of truth. To get more out of that data, it helps to centralize it. You can learn more about pulling it all together with a customer data platform integration. When you connect these dots, the map starts to tell a real story about the path your customers actually take.
Gathering Data That Reveals the Real Story

A journey map built on assumptions is just a pretty diagram. It’s a work of fiction. To create a tool that actually drives decisions, you need to ground it in real data that shows what your buyers are truly thinking, feeling, and doing. The goal isn't just to collect data, but to gather the right data—a mix of hard numbers and human stories.
This means you have to break down the walls between your data silos. Too often, the goldmine of insights in a CRM is completely disconnected from the behavioral trends in web analytics. When you bring these together, you move from a fragmented view to a unified picture of your buyer's actual path.
It’s not easy, especially as B2B interactions get more complex. While 63% of decision-makers see the growing importance of customer experience, a staggering 88% admit they don’t have the resources or know-how to actually improve their digital journeys. You can discover additional insights into B2B journey tracking to see just how wide that gap is. A data-driven mapping process is exactly what closes it.
Combining Quantitative and Qualitative Insights
The best journey maps are built on two types of data: quantitative (the "what") and qualitative (the "why"). If you only have one, you only have half the story.
Compare the two: a purely quantitative map might show a high drop-off rate on your pricing page, but it can't tell you why people are leaving. A purely qualitative map might be full of compelling anecdotes, but you won't know if those problems are widespread or just one-offs.
The real magic happens when you let these two data types inform each other.
| Data Type | What It Tells You | Actionable Source |
|---|---|---|
| Quantitative Data | What customers are doing at scale. | Check Google Analytics, CRM reports, marketing automation logs, and heatmaps. |
| Qualitative Data | Why customers are doing it—their motivations, feelings, and frustrations. | Conduct customer interviews, poll the sales team, analyze support tickets, and send surveys. |
For example, your Google Analytics might show that prospects from the finance industry spend an average of only 30 seconds on a key feature page (the what). That's an interesting but incomplete fact.
But after interviewing a few of them, you might discover they found the technical jargon confusing and couldn't see how it applied to their compliance needs (the why). That combined insight is what you can actually act on. Your action item: rewrite the page copy to directly address finance compliance.
Uncovering the "Why" with Human Intelligence
While analytics platforms are essential, some of the most valuable data you'll get for a B2B journey map comes from talking to actual people. Your teams on the front lines—and your customers themselves—hold the keys to the emotional and rational drivers behind every decision.
Here are actionable steps to tap into that human intelligence:
- Interview Your Sales Team: Your reps live and breathe customer objections. Ask them: "At what point in the deal do prospects get confused?" or "What's the one piece of content that champions always ask for to convince their boss?" They know exactly where deals stall and why.
- Talk to Customer Support: Support agents are a goldmine for post-purchase pain points. Dig through support ticket logs and look for recurring issues during onboarding or implementation. These are the friction points that lead directly to churn.
- Speak Directly with Customers: This is non-negotiable. You have to talk to them. Interview new customers who just went through the buying process and, if you can, those who chose a competitor. Ask open-ended questions like, "Walk me through the moment you realized you needed a solution like ours," to uncover their initial triggers.
Capturing direct customer feedback isn't just about collecting quotes; it's about understanding their world. By actively listening, you can build a map that reflects their reality, not just your company's internal process.
These conversations provide the rich, nuanced context that raw numbers simply can't. You can find excellent guidance on structuring these discussions by exploring some real-world Voice of the Customer examples. It’s how you ensure your map is built on a foundation of genuine empathy.
Choosing the Right Journey Mapping Tools

Alright, you've set your goals and done the hard work of gathering data. Now for the fun part: picking the right tech to bring your B2B customer journey mapping to life. This is a critical decision. The right software turns your map from a static diagram that's outdated the second you finish it into a living, breathing tool that actually helps you make better decisions.
The market for these tools is packed, but they really boil down to three main types. Each one serves a different purpose, and the best fit for you will come down to your team's size, budget, and just how complex your sales cycle really is.
Collaborative Whiteboards: Flexible and Visual
First up are the digital whiteboards. Think of platforms like Miro or Mural. These are essentially giant, endless canvases where your team can get together, throw virtual sticky notes around, and sketch out the customer journey from the ground up.
Their biggest selling point is pure flexibility. You're not boxed in by rigid templates, which makes them absolutely perfect for those initial workshops and brainstorming sessions when you're still just trying to figure out the basic stages and touchpoints. They're built for real-time, cross-functional teamwork.
But that strength can also be a weakness. Compare this to a data-driven tool: these maps are built by hand. They won't automatically suck in live data from your CRM or analytics tools. That means they're just a snapshot in time and need constant manual updates to stay useful.
- Best For: Teams who are brand new to journey mapping, running initial discovery workshops, or just need to visualize a high-level flow.
- Key Challenge: The lack of direct data integration means maps can get stale fast if you're not disciplined about keeping them updated.
Dedicated Journey Mapping Platforms: Structured and Insightful
Next, you have dedicated journey mapping platforms like Smaply or TheyDo. These tools are purpose-built for one thing: creating, managing, and analyzing customer journeys in a structured way. They come with templates and frameworks designed specifically for mapping out touchpoints, customer emotions, pain points, and opportunities.
Compared to a free-for-all whiteboard, these platforms enforce a more disciplined process. They often have features for building out detailed personas, tying specific journeys to business goals, and pinpointing those crucial "moments of truth." Many can even pull in qualitative feedback from surveys or support tickets, which adds a layer of real-world proof to your map.
The tradeoff? A steeper learning curve and a higher price tag. These are specialist tools for teams who are serious about making journey mapping a core business function. It's less about freeform brainstorming and more about building a systematic, scalable library of customer insights.
A dedicated mapping platform transforms your journey map from a simple picture into a structured database of customer experience insights. It's the right move when you're ready to make this a core, ongoing business process.
All-in-One Analytics and CRM Suites: Data-Rich and Action-Oriented
Finally, we have the all-in-one giants like HubSpot or Salesforce Marketing Cloud. While they aren't just journey mapping tools, their real power comes from tracking and visualizing the journey using actual, live customer data. These systems automatically log every touchpoint—email opens, website visits, content downloads, and sales calls.
This gives you a journey map that is inherently data-driven and always current. You get to see the real paths customers are taking, not just the ones you sketched out in a meeting. The huge benefit here is the direct line from insight to action; you can trigger automated marketing campaigns or sales tasks right from what you learn in the journey.
The main limitation is that these platforms are much better at telling you the "what" (the quantitative data) than the "why" (the qualitative insight). They’ll show you a prospect fell off the map, but they won’t capture the frustration or confusion that caused it. To get the full picture, you almost always have to pair this data with qualitative feedback you've gathered elsewhere.
Making the Right Choice: A Comparative Look
Choosing your tool isn't about finding the "best" one on the market. It's about finding the one that fits what you need right now and where you want to go. A small startup might kick things off with a collaborative whiteboard to get the whole team on the same page, while a big enterprise might need an all-in-one suite to wrangle its complex, multichannel customer interactions.
To make it easier, here's a quick overview of how the different software categories stack up.
Comparison of B2B Journey Mapping Tool Types
| Tool Type | Best For | Key Features | Example Platforms |
|---|---|---|---|
| Collaborative Whiteboards | Initial workshops, creative brainstorming, and high-level flow design. | Infinite canvas, real-time collaboration, drag-and-drop templates. | Miro, Mural |
| Dedicated Mapping Platforms | Creating structured, detailed, and scalable journey repositories. | Persona builders, structured templates, insight management, basic integrations. | Smaply, TheyDo |
| All-in-One Analytics & CRM Suites | Building dynamic, data-driven maps tied directly to marketing and sales execution. | Deep CRM integration, real-time behavioral tracking, marketing automation triggers. | HubSpot, Salesforce |
At the end of the day, the tool should serve your strategy, not the other way around. Figure out exactly what you want to accomplish first, and then pick the software that will help you see, understand, and act on your B2B customer journey most effectively.
Turning Your Map Into Measurable Results
So you've built your B2B customer journey map. Nice work. But let’s be honest: a map that just hangs on a wall or gets buried in a Google Drive folder is a waste of everyone's time.
The real value isn't in the diagram itself. It's in using that diagram to drive strategic actions that show up in your P&L. A map that guides your daily decisions is a revenue engine. Now it's time to translate those insights into impact.
Finding the Friction Points and Content Gaps
Think of your journey map as a diagnostic tool. Its main job is to show you where the buying process grinds to a halt or breaks down completely. You're not just looking at the touchpoints; you're hunting for the painful, momentum-killing gaps between them.
Maybe your map shows the technical evaluator downloading a whitepaper (a marketing win!) but then waiting a full week before sales ever reaches out. That gap is pure friction. Why the delay? Was the handoff process broken? Did the whitepaper fail to inspire any real urgency?
This is where you have to compare the ideal versus the real journey:
- Ideal Journey: The evaluator reads the paper, is blown away by its technical depth, and immediately clicks the embedded link to request a demo.
- Actual Journey: The evaluator reads the paper, has a few unanswered questions, gets pulled into another project, and the initial spark is gone.
The most powerful insights from a journey map don't come from tracking successful touchpoints, but from identifying and quantifying the moments of friction. Each one is a golden opportunity to improve the buyer experience and shorten the sales cycle.
Your analysis will also shine a light on glaring content gaps. Does your map show the CFO stepping in at the decision stage, yet you have zero content that speaks their language—ROI, total cost of ownership, financial risk? That’s a content gap your map just handed you on a silver platter. Your action item: create a downloadable ROI calculator and a case study focused on financial outcomes.
Connecting Your Actions to Business Outcomes
Once you’ve pinpointed the friction and the gaps, the next move is to develop concrete actions and tie them to specific business metrics. This is what separates a fuzzy academic exercise from a revenue-driving strategy. Without that connection, your efforts are just guesswork.
Let’s compare a vague observation with a sharp, metric-driven initiative.
| Vague Observation | Actionable Initiative |
|---|---|
| "Our onboarding process seems confusing for new customers." | "Implement an interactive, in-app product tour during the first 7 days to reduce support tickets by 20% and improve our 30-day user retention rate." |
| "Sales and marketing aren't aligned on lead quality." | "Redefine the MQL-to-SQL handoff criteria based on journey map insights (e.g., prospects who view the pricing page twice) to increase the SQL conversion rate by 15%." |
See the difference? Each action is specific, measurable, and hooks directly into a real business outcome like customer retention or conversion rate. This is how you turn your map from a picture of the past into a concrete plan for the future.
Unlocking Personalization and Attributing Revenue
A detailed journey map is a goldmine for personalization that actually works. When you understand the distinct paths different members of the buying committee take, you can stop blasting generic messages and start delivering tailored content at the perfect moment.
The IT manager gets a security-focused email. The finance lead sees an ad about proven ROI.
This level of precision has a direct and measurable impact on revenue. We’ve seen it firsthand: a precisely targeted LinkedIn ad campaign, informed by journey insights, influenced 35% of new business deals and delivered a 113% Return On Ad Spend (ROAS). Compare that to a less-targeted campaign on another platform, which contributed to just 2% of deals with a pathetic 29% ROAS.
That massive difference shows why connecting detailed journey mapping directly to revenue attribution is non-negotiable. You can dig into more data on how B2B customer journeys directly influence revenue on dreamdata.io. Understanding the journey isn't just about making buyers happy—it's about making smarter investments that generate real returns.
Your map should be the guide for these big strategic decisions. Use it to answer the tough questions:
- Which channels are actually reaching our economic buyers?
- What content is most influential during the technical evaluation phase?
- Where should our sales team jump in for maximum impact?
When you let the map guide everything from ad spend to sales outreach, you create a cohesive and brutally effective buying experience. This is how your B2B customer journey mapping effort becomes a powerful, measurable driver of business growth, directly impacting conversion rates, sales cycle length, and ultimately, customer lifetime value.
Try our Lookalike Company Finder — find companies similar to your best customers in seconds. No signup required.
Common Questions We Hear About B2B Journey Mapping
Even with the best plan in hand, you're going to hit a few roadblocks when building out your first B2B journey map. It’s totally normal. Getting the answers right is what separates a map that actually drives your strategy from one that just ends up as a pretty PDF in a forgotten folder.
Here are a few of the most common questions that pop up and how we've learned to tackle them.
How Often Should I Update My Journey Map?
Think of your journey map less like a framed picture and more like a live dashboard. It's a snapshot in time, and time moves on. Markets shift, your product gets new features, and your buyers' expectations are always climbing. A map from six months ago might already be dangerously out of date.
Here's an actionable schedule:
- Quarterly: Conduct a major review and refresh of the entire map.
- Immediately: Revisit the map when a significant event occurs, like a major product launch, entering a new market, or a competitor's big move. This keeps it relevant and, more importantly, actionable.
What’s the Single Biggest Mistake to Avoid?
Easy. Building the map based entirely on internal assumptions.
I’ve seen it happen a dozen times: a team gets together in a conference room, grabs a whiteboard, and starts guessing what the customer journey looks like. What they end up with isn't a customer journey map at all—it's a map of their own internal sales process. It reflects how they want to sell, not how their customers actually buy.
The fix is simple but non-negotiable: ground every single touchpoint and pain point in real data. Use your CRM and analytics for quantitative insights, but the real gold comes from qualitative feedback from actual customer interviews. A map built on evidence is a tool; a map built on guesswork is just a fantasy.
How Do I Map for Multiple Buyer Personas?
This one trips people up all the time, especially in B2B where you're selling to a buying committee of five different people. Trying to cram the CFO, the IT Lead, and the end-user all onto one giant, chaotic map is a recipe for disaster. It becomes useless to everyone.
Here’s a much cleaner, actionable approach.
- Create a Foundational Master Journey: Start by outlining the core stages everyone goes through (Awareness, Consideration, etc.). This is your skeleton.
- Use Persona "Swimlanes": For each key persona, create a separate horizontal lane on the map. This lets you clearly see how the IT Lead's journey overlaps with the main path and, crucially, where it diverges.
- Pinpoint Unique Needs: In each swimlane, document the unique pain points, questions, and decision criteria for that persona at each stage. This gives you the clarity you need to engage each stakeholder effectively.
Ready to move beyond static diagrams and build a dynamic, data-driven journey map that drives real results? marketbetter.ai integrates your customer data, content creation, and campaign analytics into one AI-powered platform, giving you a live view of your B2B customer journey. Optimize every touchpoint with marketbetter.ai.