
What Is a Cohort Analysis A Guide to Unlocking User Behavior

· 26 min read

Let’s start with a simple truth: looking at your overall metrics is like trying to read a blurry photograph. Sure, you can see the general shape of things—maybe user numbers are up, maybe revenue is steady—but all the important details are lost in the noise. You get the big picture, but you miss the story.

This is where your top-line numbers can trick you. A big spike in sign-ups from a new ad campaign might look great, but if those users churn out in a week, your "growth" is just a mirage. The average hides the reality. This is the core problem that cohort analysis solves: it moves you from seeing what happened to understanding why it happened.

Going Beyond Averages: What Is a Cohort Analysis?

A woman writes 'BEYOND AVERAGES' on a whiteboard during a business meeting, with a Kanban board visible.

Cohort analysis is how you bring that blurry picture into focus. Instead of lumping every single user into one giant, anonymous bucket, you group them into smaller, related teams—or cohorts.

Think of it this way: aggregate data is the final score of a basketball game. It tells you who won, but not how they won. Did the starting lineup dominate the first quarter? Did the bench players seal the deal in the fourth? Cohort analysis is the play-by-play, showing you how different groups performed over time.

A cohort is simply a group of users who share a common characteristic. Most often, it’s an acquisition cohort, meaning everyone who signed up in the same week or month. By tracking each cohort as a distinct group, you can finally see how their behavior evolves. You stop looking at averages and start understanding actual user journeys.

Why Aggregate Data Fails Marketers

Relying on big, top-level numbers creates a false sense of security while your business might be slowly leaking its best customers. That sudden rush of low-quality users from a new campaign can easily mask the fact that your loyal, long-term users are quietly slipping away.

Cohort analysis gives you the context that aggregate data completely misses. It tells you who is sticking around, who is leaving, and—most importantly—why. It lets you plug the leaks instead of just celebrating the inflow.

To see the difference in action, let's compare the two views side-by-side.

Aggregate Data vs. Cohort Analysis: A Quick Comparison

This table breaks down how each approach answers (or fails to answer) critical marketing questions. The difference isn't just in the data; it's in the actionability of the insight.

Metric FocusAggregate Data View (The Blurry Picture)Cohort Analysis View (The Clear Story & Actionable Step)
User Retention"Our overall retention rate is 30%.""The January cohort retained at 45%, but the February cohort only retained at 20% after we changed the onboarding flow. Action: We need to investigate and potentially roll back the February onboarding changes."
User Value"The average LTV per user is $150.""Users from our organic search campaign have an LTV of $250, while users from social ads have an LTV of only $75. Action: Shift ad budget from social to SEO and content marketing to acquire more valuable users."
Campaign ROI"Our latest campaign brought in 5,000 new users.""The 5,000 users from our spring campaign are churning twice as fast as the users we acquired in the winter. Action: Analyze the spring campaign's messaging and targeting to understand why it's attracting less-committed users."

See the difference? The cohort view doesn't just give you a number; it gives you a narrative with actionable insights.

This method really took off in the early 2010s, especially with SaaS and mobile app companies that needed a much deeper understanding of user loyalty. For instance, Dropbox used acquisition cohort analysis to prove their new referral program was working. They discovered the January 2012 cohort—users acquired via referrals—had a 40% retention rate after 30 days. That blew past the 25% rate from earlier cohorts, directly connecting their strategy to a 60% jump in active users. You can dig deeper into how cohort analysis drives growth strategies on Julius.ai.

How Cohort Analysis Delivers Actionable Insights

By breaking down your user base, you can finally get clear answers to the questions that keep you up at night:

  • Campaign Impact: Did the users we got from that big spring campaign stick around longer than the ones from our winter sale?
  • Onboarding Effectiveness: Are users who actually complete our new tutorial more engaged a month later than those who skip it?
  • Product Changes: After we launched that new feature, did the engagement of new users improve compared to the cohorts who signed up before the change?

Understanding the behavior of these distinct groups is the first, most critical step toward making smarter marketing decisions that actually move the needle.

Why Cohort Analysis Is Your Marketing Superpower

Aggregate data gives you the final score, but cohort analysis gives you the game-winning play. It’s the difference between knowing your user count went up and knowing which specific groups are driving that growth—and which are quietly walking out the back door.

This is what transforms marketing from a guessing game into a precise, strategic operation. It reveals the “why” behind your numbers.

Imagine you launch a flashy new onboarding flow. Your big-picture metrics show a huge spike in signups. Looks like a clear win, right? But a quick cohort analysis tells a different story: these new users are churning 40% faster after their first week than the users you acquired last month.

That single insight is the difference between celebrating a vanity metric and fixing a leaky bucket before it sinks your business. This is how you turn data into a superpower. You stop making broad assumptions and start asking the questions that actually move the needle.

Moving Beyond Vanity Metrics

One of the biggest traps in marketing is chasing numbers that look good on a chart but don’t translate to real value. A mountain of signups means nothing if those users never come back. Cohort analysis forces you to look past these surface-level wins.

It helps you compare the long-term behavior of different user groups, side-by-side. You can finally prove whether the expensive leads from that big trade show are actually more valuable over six months than the cheaper ones you got from a social media campaign.

Cohort analysis is your defense against misleading data. It ensures you're optimizing for sustainable growth and genuine user loyalty, not just temporary spikes in activity.

This focus on long-term value ties directly into one of the most important metrics for any business: customer lifetime value (LTV).

Calculating a More Accurate LTV to CAC Ratio

One of the most powerful things you can do with cohort analysis is refine your understanding of customer lifetime value. Instead of using a single, blended LTV for all your customers, you can calculate it for specific groups. This is where the magic happens.

Suddenly, you can see which user segments are your most profitable.

  • Channel-Based LTV: Discover that users from organic search have a 2x higher LTV than those from paid ads. The Actionable Step: Reallocate a portion of your paid ad budget to content marketing and SEO to attract more high-value customers.
  • Campaign-Based LTV: See if customers acquired during your Black Friday sale have a lower long-term value than those acquired through a content marketing push. The Actionable Step: Adjust your Black Friday messaging to attract customers who will stick around, not just bargain hunters.
  • Feature-Based LTV: Find out if users who adopt a specific feature within their first week stick around longer and spend more. The Actionable Step: Make that feature a centerpiece of your onboarding experience to drive adoption.

Armed with this level of detail, your LTV-to-CAC ratio becomes a much sharper tool. You can make smarter calls about where to invest your marketing dollars, zeroing in on the channels and campaigns that bring in the customers who will provide the most value over time. For a deeper dive, check out our guide on improving customer lifetime value.

Pinpointing Your "Aha!" Moments

Every product has an "aha!" moment—that point where a user truly gets its value and becomes likely to stick around for the long haul. Cohort analysis is the perfect tool for finding it.

By tracking behavioral cohorts, you can isolate the specific actions that correlate with high retention.

You might discover that users who invite three teammates in their first week have a 90% retention rate after one month, while those who don't are almost guaranteed to churn. That’s not just an interesting stat; it’s a roadmap for your entire onboarding strategy. Your new goal is crystal clear: get every new user to invite three teammates, fast. This is the definition of an actionable insight.

This ability to connect early user actions to long-term loyalty is what makes cohort analysis so indispensable. It helps you stop guessing what makes your product sticky and start building an experience that systematically creates loyal advocates. For marketers looking to quantify this, calculating customer lifetime value by cohort can connect these "aha" moments directly to revenue. When you know the drivers, you know where to focus.

Understanding the Building Blocks of Cohort Analysis

To get real value out of cohort analysis, you first need to know what you're looking at. Think of it like a recipe. You have your ingredients and you have your cooking instructions. Get them right, and you’ve got a masterpiece. Get them wrong, and you’ve just got a mess.

At its core, every cohort analysis boils down to answering two simple questions:

  1. How are we going to group these users together?
  2. What specific actions or outcomes are we going to track over time?

The answers define the cohorts you’ll build and the metrics you’ll watch. Let’s break that down.

Acquisition vs. Behavioral Cohorts

Your first big decision is how you'll group your users. This single choice shapes the entire story your data will tell. The two most common ways to slice it are by when a user joined or what a user did. Comparing these two approaches helps you decide which one answers your business question best.

Cohort TypeDefinitionBest for Answering...Actionable Example
Acquisition CohortsGrouping users by when they signed up (e.g., January 2024 cohort)."Is our overall product stickiness improving over time?"Compare the 3-month retention of the Q1 cohort vs. the Q2 cohort to see if recent product changes had a positive effect on loyalty.
Behavioral CohortsGrouping users by a specific action they took (e.g., used a coupon code, invited a teammate)."Which early actions lead to long-term retention?"Compare the LTV of users who did invite a teammate in week one vs. those who didn't. If it's higher, build incentives around that action.

One of the most famous (and slightly creepy) examples of this was Target's 2012 pregnancy prediction model. They grouped shoppers into a behavioral cohort based on their purchase history—things like unscented lotion and supplements. This let them predict life events with 87% accuracy and send incredibly timely coupons, reportedly boosting baby product sales by 20-30% for those cohorts. You can read more about how big data shapes retail on Datamation.com. While these groupings are fundamental, you can get even more granular with other powerful customer segmentation strategies.

Key Metrics to Track

Once you have your groups, you need to decide what to measure. "Activity" is way too vague. You need to focus on specific numbers that tie directly to your business goals.

For most marketing teams, it comes down to three essentials:

  1. Retention Rate: This is the big one. It’s the percentage of users in a cohort who are still active after a certain period. High retention means people are finding real, ongoing value in what you offer.
  2. Churn Rate: This is the flip side of retention. It tracks the percentage of users from a cohort who stop using your product. If you see churn spike at the same point for multiple cohorts, you’ve likely found a critical friction point in your user experience.
  3. Customer Lifetime Value (LTV): This tracks the total revenue a cohort brings in over time. Comparing the LTV of different cohorts is one of the clearest ways to see the true ROI of your marketing campaigns and product changes.

When you combine a cohort type with a key metric, you create a powerful, focused question. For example: "What is the 90-day retention rate (metric) of users acquired during our Q4 campaign (acquisition cohort)?" This is the kind of focus that turns data into action.

How to Build Your First Cohort Analysis Step-by-Step

Alright, let's move from theory to action. This is where the real insights are hiding. Building your first cohort analysis might sound like a job for a data scientist, but it’s a process any marketer can—and should—master. It all boils down to asking the right questions and then lining up your data to find the answers.

This guide breaks it down into five clear, manageable steps. Follow them, and you'll turn raw user data into a powerful story that reveals trends, flags problems, and surfaces opportunities you didn't know you had.

Step 1: Define Your Core Question

Before you even think about opening a spreadsheet, you need to know what you're trying to learn. A vague goal like "I want to see user behavior" is a recipe for a confusing, useless chart. Instead, start with a specific, measurable question that ties directly to a business outcome.

A great question is your compass for the entire analysis. Here are a few examples to get your wheels turning:

  • Campaign Performance: "Do users we got from our latest TikTok campaign have a higher 30-day retention rate than users from our Google Ads?"
  • Onboarding Impact: "Did the new onboarding flow we launched in March improve Week 1 retention for new users compared to the February cohort?"
  • Feature Adoption: "Are users who tried our new 'Project Template' feature in their first week more likely to stick around after 60 days?"

Your question dictates which users to group, what actions to track, and how to define success. Without a clear one, you're just wandering in the dark.

Step 2: Identify and Gather Essential Data

With your question locked in, it's time to gather the raw materials. You don't need every scrap of data on every user. You just need the essentials to form your cohorts and watch what they do over time.

For a standard retention analysis, you typically need just two key pieces of information for each user:

  1. The Cohort Date: This is the date the user joined. For an acquisition cohort, this is simply their sign-up date.
  2. Activity Dates: This is a running list of every date the user was active—when they logged in, opened the app, or made a purchase.

This data usually lives in your product analytics tool, your CRM, or even raw database logs. The goal is to get it into a simple format, like a spreadsheet, where each row represents a user's activity.

Step 3: Group Users into Cohorts

Now, let's get organized. This is where you officially group individual users into their respective cohorts. If you're looking at monthly sign-ups, you'll create a cohort for January, one for February, and so on.

Imagine your raw data looks like a simple table:

User IDSign-up DateLast Seen
User A2024-01-152024-03-20
User B2024-01-222024-01-25
User C2024-02-052024-04-10

Here, you'd group User A and User B into the "January 2024" cohort and User C into the "February 2024" cohort. Simple as that. This step transforms a messy list of individuals into a handful of tidy groups, setting the stage for the real analysis.

Step 4: Calculate Retention Rates Over Time

This is the math part, but don't worry, it's straightforward. For each cohort, you'll calculate the percentage of users who came back during specific time intervals after they joined. Think Day 1, Day 7, Day 30, or Month 1, Month 2, etc.

The formula is dead simple:

Retention Rate (Month N) = (Number of users from the cohort active in Month N) / (Total number of users in the cohort)

You just repeat this calculation for each cohort across each time period. So, for the January cohort, you’d calculate how many of them came back in February (Month 1), then March (Month 2), and so on. This process is what builds the grid of percentages that will bring your chart to life.

As you get comfortable with this, you'll see how it plugs into bigger metrics. Understanding how to calculate Customer Lifetime Value, including cohort-based methods is a great next step.

Step 5: Visualize and Interpret Your Findings

Finally, the payoff. You’ll visualize your grid of numbers in a cohort chart, which is almost always a heatmap. This is where your spreadsheet transforms into an intuitive, visual story.

This flowchart lays out the entire process from start to finish.

A flowchart outlining the steps of cohort analysis, including grouping users, tracking behavior, and analyzing metrics.

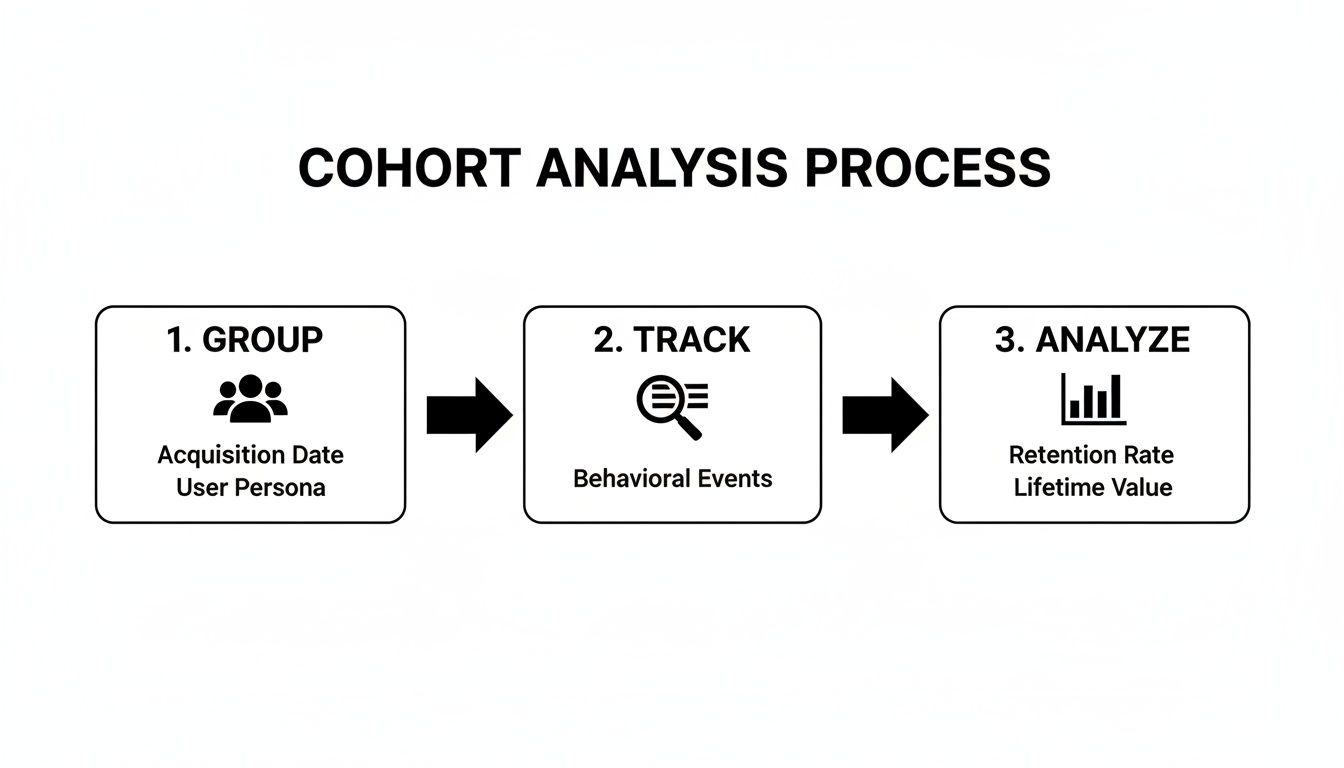
You group users, track their behavior, and analyze the patterns that emerge. It's a clean workflow.

Once you have the chart, interpreting it is all about looking for patterns:

  • Read the Rows (Horizontally): How does a single cohort's retention fade over time? A steep drop-off screams early churn.
  • Scan the Columns (Vertically): How does Month 1 retention compare across different cohorts? If that column gets darker over time, your onboarding or initial user experience is improving.
  • Look for Diagonals: Do you see weird diagonal stripes of poor retention? That could point to a problem that affected all active users at a specific point in time, like a widespread bug or a bad product update.

By methodically following these steps, you create a clear, data-backed picture of user behavior. You’re no longer guessing—you’re making genuinely informed marketing decisions.

Putting Cohort Analysis into Action with Real-World Examples

Four colleagues analyze data and charts on a large screen, discussing 'Actionable Cohorts'.

Theory is great, but seeing cohort analysis solve real problems is where it all clicks. This isn’t just about making colorful charts. It’s about turning squiggly lines on a graph into specific, strategic moves that actually grow the business.

Let's walk through a few mini-stories of marketers using cohort analysis to win. Each one starts with a common marketing headache, shows the critical insight a cohort chart revealed, and breaks down the exact change they made. Think of this as your playbook for putting what you’ve learned into practice.

Use Case 1: Fixing a Leaky Onboarding Funnel

The Problem: A B2B software company was stuck. They were getting a steady stream of new sign-ups every month, but their overall user retention numbers just wouldn't budge. The top-level metrics looked fine, but something was clearly broken.

The Cohort Finding: After building a daily acquisition cohort chart, a glaring pattern jumped out. For every single new cohort, retention would drop off a cliff right after Day 3. While Day 1 retention was a healthy 50%, by Day 4, it consistently plummeted below 15%. That told the team the issue wasn’t the product itself—it was something happening in the very first few days.

The Actionable Solution: The team quickly zeroed in on their three-part welcome email sequence. It was front-loaded with generic feature tours and failed to guide users toward that critical "aha!" moment.

Armed with this insight, they took immediate action:

  • Reworked Emails: They rewrote the Day 2 and Day 3 emails to focus on one high-value action: creating their first project.
  • Added In-App Prompts: They also implemented simple in-app tooltips that appeared on Day 2, nudging users who hadn't started a project yet.

The result? The very next cohort showed a 35% retention rate on Day 4. They more than doubled the previous average and effectively plugged the leak in their onboarding funnel. This is a perfect example of how focusing on early interactions can dramatically improve your customer retention marketing strategies.

Use Case 2: Finding the Most Profitable Ad Channels

The Problem: A direct-to-consumer brand was spending money across multiple channels—organic search, TikTok ads, and influencer collaborations. On paper, TikTok was the hero. It was driving the highest volume of clicks and had the lowest cost-per-acquisition (CPA). Seemed like a no-brainer.

The Cohort Finding: The marketing manager decided to dig deeper and compare the customer lifetime value (LTV) of cohorts acquired from each channel. The analysis told a completely different story.

Acquisition ChannelAverage 90-Day LTV
Organic Search$125
Influencer Collabs$95
TikTok Ads$40

While TikTok brought in tons of cheap clicks, those users almost never made a second purchase. Meanwhile, the cohort from organic search, though smaller, had a 3x higher LTV after just three months. They weren't just one-and-done buyers; they were sticking around.

The Actionable Solution: This single chart led to a major budget shift. The team pulled back on their top-of-funnel TikTok ad spend and reinvested that money into SEO and content marketing. They stopped chasing cheap acquisitions and started investing in profitable, long-term customer relationships.

Use Case 3: Validating a New Product Feature

The Problem: A project management app had just invested a ton of resources into building a new "Team Dashboard" feature. After launch, the aggregate engagement metrics showed a small uptick, but the leadership team wanted definitive proof: was this new feature actually making users stick around longer?

The Cohort Finding: A product marketer set up a simple comparison. They looked at the "Pre-Dashboard" cohort (users who signed up the month before launch) versus the "Post-Dashboard" cohort (users who signed up the month after). The results were crystal clear. The Post-Dashboard cohort had a 15% higher 3-month retention rate.

This isn't just a hypothetical. Many real SaaS companies saw this in the 2020s. For example, after Slack integrated new collaboration features, their 2021 cohorts saw a huge retention lift. The March 2021 cohort—the first group exposed to new canvas features—maintained 62% Day 30 retention, a massive jump from the 48% seen in prior cohorts, directly impacting their revenue per user. You can learn more about Slack's cohort-driven growth at Statsig.com.

The Actionable Solution: This cohort analysis was the proof they needed. The company could now confidently double down on promoting the new dashboard in onboarding flows and marketing campaigns, knowing it was a key driver of user loyalty.

Choosing Your Tools and Sidestepping Common Traps

Alright, you've got the theory down. Now, let's get our hands dirty. A great cohort analysis isn't just about following the steps—it's about picking the right tool for the job and knowing which rookie mistakes to dodge. Get this part wrong, and you'll either waste a ton of time or, even worse, walk away with the wrong conclusions.

Your choice of tool really boils down to your team's size, budget, and how comfortable you are with technical deep dives. Most marketers land in one of three camps.

Choosing the Right Tool for Your Cohort Analysis

Picking a platform is your first real step. Do you just need a quick-and-dirty analysis for a one-off project, or are you building a system for ongoing, automated insights? This table should help clear things up.

Tool TypeBest ForProsCons
Spreadsheets (Google Sheets, Excel)Beginners, small datasets, and one-time analyses where budget is a primary concern.No cost and incredibly flexible. You can build completely custom calculations and charts without any limitations.Manual and error-prone. Gets painfully slow and clunky as your dataset grows. Not built for ongoing analysis.
Product Analytics (Mixpanel, Amplitude)Marketing and product teams needing automated, real-time insights without deep technical skills.Fast and automated with built-in cohort charts. It’s dead simple to track user behavior and retention day-to-day.Can get expensive, and you’re pretty much stuck with the data and chart types the platform offers out of the box.
BI Tools (Tableau, Looker)Data teams and large organizations with complex, custom data from multiple sources.Extremely powerful and customizable. You can blend data from just about anywhere to get a super deep understanding.High cost and a steep learning curve. You'll almost certainly need a dedicated data analyst to build and manage these.

Ultimately, the best tool is the one that gets you the insights you need without creating a massive headache. Start simple and scale up as your needs become more complex.

Common Mistakes to Sidestep

Even with the perfect tool in hand, a few common traps can completely derail your analysis. Knowing what they are is the best way to make sure your work actually drives the business forward, instead of just producing a pretty chart.

The absolute biggest mistake? Doing nothing with the insights. A cohort chart that doesn't inspire a change in strategy—a new campaign, a product tweak, a different onboarding flow—is just a vanity report.

Here are a few other slip-ups I see all the time:

  • Mistake 1: Analyzing Cohorts That Are Too Small A cohort with just a handful of users is a recipe for disaster. It isn’t statistically significant, meaning the random behavior of one or two people can throw off the entire trend and send you chasing ghosts. How to fix it: If your user volume is low, zoom out. Group your cohorts by month or even by quarter instead of by day or week. A good rule of thumb is to aim for at least 100 users in each cohort before you start drawing any big conclusions.

  • Mistake 2: Focusing on Vanity Metrics Sure, "time on page" is a metric you can track, but does it actually have anything to do with whether a customer sticks around or spends more money? Chasing metrics that don't tie back to real business goals is just creating noise. How to fix it: Keep your eyes on the prize. Prioritize truly actionable metrics like retention rate, churn rate, and customer lifetime value (LTV) for each cohort. These numbers tell you the real story about the health of your business.

Free Tool

Try our Lookalike Company Finder — find companies similar to your best customers in seconds. No signup required.

Still Have Questions? Let’s Clear Things Up

Even after you’ve got the basics down, a few practical questions always seem to pop up the first few times you run a cohort analysis. Let’s tackle the most common ones head-on so you can move forward with confidence.

Wait, Isn't This Just Segmentation?

Not quite, though they're definitely related. Think of it this way:

Segmentation is like taking a snapshot of all your users right now and grouping them by static traits. Who are my customers in California? Who are my enterprise users? It's a picture of the present.

Cohort analysis, on the other hand, is like a time-lapse video. You group users by a shared starting point—like everyone who signed up in January—and then watch how that specific group behaves over the next few weeks, months, or years. All cohorts are a type of segment, but not all segments are cohorts. It’s all about tracking change over time.

How Big Does a Cohort Need to Be?

There’s no single magic number, but you need enough people to see a real pattern, not just random noise. A good rule of thumb is to aim for at least 100 users in any cohort you plan to analyze.

If your groups are too small, the behavior of just one or two power users (or inactive ones) can completely skew your results and send you chasing ghosts. If you're not getting enough volume, just broaden your timeframe. Instead of looking at weekly sign-ups, group them by month or even by quarter. This will give you larger, more reliable groups to work with.

How Often Should I Be Doing This?

The honest answer? It depends entirely on the rhythm of your business.

  • Weekly or even Daily: This is perfect for high-volume B2C apps, e-commerce stores, or mobile games. When you're running constant promotions and A/B tests, you need that fast feedback loop to see what’s working right now.
  • Monthly or Quarterly: This cadence makes more sense for most B2B SaaS companies. With longer sales cycles and user onboarding periods, behaviors change more slowly. A monthly or quarterly check-in gives trends enough time to actually emerge.

The key is to sync your analysis with your marketing and product sprints. When you do that, it stops being a backward-looking report and becomes a tool that shows you the direct impact of your decisions.


Ready to turn these insights into action without getting stuck in spreadsheets? marketbetter.ai doesn’t just help you understand your cohorts; it gives you the AI-powered content and campaign tools to engage them effectively. See how our platform can automate your growth at https://www.marketbetter.ai.

10 Actionable Omnichannel Marketing Examples to Inspire You in 2026

· 28 min read

Omnichannel is not just a marketing trend; it is the new standard for customer engagement. It represents the art and science of creating a single, unified experience for customers across every touchpoint, from their first social media interaction to an in-store purchase and post-sale support. The core challenge is moving from theory to reality. Success requires a fundamental shift: stop thinking in siloed channels and start building a cohesive ecosystem where digital and physical worlds merge seamlessly.

This article provides the blueprint. We will dissect 10 powerful omnichannel marketing examples from industry leaders like Nike, Sephora, and Starbucks. Instead of offering surface-level descriptions, we will break down the specific strategies, tactics, and technologies behind their success. You will gain actionable insights into how they orchestrate customer journeys that are both context-aware and deeply personal.

For each example, we will provide a comprehensive analysis covering:

  • The Strategic Goal: What specific business problem were they trying to solve?
  • Channel Integration: How did they connect digital and physical touchpoints?
  • Execution Details: A look at the specific tactics and tools used.
  • Performance Metrics: The tangible results and ROI of their approach.
  • Actionable Takeaways: Replicable methods you can adapt for your own business.

We will also explore how an AI-powered platform like marketbetter.ai can help you orchestrate these complex journeys, transforming your customer engagement from fragmented to fluid. This deep dive moves beyond the buzzword to give you a clear, strategic framework for building a truly connected and profitable customer experience.

1. Starbucks Mobile App & In-Store Integration

Starbucks stands as a premier example of omnichannel marketing, masterfully blending its digital and physical customer experiences. The core of its strategy is the seamless integration between its mobile app and its brick-and-mortar stores. This creates a cohesive journey where customers can browse, order, pay, and earn rewards across channels without friction. A user can start their order on the mobile app while commuting, pay digitally using a stored card or rewards points, and then walk into the store to pick up their beverage, often bypassing the main queue entirely. This convenience is a powerful differentiator.

Hands exchanging a takeaway coffee and a smartphone at a cafe counter with an 'ORDER READY' sign.

Comparative Edge: Unlike many retailers whose apps are merely digital storefronts, Starbucks transforms its app into a central hub for the entire customer relationship. The app's Order & Pay feature now accounts for over 25% of all transactions, a testament to its successful adoption and deep integration into the daily habits of its customers.

Strategic Breakdown

The brilliance of this omnichannel marketing example lies in its data-driven personalization. Every transaction, whether in-app or in-store via the app, feeds into a unified customer profile. This allows Starbucks to deliver hyper-personalized offers, such as "double star" days on a customer's favorite drink or suggesting a new pastry based on their purchase history.

Key Insight: The Starbucks model proves that a successful omnichannel strategy isn't just about being present on multiple channels; it's about making those channels communicate in real-time to enhance the customer experience and drive business intelligence.

Actionable Takeaways for Your Business

  • Unify Customer Data: Invest in a CRM or CDP that can sync customer data from all touchpoints, including your app, website, and physical POS systems. This is the foundation for personalization.
  • Prioritize Convenience: Identify friction points in your customer journey. Can a mobile pre-order system reduce wait times? Can digital payments speed up checkout?
  • Incentivize Channel Integration: Use your loyalty program to encourage customers to connect their in-store and online activities, just as Starbucks Rewards links every purchase to a single account.

2. Nike's Digital-First Retail Strategy

Nike has redefined athletic retail by fusing its powerful digital ecosystem with its physical stores, creating an immersive, high-touch shopping journey. The strategy revolves around the Nike app, which acts as a remote control for the in-store experience, effectively erasing the line between online browsing and in-person shopping. Customers can use the app to check real-time inventory, reserve products for pickup, and even unlock exclusive rewards or content simply by walking into a store. This transforms a simple shopping trip into a personalized, interactive event.

Customer uses a smartphone for augmented reality virtual shoe try-on in a modern retail store.

This digital integration empowers both the customer and the store associates. Shoppers can use features like AR-powered virtual shoe try-ons, while employees are equipped with mobile devices to provide on-the-spot service, check stock, and process sales anywhere on the floor. The success is evident in apps like SNKRS, which boasts over 100 million downloads, turning product drops into major cultural moments.

Strategic Breakdown

Comparative Edge: Nike’s approach is a masterclass in using technology to add value, not just to facilitate transactions. While many retailers focus on "buy online, pick up in-store," Nike goes further by making its app an indispensable in-store companion. This creates a data feedback loop where online behavior informs the physical experience, and vice versa, allowing for deeply personalized member benefits and product recommendations.

Key Insight: A truly effective omnichannel strategy uses technology to enhance the physical environment, creating unique, engaging experiences that cannot be replicated online-only. Nike proves that retail stores can be powerful hubs for brand engagement, not just sales.

Actionable Takeaways for Your Business

  • Empower In-Store Staff: Equip your retail teams with mobile tools that provide access to customer profiles, inventory data, and a mobile POS. This untethers them from the cash register and turns them into versatile consultants.
  • Bridge Digital and Physical with Value: Develop app features that are specifically designed for in-store use. Think product scanning for reviews, access to exclusive in-store content, or easy booking for appointments or events.
  • Pilot and Iterate: Start with high-traffic flagship locations to test new technologies like AR or mobile checkout. Gather customer feedback and refine the experience before a wider rollout.

3. Sephora's Beauty Insider Program & Cross-Channel Experience

Sephora sets the gold standard for omnichannel marketing in the beauty industry by building its entire customer experience around the wildly successful Beauty Insider loyalty program. The strategy masterfully erases the lines between its mobile app, website, and physical stores, creating a single, unified ecosystem. A customer can use the app's Virtual Artist feature to try on lipstick shades, add their favorite to a wish list, and later receive a notification about an in-store event where they can get a sample, all while their purchase history and preferences sync across every touchpoint.

Customer uses a mobile app to interact with an in-store display, showcasing modern retail technology.

Comparative Edge: Unlike competitors whose loyalty programs are simple point-collection systems, Sephora's Beauty Insider program, with its 25 million-plus members, acts as a personalized beauty passport. The app allows customers to book in-store makeovers, scan products for reviews and information, and access exclusive tutorials, making it an indispensable tool both at home and in the aisle.

Strategic Breakdown

The power of Sephora's omnichannel marketing example is how it uses technology not as a gimmick, but as a genuine utility to enhance the shopping experience. The Beauty Insider program is the data backbone, capturing every interaction to fuel hyper-personalization. For instance, in-store associates can access a customer's online purchase history and wish lists to provide tailored recommendations, bridging the digital-physical gap effectively. This deep integration makes every channel smarter and more responsive to the individual shopper's needs.

Key Insight: Sephora proves that a loyalty program should be more than a transaction ledger; it should be the central thread that connects all channels, enriching the customer journey with data-driven value at every step.

Actionable Takeaways for Your Business

  • Elevate Your Loyalty Program: Transform your rewards program into a multi-channel hub. Integrate features that are useful both online and in-store, like appointment booking, product scanning, and exclusive content.
  • Arm Associates with Data: Equip your front-line staff with tools (like tablets) that provide access to a customer's unified profile. This allows them to offer a level of service that feels personal and informed.
  • Leverage Technology for Utility: Use AI and AR not just for novelty but to solve real customer problems, like Sephora’s Virtual Artist helps with shade matching. Explore more about how technology drives these kinds of marketing personalization strategies.

4. Target's Buy Online, Pick Up In Store (BOPIS)

Target has become a dominant force in retail by perfecting the "Buy Online, Pick Up In Store" (BOPIS) model, effectively transforming its physical stores into hyper-local fulfillment centers. The strategy flawlessly merges the convenience of e-commerce browsing with the immediacy of in-person shopping. Customers can purchase from a massive online inventory and, often within a couple of hours, pick up their order via in-store pickup or its popular Drive Up service without ever leaving their car. This approach directly addresses the consumer demand for speed and flexibility.

Comparative Edge: While many retailers offer BOPIS, Target has made it a core, highly efficient component of its business model, not just a tacked-on feature. In fact, over 95% of Target's digital and physical sales are fulfilled by its stores. This deep integration of inventory, digital interfaces, and in-store operations sets a high standard for operational excellence that few can match.

Strategic Breakdown

The genius of Target's BOPIS strategy lies in its operational excellence and how it leverages existing assets: its physical stores. Instead of building expensive, dedicated e-commerce warehouses, Target activated its entire network of nearly 2,000 stores as last-mile distribution hubs. This decentralized model reduces shipping costs and times significantly. The system relies on real-time inventory tracking, efficient in-store picking processes for employees, and a seamless customer notification system via the app and email.

Key Insight: Target proves that a successful omnichannel strategy can transform a potential liability (large physical store footprints) into a powerful competitive advantage by using them to solve the last-mile delivery challenge more efficiently than pure-play e-commerce rivals.

Actionable Takeaways for Your Business

  • Integrate Inventory Systems: Your first step must be to ensure your website's inventory syncs perfectly with your physical store's stock levels. Inaccurate data is the fastest way to create a frustrating BOPIS experience.
  • Optimize In-Store Fulfillment: Designate specific areas and train staff for efficient order picking and packing. This minimizes disruption to in-store shoppers and speeds up order readiness. To streamline these notifications and inventory updates, businesses can implement powerful e-commerce marketing automation.
  • Communicate Proactively: Use automated alerts to inform customers the moment their order is received, being processed, and ready for pickup. Clear communication manages expectations and enhances satisfaction.

5. Amazon's Seamless Online-to-Offline Integration

Amazon has evolved from an e-commerce giant into the quintessential example of a complete omnichannel ecosystem. The company masterfully connects its online marketplace with physical retail locations like Amazon Go and Whole Foods, creating a unified customer journey. A customer can add an item to their cart online, see related product recommendations based on a past Whole Foods purchase, and choose from multiple fulfillment options like Prime delivery or in-store pickup, all within a single, consistent account. This strategy turns every touchpoint into a cohesive part of the larger Amazon experience.

Comparative Edge: Unlike competitors who might treat their online and physical stores as separate business units, Amazon uses them to reinforce each other. Prime members, for example, receive exclusive discounts at Whole Foods, which not only drives foot traffic but also deepens loyalty to the Prime subscription service. This flywheel effect, where each channel strengthens the others, is a hallmark of their sophisticated omnichannel marketing that is difficult for siloed companies to replicate.

Strategic Breakdown

The genius of Amazon's approach is its relentless focus on building a proprietary, data-rich ecosystem. By owning the technology stack from the "Just Walk Out" tech in Amazon Go stores to the complex logistics of Prime Now, Amazon captures unparalleled data at every interaction. This data then fuels its powerful recommendation engine, personalizing the experience whether a customer is browsing online, shopping at Whole Foods, or using an Alexa device.

Key Insight: Amazon proves that a true omnichannel strategy is about building an inescapable ecosystem. By connecting disparate services through a unified account and a compelling membership program (Prime), they make it more convenient for customers to stay within their network than to leave.

Actionable Takeaways for Your Business

  • Create Ecosystem Effects: Connect your different products or services. If you have a subscription service, offer exclusive benefits at your physical locations or on your e-commerce site to incentivize cross-channel engagement.
  • Invest in a Unified Customer ID: Ensure that a customer is recognized as the same person whether they are on your app, website, or in your store. This is the technical foundation for any true omnichannel personalization.
  • Leverage Physical Data Online: Use insights from in-store purchases to inform online marketing. If a customer frequently buys a certain brand in-store, feature it prominently for them on your website and in email campaigns.

6. Adidas's Digital-First Brand Experience

Adidas has masterfully pivoted from a traditional product company to a digital-first brand, creating an integrated ecosystem that blurs the lines between online and offline commerce. Their strategy focuses on building a direct-to-consumer relationship through a network of interconnected digital platforms, including their mobile apps, e-commerce site, social channels, and technologically enhanced physical stores. This creates a cohesive brand world where a customer can discover a new shoe in an Instagram story, enter a raffle for it on the CONFIRMED app, and then try on a related apparel item in-store using a digitally connected fitting room.

Comparative Edge: Unlike competitors who may treat their app as just another sales channel, Adidas uses apps like CONFIRMED to cultivate a community around its most sought-after products. By offering exclusive content, raffles for limited-edition sneakers, and behind-the-scenes stories, Adidas transforms a simple transaction into a high-engagement brand experience, driving both loyalty and incredible demand.

Strategic Breakdown

The core of this powerful omnichannel marketing example is its use of exclusivity and community to drive channel adoption. Instead of just asking customers to download an app, Adidas gives them compelling, can't-get-anywhere-else reasons to do so. This data is then used to personalize the experience across all touchpoints, from targeted push notifications about an upcoming drop to in-store recommendations based on app activity. It’s a symbiotic loop where digital engagement enhances the physical experience and vice-versa.

Key Insight: Adidas proves that an omnichannel strategy thrives when it creates unique value propositions for each channel that work together. Exclusivity on one channel (the app) can drive traffic and excitement across the entire ecosystem.

Actionable Takeaways for Your Business

  • Create Channel-Exclusive Value: Don't just replicate your website on your app. Offer app-only products, early access, or exclusive content to incentivize downloads and create a "fear of missing out" (FOMO).
  • Bridge Digital and Physical Worlds: Use in-store technology like QR codes or NFC tags to connect physical products to rich digital content, reviews, or related items in your app.
  • Leverage Social for Commerce and Community: Move beyond simple promotions on social media. Host live shopping events, run interactive polls, and use influencer partnerships to create authentic conversations that naturally lead to commerce.

7. Walmart's Omnichannel Logistics and Fulfillment Network

Walmart transformed its massive physical footprint into a powerful, decentralized fulfillment network, creating one of the most effective omnichannel marketing examples in retail. Instead of treating its e-commerce and brick-and-mortar operations as separate entities, Walmart leverages its 4,700+ stores as mini-distribution centers. This integration allows for a seamless flow of inventory and services, supporting options like Buy Online, Pick Up In-Store (BOPIS), curbside pickup, and ship-from-store. A customer can order groceries online for same-day delivery fulfilled by their local store, or purchase a non-grocery item online and pick it up within hours.

Comparative Edge: This strategy directly competes with Amazon's centralized warehouse model by using existing infrastructure to offer unparalleled speed and convenience for local customers. The Walmart+ subscription service, with over 20 million members, bundles these fulfillment benefits with other perks, creating a sticky ecosystem that blends digital convenience with physical accessibility.

Strategic Breakdown

The genius of Walmart’s approach is turning a potential liability, its vast network of expensive physical stores, into its greatest omnichannel asset. By empowering local store associates with mobile devices and real-time inventory data, each location becomes a node in a dynamic logistics web. This allows Walmart to fulfill online orders faster and more cost-effectively than shipping from a distant warehouse, meeting modern consumer expectations for speed.

Key Insight: A successful omnichannel strategy can be built by re-imagining the role of existing physical assets. Walmart proved that stores aren't just for in-person shopping; they can be the backbone of a sophisticated, hyper-local e-commerce fulfillment operation.

Actionable Takeaways for Your Business

  • Leverage Physical Locations: If you have physical stores, view them as fulfillment centers. Implement ship-from-store and BOPIS options to reduce shipping times and costs while driving foot traffic.
  • Empower Frontline Staff: Equip your store associates with the technology (like handheld scanners and mobile apps) and training needed to accurately and efficiently pick, pack, and manage online orders.
  • Integrate Inventory Systems: Your website's inventory must sync in real-time with each store's stock. A customer should never be able to order an item for pickup that is out of stock at their chosen location.

8. Ulta Beauty's Integrated Services and Digital Ecosystem

Ulta Beauty has redefined the retail experience by seamlessly merging its physical services with a powerful digital ecosystem. The core of its strategy is the symbiotic relationship between its in-store beauty services like salons and skin bars, and its e-commerce platform and mobile app. This creates a holistic journey where a customer can discover a service online, book an appointment through the app, receive personalized product recommendations during their visit, and then easily repurchase those products later online. This fusion of service and retail is a prime omnichannel marketing example that builds deep, lasting customer loyalty.

Comparative Edge: Unlike competitors who might treat services as a separate business unit, Ulta integrates them directly into the retail journey. The mobile app features GLAMlab, an AI-powered virtual try-on tool, and a skin analysis feature that provides tailored suggestions, bridging the gap between digital exploration and physical purchase in a way that product-only retailers cannot.

Strategic Breakdown

The genius of Ulta's omnichannel strategy lies in its use of services as a powerful data collection and sales conversion tool. An in-store haircut or facial is not just a transaction; it is an opportunity for a trained professional to understand a customer's needs and recommend specific products. This information feeds into the customer's unified profile, allowing the app and website to provide hyper-relevant product suggestions and content long after the appointment ends. The Ultamate Rewards program further connects every touchpoint, rewarding customers for both product purchases and service appointments.

Key Insight: Ulta's model demonstrates that integrating high-touch physical services with a data-rich digital platform creates a powerful "stickiness." Services drive store traffic and create personalized consultations, while the digital ecosystem captures those insights to drive ongoing e-commerce sales.

Actionable Takeaways for Your Business

  • Link Services to Sales: If you offer services, ensure they are not siloed from your retail operations. Equip service professionals with tools to access customer purchase history and make data-informed product recommendations.
  • Digitize Service Booking: Implement a seamless online and in-app booking system for any appointments or consultations you offer. Use appointment confirmations and reminders as opportunities for upselling or cross-selling relevant products.
  • Create a Unified Loyalty Program: Design a rewards program that recognizes and incentivizes all forms of customer engagement, including both service appointments and product purchases, across all channels.

9. Uniqlo's Data-Driven Omnichannel Personalization

Japanese apparel brand Uniqlo provides a powerful omnichannel marketing example by placing data at the core of its customer experience. The company excels at unifying customer behavior across its mobile app, website, and physical stores to create a deeply personalized and efficient shopping journey. This data-driven approach allows Uniqlo to connect online browsing habits with in-store purchases, fueling everything from product recommendations to localized inventory management. A customer might scan a product barcode in-store to check online stock, which then informs the personalized offers they see in the app later that day.

Comparative Edge: Unlike competitors that often treat their digital and physical channels as separate entities, Uniqlo sees them as two sides of the same coin. With its app boasting over 50 million downloads, the brand has created a massive, connected ecosystem. In-store digital terminals allow shoppers to access the full online inventory, order out-of-stock items for home delivery, and view exclusive content, effectively erasing the line between brick-and-mortar and e-commerce.

Strategic Breakdown

Uniqlo’s strategic brilliance lies in its ability to translate a unified customer view into tangible operational advantages and a better shopping experience. By analyzing data from all touchpoints, Uniqlo can accurately predict demand for specific styles in particular locations, optimizing inventory to reduce stockouts and markdowns. This means a store in a colder climate is more likely to be stocked with HEATTECH items, based not on guesswork, but on the aggregated purchase and browsing data of local customers.

Key Insight: A truly effective omnichannel strategy uses unified customer data not just for marketing personalization, but to drive core business operations like inventory, logistics, and product development, creating a virtuous cycle of customer satisfaction and efficiency.

Actionable Takeaways for Your Business

  • Build a Data Foundation: Your first step is to centralize customer information. Investing in a robust system is crucial for collecting and syncing data from your app, website, and physical stores. Learn more about customer data platform integration to get started.
  • Empower In-Store Teams: Equip your physical stores with technology that connects to your digital ecosystem. In-store terminals or tablets that allow customers and staff to access online inventory can prevent lost sales and improve service.
  • Personalize at Scale: Use customer data to tailor marketing beyond just using a first name. Segment your audience based on cross-channel purchase history to send relevant product recommendations and offers that reflect their genuine preferences.

10. ASOS's Social Commerce and Digital Community Integration

ASOS has pioneered a digital-first approach to omnichannel marketing, focusing on the seamless integration of social media, e-commerce, and community engagement. The brand treats its social channels not just as marketing outlets but as core components of the shopping experience itself. This strategy allows customers to discover, engage, and purchase products directly within the platforms where they spend most of their time, creating a frictionless path from inspiration to checkout. A user might see a style on an Instagram Reel, click the tagged product, and complete the purchase without ever leaving the app.

and collaborating with a diverse range of influencers. This creates a powerful sense of authenticity and social proof that resonates deeply with its Gen Z audience. Unlike traditional retailers that rely on polished, top-down campaigns, ASOS builds its brand from the ground up, letting its community dictate trends and styles.

Strategic Breakdown

The genius of ASOS's strategy is its ability to use social channels as a two-way street for data and engagement. By monitoring trends and conversations on platforms like TikTok and Instagram, the company gains real-time insights into what consumers want, allowing it to rapidly adapt its product offerings and marketing messages. This feedback loop ensures that ASOS remains culturally relevant and that its inventory aligns with fast-moving fashion cycles. Their integration of virtual try-on tools further bridges the digital-physical gap, reducing purchase anxiety and improving conversion rates.

Key Insight: The ASOS model demonstrates that in a digital-first world, the most effective omnichannel strategy is one that builds a community, not just a customer base. Integrating commerce directly into social platforms transforms passive browsing into active purchasing.

Actionable Takeaways for Your Business

  • Embed Commerce in Content: Utilize features like Instagram Shopping, TikTok Shop, and Pinterest Product Pins to make your social content instantly shoppable. Reduce the number of clicks needed to get from discovery to purchase.
  • Champion User-Generated Content: Actively encourage and feature customer photos and videos. Create branded hashtags and run contests to build a library of authentic content that serves as powerful social proof.
  • Leverage Social Listening: Use social media monitoring tools to understand emerging trends, customer sentiment, and competitor activity. Let these insights inform your product development and marketing campaigns.

10-Brand Omnichannel Marketing Comparison

ExampleImplementation Complexity 🔄Resource Requirements 💡Speed / Efficiency ⚡Expected Outcomes ⭐📊Ideal Use Cases
Starbucks Mobile App & In-Store IntegrationHigh — POS + real-time backend integration; staff workflowsSignificant: backend systems, POS integration, training, data/privacy controlsHigh — order-ahead and digital payments reduce wait timesIncreased repeat purchases; digital ≈25%+ of sales; 13% comp growth (2019)QSR/coffee chains and high-frequency retail with loyalty focus
Nike's Digital-First Retail StrategyHigh — AR, inventory sync, mobile POS across storesHigh: AR tech, app development, in-store devices, trained staffMedium–High — AR reduces returns; mobile POS speeds checkoutStrong DTC growth ($9B digital revenue 2023); higher conversion and personalizationApparel/footwear brands targeting tech-savvy customers and flagship pilots
Sephora Beauty Insider & Cross-ChannelHigh — loyalty, AR try-on, service booking integrationHigh: loyalty platform, AR, in-store service systems, data integrationMedium — virtual try-on speeds decisions; bookings require schedulingLarge loyalty base (25M+); members drive 80%+ in-store transactions; higher CLVBeauty and premium retailers combining services and product sales
Target BOPIS (Buy Online, Pick Up In Store)Medium — inventory & fulfillment workflow changes; pickup opsModerate: inventory integration, fulfillment staffing, app notificationsHigh — same‑day pickup and curbside reduce delivery time/costHigher online-to-store conversion; increased add-on sales; BOPIS high conversion ratesBig-box and mass retailers with wide assortments and physical footprints
Amazon Online-to-Offline EcosystemVery High — unified accounts, logistics, cashierless storesMassive: proprietary tech, logistics network, retail real estate, data systemsVery High — Prime, cashierless, same-day options minimize frictionEcosystem drives loyalty; $575B revenue (2023); Prime members spend ~2.5xLarge marketplaces seeking end-to-end control and scale across channels
Adidas Digital-First Brand ExperienceHigh — live commerce, exclusive drops, social integrationsHigh: app features, social/live production, supply chain readinessMedium — live drops create urgency; fulfillment must scale quicklyNotable e‑commerce growth (32% in 2022); strong engagement from youthLifestyle and limited-release brands focused on community and drops
Walmart Omnichannel Logistics & FulfillmentHigh — store-as-fulfillment, ship-from-store orchestrationSignificant: associate tools, store layout changes, inventory systemsHigh — same‑day delivery and BOPIS scale via store networkImproved delivery costs/times; same‑day services growth; e‑commerce ↑7% (2023)Large-format retailers leveraging dense store networks for local fulfillment
Ulta Beauty Integrated Services & Digital EcosystemMedium–High — booking systems + inventory and service integrationModerate–High: trained professionals, booking platform, AI recommendationsMedium — bookings drive scheduled traffic; app eases conversionComparable sales ↑13%; services >15% of store sales; higher basket valueBeauty retailers blending in-store services with product retail
Uniqlo Data-Driven Omnichannel PersonalizationHigh — unified customer data platform, dynamic allocationHigh: CDP, analytics, inventory optimization systemsMedium — optimized inventory reduces markdowns; in-store terminals speed discoveryRevenue ↑11% (2023); digital ≈40%+ of sales; better assortment fit by locationApparel retailers optimizing assortments and local merchandising via data
ASOS Social Commerce & Digital CommunityMedium — social shoppable integrations, UGC and virtual try-onModerate: social commerce tooling, content creation, influencer programsHigh — social commerce enables impulse buys and fast acquisitionHigh social engagement (35%+ Instagram); social channels drive new-customer acquisitionDigital-first fashion brands targeting Gen Z and social-native shoppers
Free Tool

Try our Marketing Plan Generator — generate a complete AI-powered marketing plan in minutes. No signup required.

Your Next Move: Building Your Own Omnichannel Engine

Throughout this deep dive into premier omnichannel marketing examples, a powerful, unifying thread has emerged. The strategies employed by giants like Nike, Starbucks, and Sephora are not random acts of multichannel presence; they are meticulously engineered ecosystems designed around a single, immovable center: the customer. They prove that true omnichannel excellence isn't about being everywhere, but about being cohesive, convenient, and contextually relevant wherever your customer chooses to engage.

From Sephora's Beauty Insider program that turns every interaction into a loyalty-building moment to Target's mastery of BOPIS logistics that erases the line between digital cart and physical store, the lesson is clear. The goal is to make the transition between your app, website, social media, and physical locations so fluid that the customer doesn't even notice the channel switch. They only experience one unified, helpful, and personalized brand journey.

Deconstructing Success: Core Principles to Apply Now

While the scale of Amazon's fulfillment network or Nike's global digital footprint might seem out of reach, the core principles are universally applicable. Distilling these diverse omnichannel marketing examples down to their essence reveals a replicable blueprint for success:

  1. Data as the Foundation: Every standout example, from Uniqlo's AI-powered recommendations to Starbucks' personalized offers, is built on a foundation of unified customer data. They don't just collect data; they centralize it to create a single, dynamic customer profile that informs every marketing action.
  2. Friction is the Enemy: The most successful strategies are born from an obsession with removing customer friction. Adidas makes it easy to check in-store stock from its app, and Walmart’s multiple fulfillment options cater to the customer's immediate need for convenience. Your first step should be to map your own customer journey and ruthlessly identify and eliminate these pain points.
  3. Value Exchange is Paramount: Customers willingly share data and engage across channels when they receive tangible value in return. This could be the convenience of a pre-ordered coffee (Starbucks), the exclusive access and rewards of a loyalty program (Ulta Beauty), or the hyper-personalized shopping experience that makes them feel understood (ASOS).

Your Actionable Roadmap to an Omnichannel Future

Moving from inspiration to implementation is the most critical step. Don't try to replicate these complex systems overnight. Instead, adopt a phased, strategic approach focused on high-impact integrations.

  • Start Small, Integrate Smart: Begin by connecting your two most critical channels. This might be integrating your e-commerce inventory with your physical store's point-of-sale system or linking your CRM data to your email marketing platform to personalize campaigns based on purchase history.
  • Prioritize a Single Customer View: Your immediate priority should be breaking down data silos. A platform that can unify data from your website, mobile app, and in-store transactions is no longer a luxury; it's a foundational requirement for modern marketing. This unified view is what powers the personalization and consistency seen in our top examples.
  • Leverage Technology as a Force Multiplier: This is where a platform like marketbetter.ai becomes your strategic partner. Instead of manually trying to connect disparate systems, our AI-powered engine is designed to unify customer data, automate the creation of personalized content across your key channels, and continuously optimize campaigns for maximum impact. It allows you to execute a sophisticated omnichannel strategy without requiring an enterprise-level budget or a massive data science team.

The landscape is constantly evolving, driven by new technologies and shifting consumer expectations. To truly future-proof your omnichannel engine and find inspiration for tomorrow's market, explore these 7 key omnichannel retail trends for 2025 to stay ahead of the curve.

Ultimately, the journey to omnichannel mastery is an investment in customer-centricity. It's a commitment to understanding and serving your audience on their terms, creating experiences that are not only seamless but also memorable and loyalty-inspiring. The examples we’ve explored prove that when done right, an omnichannel strategy is the most powerful engine for sustainable growth and lasting brand affinity.


Ready to stop just admiring great omnichannel marketing and start building your own? marketbetter.ai provides the unified data platform and AI-powered tools you need to connect your channels, personalize every interaction, and drive measurable results. See how our platform can turn the strategies from these examples into your reality at marketbetter.ai.

10 CRO Best Practices That Took Us From 1.2% to 4.7% Conversion Rate [2026]

· 28 min read

In the competitive B2B landscape, simply driving traffic isn't enough. The real challenge, and the greatest opportunity, lies in converting that traffic into meaningful business actions: qualified leads, scheduled demos, and ultimately, new revenue. While many marketers are familiar with the concept of Conversion Rate Optimization (CRO), the gap between theory and impactful execution remains vast. This guide is designed to close that gap.

We move beyond generic advice to provide a comprehensive roundup of the top 10 actionable conversion rate optimization best practices tailored specifically for mid-market and enterprise B2B teams. Before diving into advanced techniques, it's essential to understand what conversion rate is and why it's a critical metric for sustainable growth. This foundational knowledge ensures your optimization efforts are tied directly to business outcomes.

This article provides a blueprint for systematic improvement. We will compare different tactics, provide practical implementation checklists, and explore how to build a continuous optimization workflow. You will learn not just what to do, but how and why each practice works, with specific examples for:

  • A/B Testing & Experiment Design: Moving from random guesses to data-backed decisions.
  • User Experience (UX) Analysis: Using heatmaps and session recordings to uncover friction points.
  • Personalization & Segmentation: Delivering tailored content that resonates with high-value accounts.
  • Persuasive Copywriting & Social Proof: Building trust and creating urgency to drive action.

Each section is structured to be immediately applicable, helping you turn your digital properties into high-performance conversion engines. Our focus is on providing a prioritized framework that your marketing, sales, and product teams can implement to see measurable results. Let's begin.

1. A/B Testing (Split Testing)

A/B testing, also known as split testing, is the cornerstone of data-driven conversion rate optimization best practices. It's a methodical approach that compares two versions of a webpage or app element to determine which one performs better. In this controlled experiment, traffic is randomly split between the original version (the control, or "A") and a modified version (the treatment, or "B"). By analyzing user interactions, you can definitively identify which variant drives more conversions, whether that’s a signup, a download, or a purchase.

Two Apple iMac computers on a wooden desk, one displaying 'A/B Testing' text, with keyboards and mouse.

This method moves optimization from guesswork to a scientific process. For example, HubSpot famously tested the color of a call-to-action (CTA) button, discovering that a red button outperformed a green one by 21%. This wasn't based on a designer's preference; it was a statistically significant result proven with real user data. Compare this empirical approach to a simple design change made on a whim—the former provides a repeatable, data-backed win, while the latter is a shot in the dark that could even hurt conversions.

How to Implement A/B Testing Effectively

To get reliable results, your testing process must be rigorous. Avoid making assumptions and focus on isolating a single variable for each test. Instead of redesigning an entire landing page at once (which is better suited for multivariate testing), start with one high-impact element. For example, test your primary headline or your main CTA button text. Testing both simultaneously in a simple A/B test makes it impossible to know which change caused the result.

Actionable Steps for a Successful Test:

  • Establish a Strong Hypothesis: Don't just test randomly. Form a clear hypothesis like, "Changing the CTA button text from 'Learn More' to 'Get Your Free Demo' will increase form submissions because it is more specific and value-oriented." This is far more effective than a vague goal like "Test new button copy."
  • Calculate Your Sample Size: Before launching, use a sample size calculator to determine how much traffic you need to reach statistical significance. This prevents ending a test prematurely with misleading data.
  • Run for a Full Business Cycle: Let your test run for at least one to two full weeks to account for fluctuations in user behavior on different days of the week. Ending a test after three days could give you a skewed result based on weekday vs. weekend traffic.
  • Document Everything: Maintain a testing roadmap that logs every hypothesis, variant, result, and learning. This repository prevents re-testing old ideas and builds organizational knowledge.

2. Heatmaps and Session Recordings

While quantitative data from tools like Google Analytics tells you what users are doing (e.g., "70% of users drop off on the pricing page"), qualitative tools like heatmaps and session recordings show you why. This is a critical component of conversion rate optimization best practices, revealing the human behavior behind the metrics. Heatmaps create visual, aggregated representations of where users click, move their mouse, and scroll, while session recordings are like a DVR for your website, capturing individual, anonymized user visits.

These tools uncover user friction and reveal opportunities that quantitative data alone cannot. For instance, a Crazy Egg client discovered through a heatmap that users were frequently clicking on a non-interactive image, expecting a link. This insight led to a simple redesign that improved navigation and user experience. Compare this to only looking at bounce rate data; analytics would show the problem, but heatmaps pinpoint the exact cause. Tools like Hotjar and Microsoft Clarity make this analysis accessible.

How to Leverage Visual Feedback Effectively

The key to using these tools is to move beyond passive observation and actively look for patterns of user frustration or confusion. Instead of watching random sessions, focus your analysis on specific user segments or pages with high drop-off rates. This targeted approach turns raw behavioral data into a clear optimization roadmap, highlighting precisely where your user experience is failing to convert.

Actionable Steps for Meaningful Insights:

  • Analyze High-Exit Pages: Start by reviewing heatmaps and session recordings for your most critical pages with high bounce or exit rates, such as landing pages or checkout steps. This ensures your effort is focused on the biggest problems first.
  • Segment Your Data: Filter your insights by traffic source, device type, or user status (new vs. returning). A mobile user arriving from a social media ad will behave differently than a desktop user from an email campaign; analyzing them separately provides clearer insights.
  • Look for 'Rage Clicks': Identify areas where users are clicking repeatedly in frustration. These are high-priority UX issues that are likely costing you conversions and should be addressed immediately.
  • Combine with Other Data: Use your findings to form a hypothesis for an A/B test. If a heatmap shows users aren't scrolling to see your primary CTA, hypothesize that moving it "above the fold" will increase clicks and then test it.

3. Conversion Funnel Analysis

Conversion funnel analysis is a critical diagnostic tool in the arsenal of conversion rate optimization best practices. It involves mapping and measuring the user journey through a series of steps leading to a final conversion, such as a purchase or a sign-up. By visualizing this path, you can pinpoint exactly where users are "leaking" or dropping off, allowing you to focus your optimization efforts on the stages with the biggest impact on your bottom line.

This method transforms CRO from a series of disconnected tests into a strategic, problem-solving exercise. For instance, a B2B SaaS company might discover a massive 70% drop-off between viewing the pricing page and starting a trial. Compare this macro insight to randomly testing homepage headlines. The funnel data directs you to test new pricing models, add a comparison chart, or clarify feature limitations—actions that address the real bottleneck. Similarly, an e-commerce store could find that 80% of users who add an item to their cart abandon it at the payment selection step, indicating the clear solution is to integrate more payment options like PayPal or Apple Pay.

How to Implement Conversion Funnel Analysis Effectively

A successful funnel analysis relies on accurate data and a clear definition of each stage. Don't limit your view to the final macro-conversion; track the micro-conversions that lead up to it. Define key steps like "Viewed Product," "Added to Cart," "Initiated Checkout," and "Completed Purchase." Platforms like Google Analytics, Mixpanel, and Amplitude are essential for building and visualizing these funnels.

Actionable Steps for a Successful Analysis:

  • Define Key Stages and Micro-Conversions: Map out every critical step a user must take. For a lead-gen funnel, this could be: Landing Page Visit > Form View > Form Field Interaction > Form Submission. This granularity helps you pinpoint the exact moment of friction.
  • Segment Your Funnels: Don't analyze all users together. Create separate funnels for different traffic sources (organic vs. paid), device types, or user personas to uncover segment-specific friction points.
  • Prioritize the Biggest Leaks: Focus your initial optimization efforts on the stage with the highest drop-off rate. A small improvement at a major leakage point yields a much greater return than perfecting a step that already performs well.
  • Investigate the "Why": Once you identify where users drop off, use qualitative tools like heatmaps, session recordings, or exit-intent surveys to understand why. This insight fuels stronger A/B testing hypotheses.

4. User Testing and Feedback Collection

While quantitative data from A/B testing tells you what is happening, qualitative feedback from user testing reveals the crucial why. This approach involves observing real people as they interact with your website or product, providing direct insights into their thought processes, frustrations, and moments of delight. By collecting this feedback through moderated sessions, unmoderated tests, or surveys, you can uncover usability issues and psychological barriers that analytics alone will never show.

This method is fundamental to creating a user-centric experience. For instance, Dropbox used early user testing to discover that potential customers didn't understand the concept of a "file syncing" folder, leading them to create their famous explainer video which clarified the value proposition and dramatically boosted sign-ups. Compare this direct feedback approach to guessing what users want—one is based on evidence, the other on internal assumptions. To ensure your user testing provides valuable insights, it's crucial to understand how to efficiently collect customer feedback smarter.

How to Implement User Testing and Feedback Effectively

The goal of user testing isn't to get a statistically significant sample but to identify the most critical points of friction in the user journey. The Nielsen Norman Group famously states that testing with just five users can reveal around 85% of usability problems. The key is recruiting the right participants and asking the right questions to uncover genuine, unfiltered insights that inform your optimization roadmap.

Actionable Steps for a Successful Test:

  • Recruit Your Target Audience: Use screener surveys to find participants who accurately represent your ideal customer profile. Testing with the wrong audience yields irrelevant feedback that can lead you astray.
  • Ask Open-Ended Questions: Avoid leading questions like, "Was that button easy to find?" Instead, ask, "What are your thoughts on completing that task?" to encourage detailed, unbiased responses.
  • Observe More, Talk Less: Pay close attention to non-verbal cues like hesitations, sighs, or unexpected navigation paths. What users do is often more revealing than what they say.
  • Combine Feedback Methods: Integrate different data sources. Cross-reference insights from moderated testing sessions with data from on-site surveys and customer support tickets for a complete picture.
  • Create a Feedback Loop: Systematically use the insights gathered to form new A/B testing hypotheses. Test your proposed solution, validate the impact, and iterate. You can learn more about these voice of customer examples to see how this works in practice.

5. Landing Page Optimization

Landing page optimization is a critical component of any successful digital marketing campaign. It involves refining every element of a standalone webpage designed for a single, focused objective: to convert visitors. Unlike a homepage with multiple navigation paths, a landing page eliminates distractions to guide a user toward a specific action, such as signing up for a trial, downloading an ebook, or requesting a demo. Effective landing page optimization is one of the most direct ways to improve ROI on paid ad spend.

This focused approach delivers powerful results. For instance, Unbounce has documented numerous case studies where clients achieved 30-50% lifts in conversion rates through systematic testing of headlines, forms, and CTAs. Compare the performance of a dedicated, optimized landing page to sending paid traffic to a generic homepage. The landing page will almost always convert better because it's tailored to a specific audience and goal, whereas a homepage serves too many masters. This proves that treating landing pages as dynamic, testable assets is a core tenet of conversion rate optimization best practices.

How to Implement Landing Page Optimization Effectively

Successful optimization begins before a single test is run; it starts with message matching. Ensure the headline and core value proposition on your landing page directly reflect the ad copy or link that brought the user there. This creates a seamless, congruent experience that reduces bounce rates and builds immediate trust. From there, systematically test individual elements to identify friction points and opportunities for improvement.

Actionable Steps for a High-Converting Landing Page:

  • Aggressively Reduce Form Fields: Each additional field creates friction. Start with the absolute minimum information you need, as each removed field can boost conversions by 5-10%. For example, ask only for a work email instead of name, company, and phone number.
  • Focus on a Single, Clear CTA: Avoid decision fatigue by presenting only one primary call-to-action above the fold. Test specific, benefit-driven button copy like "Get Your Free Demo" versus a generic "Submit." The former tells users what they get; the latter tells them what they must do.
  • Leverage Social Proof Strategically: Place testimonials, customer logos, or user statistics directly beside your form or CTA. This placement reinforces trust at the critical moment of decision, reducing visitor anxiety.
  • Prioritize Headline Clarity: Your headline is the first thing visitors read. A/B test a creative, clever headline against a simple, direct headline that clearly states the benefit. Often, clarity beats cleverness. Leadpages has shown that a simple headline change can triple conversion rates.

6. Personalization and Segmentation

Personalization is the practice of tailoring the user experience to an individual's specific needs, behaviors, and context. Rather than presenting a one-size-fits-all website, you deliver dynamic content, offers, and messaging based on user data. This is achieved through segmentation, the process of grouping your audience into distinct clusters with shared characteristics, allowing for highly relevant and targeted communication. This approach transforms a generic user journey into a personal conversation, drastically improving engagement and conversions.

This tactic is one of the most powerful conversion rate optimization best practices because it directly addresses user intent. Amazon’s famous recommendation engine, which suggests products based on browsing history and past purchases, is a prime example of personalization driving massive revenue. Compare this to a generic retail site showing every visitor the same "Top Sellers." The personalized approach is far more likely to convert because it feels relevant. In B2B, this could mean showing case studies relevant to a visitor's industry or displaying pricing in their local currency.

How to Implement Personalization and Segmentation Effectively

Effective personalization goes beyond simply using a visitor's first name in an email. It requires a strategic approach to data collection and a clear understanding of your audience segments. The goal is to make the user experience feel more intuitive and helpful, not intrusive. Start by segmenting your audience based on high-value data points and then build personalized experiences for those groups before moving to one-to-one personalization.

Actionable Steps for a Successful Strategy:

  • Start with Broad Segments: Don't aim for hyper-personalization immediately. Begin by grouping users based on clear criteria like new vs. returning visitors, traffic source (e.g., organic search vs. paid social), or geographic location. Show returning visitors a "Welcome Back" message or content related to their last visit.
  • Leverage Behavioral Data: Use on-site actions to inform your strategy. For instance, if a user has repeatedly viewed your "Enterprise Plan" pricing page, serve them a CTA for a demo with an enterprise account executive instead of a generic "Contact Us" button.
  • Use Progressive Profiling: Instead of asking for 20 fields in one form, gather information over time. Ask for a name and email first, then on a subsequent visit, ask for company size or job title to enrich their profile without creating friction.
  • Test Your Personalization: Treat personalization like any other CRO effort. Form a hypothesis (e.g., "Showing industry-specific testimonials to visitors from the finance sector will increase demo requests") and A/B test the personalized experience against the generic one. Discover more by reading our guide to customer segmentation strategies on marketbetter.ai.

7. Form Optimization

Forms are the final gateway to conversion, whether it's for lead generation, a newsletter signup, or a purchase. Form optimization is the practice of strategically designing and structuring your web forms to minimize friction and maximize completion rates. By making forms easier, faster, and more intuitive to fill out, you directly address a major drop-off point in the customer journey and improve a critical component of your conversion rate optimization best practices.

This process is about more than just aesthetics; it's a science of user psychology and experience. For example, Unbounce famously increased conversions by 50% simply by reducing the number of fields in a form from ten to four. Compare the cognitive load of a 10-field form to a 4-field one. The shorter form feels less daunting and respects the user's time, making them far more likely to complete it. This proves that every additional field you ask for introduces another point of potential abandonment, making ruthless simplification a powerful tactic.

How to Implement Form Optimization Effectively

Effective form optimization begins with adopting a "less is more" philosophy. Scrutinize every field and ask if it is absolutely essential for the initial conversion. You can always gather more information later in the customer lifecycle using techniques like progressive profiling. Start by implementing changes that have the highest potential impact with the least user effort.

Actionable Steps for Better Forms:

  • Eliminate Optional Fields: If a field is marked "optional," remove it. This declutters the form and reduces cognitive load for the user. If the data isn't essential now, don't ask for it.
  • Use a Single-Column Layout: A single-column design is easier for users to scan and complete, especially on mobile devices. Compared to a multi-column layout, it provides a clear, linear path to completion without confusing eye movements.
  • Implement Inline Validation: Provide real-time feedback as a user fills out the form. A green checkmark for a correctly formatted email is far better than a single error message after they hit "submit" and have to re-enter data.
  • Add Trust Signals: Place trust badges, privacy policy links, or security seals near the submit button. This reassures users that their information is safe, which is particularly important when asking for sensitive data.

8. Social Proof and Trust Elements

Leveraging social proof is a powerful psychological tactic in conversion rate optimization best practices. It's the concept that people will conform to the actions of others under the assumption that those actions are the correct behavior. By strategically displaying testimonials, customer logos, security badges, and user reviews, you reduce purchase anxiety and build credibility, assuring prospects that they are making a wise decision by choosing you.

This principle is highly effective because it outsources trust-building to a third party: your existing customers. Slack famously showcases logos of well-known clients like NASA and Uber on its homepage to instantly establish enterprise-level credibility. Compare a landing page with client logos to one without. The former immediately communicates a level of trust and validation that self-promotional copy cannot achieve alone. For B2B software, embedding positive reviews from G2 or Capterra directly on a pricing or demo page can be the final nudge a prospect needs.

How to Implement Social Proof Effectively

The key to using social proof is relevance and placement. A generic testimonial is far less effective than a specific, metric-driven one from a customer in your target industry. Place these trust elements near key decision points, such as next to a call-to-action button, on a pricing page, or in the checkout process, to directly counter user hesitation.

Actionable Steps for a Successful Implementation:

  • Be Specific and Quantifiable: Prioritize testimonials with concrete results. A testimonial saying "Saved our team 20 hours per week" is far more compelling and believable than a generic one like "Saves us time."
  • Show, Don't Just Tell: Display logos of recognizable companies you work with. For B2B, include the reviewer’s name, title, and company to add layers of authenticity and relevance.
  • Use Different Formats: Combine static quotes with video testimonials, case studies, and user-generated content. A video testimonial from a happy customer is often more persuasive than a text quote because it builds a stronger emotional connection.
  • Place Trust Badges Strategically: Use security seals (like Norton or McAfee) and payment provider logos (Visa, PayPal) in your checkout flow to reassure users that their information is safe at the exact moment they are about to share it.
  • Test Placement and Type: A/B test a customer logo banner against a detailed testimonial on your homepage. The banner might be more effective for building initial brand trust, while the testimonial might convert better on a product page where users need specific validation.

9. Mobile Optimization and Responsive Design

With mobile traffic now accounting for over half of all web traffic, mobile optimization is no longer optional; it's a fundamental requirement for conversion. This practice ensures your website provides an intuitive, seamless experience on smartphones and tablets by prioritizing touch-friendly interfaces, fast load times, and simplified navigation. It’s a critical component of conversion rate optimization best practices, as a poor mobile experience is a direct path to a high bounce rate and lost revenue.

The impact of a mobile-first approach is well-documented. E-commerce giant Shopify, for instance, reported that merchants using its platform saw mobile conversion rates increase by over 50% after significant mobile checkout optimizations. Compare this to a "pinch-and-zoom" experience where users must struggle to navigate a desktop site on a small screen—the friction is immense, and abandonment is nearly guaranteed. Google's mobile-first indexing also means your mobile site's performance directly impacts your search engine rankings, making it a dual CRO and SEO priority.

How to Implement Mobile Optimization Effectively

True mobile optimization goes beyond simply making your site fit on a smaller screen. It requires rethinking the user journey from the perspective of someone on the go, with limited attention and a need for speed. Adopting a mobile-first design philosophy, where you design for the smallest screen first and then scale up, is the most effective way to ensure the core user experience is flawless.

Actionable Steps for Mobile Success:

  • Prioritize Performance: Aggressively compress images and minify code. Mobile users are less patient, and every second of load time increases abandonment. Use Google's PageSpeed Insights to diagnose and fix performance issues; aim for a load time under 3 seconds.
  • Design for Touch: Ensure all buttons and interactive elements have a minimum tap target size of 48x48 pixels to prevent frustrating mis-clicks. This is a small detail that has a massive impact on usability.
  • Simplify Forms and Navigation: Drastically reduce the number of form fields for mobile users. Use mobile-friendly input types (like a number pad for phone numbers) and a sticky, easy-to-access navigation menu to keep the interface clean and usable.
  • Test on Real Devices: Browser emulation is a good start, but nothing beats testing on actual iPhones and Android devices. This helps you catch device-specific rendering issues and truly understand the user's tactile experience.

10. Checkout Process Optimization

The checkout process is the final, most crucial step in a customer's journey, and it's where a significant portion of potential sales are lost. Checkout process optimization is the practice of systematically refining this flow to minimize friction, reduce cart abandonment, and maximize completed transactions. By simplifying forms, offering convenience, and building trust, you can convert more high-intent visitors into paying customers. This is one of the highest-impact areas for conversion rate optimization best practices because even small improvements can directly boost revenue.

A person's hands holding a smartphone, interacting with a fast checkout e-commerce app.

This principle was famously pioneered by Amazon with its patented "1-Click" checkout, which drastically reduced the steps needed to make a purchase. Compare that seamless experience to a checkout process that forces you to create an account, verify your email, and then re-enter your shipping information. The former encourages impulse buys and repeat business, while the latter encourages cart abandonment. E-commerce platforms like Shopify have built their success on providing merchants with streamlined, pre-optimized checkout experiences, understanding that a seamless final step is non-negotiable.

How to Implement Checkout Process Optimization Effectively

The goal is to make the payment process feel effortless and secure. Every extra field, unexpected cost, or moment of confusion creates an opportunity for the customer to second-guess their purchase and abandon their cart. Focus on removing barriers and reassuring the user at every stage of the checkout flow, from the initial cart view to the final confirmation page.

Actionable Steps for a Successful Checkout:

  • Offer a Guest Checkout: Forcing account creation is a major conversion killer. Make guest checkout the most prominent option and allow users to create an account after the purchase is complete.
  • Be Transparent with Costs: Display all costs, especially shipping and taxes, as early as possible. Surprise fees at the final step are the leading cause of cart abandonment. Show a complete order summary in the cart itself.
  • Simplify Form Fields: Only ask for essential information. Use tools like the Google Maps API to auto-populate address fields and set "billing address is same as shipping" as the default, pre-checked option.
  • Display Trust Signals: Prominently feature security badges (SSL certificates, Norton, McAfee), accepted payment logos (Visa, PayPal), and reassuring policies like a money-back guarantee or easy returns directly within the checkout flow.
  • Test Your Layout: Don't assume a one-page checkout is always better. Test it against a well-designed multi-step process with a clear progress indicator. For complex purchases, breaking the process into logical steps (Shipping > Billing > Review) can feel less overwhelming to users.

Top 10 CRO Best Practices Comparison

Method🔄 Implementation Complexity⚡ Resource Requirements⭐ Expected Effectiveness📊 Typical Outcomes / Impact💡 Ideal Use Cases / Tips
A/B Testing (Split Testing)Medium — needs experiment setup & statsMedium — traffic + testing tool⭐⭐⭐⭐ — reliable causal evidenceMeasurable conversion lifts; clear winner when significantTest high-impact elements first; calculate sample size
Heatmaps & Session RecordingsLow — simple install, review effortLow — affordable tools, time to analyze⭐⭐⭐ — strong qualitative insightReveals friction points and attention patternsFilter by device/segment; combine with analytics
Conversion Funnel AnalysisMedium–High — tracking & mapping eventsMedium — analytics setup and maintenance⭐⭐⭐⭐ — identifies bottlenecks fastHighlights biggest drop-offs; guides prioritizationDefine micro-conversions; segment by acquisition source
User Testing & Feedback CollectionMedium — planning, facilitation skillsMedium–High — recruiters, moderators, tools⭐⭐⭐⭐ — deep “why” insights (qualitative)Uncovers usability issues and feature ideasRecruit real users; run 5–8 sessions to surface major problems
Landing Page OptimizationLow–Medium — focused tests & design workLow — landing builders + traffic⭐⭐⭐⭐ — high ROI for single-purpose pagesFaster lift in conversion; clear attributionStart with headline and CTA; match ad messaging
Personalization & SegmentationHigh — data, rules, ML modelsHigh — data infra, tooling, maintenance⭐⭐⭐⭐⭐ — strong relevance and liftIncreased conversions, AOV, and retention when done rightStart simple segments; ensure privacy compliance
Form OptimizationLow — design & validation tweaksLow–Medium — dev effort for smart forms⭐⭐⭐⭐ — immediate reductions in abandonmentHigher completion rates and better data qualityMinimize fields; use inline validation and progressive profiling
Social Proof & Trust ElementsLow — content sourcing and placementLow — existing customer content often enough⭐⭐⭐⭐ — boosts credibility and reduces anxietyImproved conversion confidence, especially for high-consideration buysPlace near CTAs; use specific metrics and real photos
Mobile Optimization & Responsive DesignMedium–High — responsive build & testingMedium — dev + cross-device testing⭐⭐⭐⭐ — critical for mobile majority trafficBetter engagement, SEO lift, and mobile conversionsMobile-first design; optimize images and touch targets
Checkout Process OptimizationHigh — payment integrations & securityHigh — engineering, payment providers⭐⭐⭐⭐⭐ — direct, high-impact revenue gainsLower cart abandonment and increased completed ordersOffer guest checkout, transparent fees, multiple payment options
Free Tool

Try our Marketing Plan Generator — generate a complete AI-powered marketing plan in minutes. No signup required.

From Best Practices to Business Impact

Navigating the landscape of conversion rate optimization can feel like assembling a complex puzzle. You have all the pieces: A/B testing, heatmap analysis, user feedback, landing page design, form optimization, and social proof. The true challenge, however, isn't just knowing these pieces exist; it's understanding how they fit together to create a cohesive, high-performing conversion engine. This guide has provided a detailed roundup of conversion rate optimization best practices, but the ultimate goal is to move beyond a checklist and cultivate a strategic, data-driven mindset.

The journey from a static website to a dynamic, conversion-focused asset is a process of continuous, iterative improvement. It’s the difference between a marketer who simply implements a tactic, like adding a testimonial, and one who systematically tests three different testimonial formats on a key landing page to see which one resonates most with enterprise-level prospects versus mid-market leads. One is a guess; the other is a calculated business decision.

Synthesizing the Strategy: From Tactics to a Cohesive System

To truly harness the power of CRO, you must see the interconnectedness of the practices we've discussed. Your conversion funnel analysis (Practice #3) might reveal a significant drop-off on your pricing page. This is your starting point. From there, you can deploy other tactics in a targeted, strategic manner:

  • Heatmaps and Session Recordings (Practice #2): First, you watch session recordings of users on that pricing page. You notice they hesitate, scroll erratically, and often exit after clicking on a confusing feature comparison chart. This gives you a qualitative "why" behind the drop-off.
  • User Feedback (Practice #4): Armed with this insight, you launch a targeted survey on that page asking, "Is our pricing clear? What's one thing preventing you from moving forward?" The feedback confirms that the feature tiers are poorly explained.
  • A/B Testing and Landing Page Optimization (Practices #1 & #5): Now you have a clear hypothesis. You design two variations of the pricing page. Version A simplifies the feature chart into a scannable list. Version B introduces an interactive pricing calculator. You run a split test to see which solution most effectively reduces friction and increases "Request a Demo" clicks.

This methodical approach transforms isolated conversion rate optimization best practices into a powerful, problem-solving workflow. It’s no longer about random acts of optimization; it’s about a diagnostic process that leads to a quantifiable cure.

The Compounding Power of Incremental Gains

One of the most compelling aspects of a mature CRO program is its compounding effect. A 5% lift in conversions from form optimization might seem minor in isolation. However, when combined with a 10% increase from a personalized call-to-action and a 7% boost from improved mobile page speed, the cumulative impact on your lead generation and revenue is substantial.

Think of it this way: each optimization win doesn't just add to your success; it multiplies it. The improved form makes your paid search campaigns more profitable. The faster mobile site improves your SEO rankings, driving more organic traffic. This creates a positive feedback loop where your marketing efforts become more efficient and your customer acquisition cost steadily declines. Adopting these principles means you are building a sustainable growth engine, not just searching for a temporary lift in metrics. The real value is in creating a culture where every team member is empowered to ask, "How can we make this better?" and has the tools to find the answer.


Ready to move from manual testing to an intelligent, AI-powered optimization strategy? marketbetter.ai automates the entire CRO process, from identifying high-impact opportunities with predictive analytics to deploying personalized experiences at scale. Stop guessing and start converting by exploring how our platform can implement these conversion rate optimization best practices for you at marketbetter.ai.

A Practical Guide to Business to Business Marketing Automation

· 24 min read

Let's be honest, trying to build a genuine relationship with thousands of potential customers at once is a recipe for disaster. No human team, no matter how dedicated, can remember every single interaction, follow up at just the right moment, or serve up the perfect piece of content to every person, every time.

This is where business-to-business marketing automation comes in. It's not just software; it’s your team's tireless digital 'relationship builder' that works 24/7.

What B2B Marketing Automation Actually Does

Instead of your team getting bogged down in repetitive but critical tasks—like sending follow-up emails, tracking website visits, or segmenting lists by hand—this technology handles it all. It’s the engine that frees up your marketing and sales pros to focus on what they do best: thinking up brilliant strategies, launching creative campaigns, and closing deals with prospects who are already warmed up and engaged.

It’s the secret to scaling your outreach without having to scale your headcount.

From Manual Grind to Automated Nurturing

The real leap here is the shift from one-off actions to a continuous, intelligent system. A manual approach is like sending out individual letters one by one—it’s slow, error-prone, and impossible to scale. Automation, on the other hand, is like building a smart, responsive postal service that delivers personalized messages based on what each recipient actually does.

This flowchart gives you a glimpse into a pretty standard automated workflow. It shows how a system can guide a prospect from their first touchpoint all the way to becoming a sales-ready lead, no hand-holding required.

Person viewing a 'Relationship Builder' flowchart diagram on a laptop, showing business processes.

You can see how the system uses triggers (like a download or a page visit) to kick off specific actions. Trying to manage that kind of logic manually across hundreds or thousands of leads? It would be a nightmare.

This power is why its adoption is through the roof. By 2025, it's expected that 76-79% of B2B marketers will be using automation to steer their customer journeys. That's not just a trend; it’s a fundamental shift in how modern B2B marketing gets done, especially with the long, complex sales cycles we all know and love. You can dig into more marketing automation adoption statistics on emailvendorselection.com.

Core Functions and Their Impact

So, what do these platforms really do under the hood? It’s more helpful to think about them not as a list of features, but as solutions to the daily headaches your team faces. The table below compares these core functions to their manual counterparts, highlighting the real-world business impact.

Core Functions of B2B Marketing Automation Platforms

Core FunctionManual Approach (The "Before")Automated Approach (The "After")Business Impact Example
Lead NurturingSending sporadic, one-size-fits-all emails and hoping something sticks.Building a relationship with prospects over time through targeted, automated communication.Sending a series of educational emails to a new lead who downloaded a whitepaper, keeping your brand top-of-mind.
Lead ScoringSales reps manually sift through a list of leads with little context.Automatically qualifying leads by assigning points based on their behavior and demographics.Prioritizing a lead who visited the pricing page and has a "Director" title over a student downloading a single blog post.
Email MarketingSending a generic "e-blast" to your entire contact database.Sending personalized email campaigns at scale, triggered by specific user actions or segments.A prospect who abandons a demo request form receives an automated follow-up email asking if they need help.
Analytics & ReportingGuessing which marketing activities are actually driving revenue.Tracking campaign performance and measuring marketing's contribution to revenue.Identifying which content assets are most effective at converting marketing-qualified leads into sales opportunities.

Ultimately, each of these functions works together to create a smarter, more efficient system that aligns your marketing efforts directly with sales outcomes. It’s about doing more of what works and less of what doesn't.

Calculating the Real ROI of B2B Automation

While the features of marketing automation are great, the question every leader really asks is simple: what’s the return? A new tech investment needs to move past buzzwords and show a clear, bottom-line impact.

Let’s be clear: automation isn’t just about making a marketer’s job easier. It's a revenue engine. It directly boosts the metrics that matter, from the raw number of leads you generate to how good those leads actually are.

From Volume to Value

One of the first things you'll see with automation is an uptick in lead volume. But more leads don't automatically equal more revenue. The real magic is in nurturing those leads with precision until they are genuinely ready for a sales conversation.

This is where automated workflows shine. No one falls through the cracks. The system methodically engages prospects with the right content at the right time, turning lukewarm interest into active buying signals. This process dramatically increases the number of sales-qualified leads (SQLs) you can hand over to your sales team.

Marketing automation isn't a cost center; it's a massive financial multiplier for B2B companies. On average, businesses see a 544% ROI over three years. Put another way, that's about $5.44 back for every $1 you put in.

These aren't just vanity metrics. Businesses that use automation to engage prospects report an 80% increase in leads and a staggering 451% increase in qualified leads. The data speaks for itself.

Accelerating the Sales Cycle

The B2B sales cycle is notoriously long. It often involves a whole committee of decision-makers and a ton of "thinking it over." Marketing automation acts as a powerful accelerator by ensuring reps spend their time on conversations that are most likely to close.

Here's an actionable comparison of a sales cycle with and without automation:

  • Without Automation: A sales rep gets a long list of "leads." They start at the top and call each one, spending valuable time on prospects who aren't ready to buy, while a hot lead at the bottom of the list grows cold.
  • With Automation: The system tracks what people do—like visiting the pricing page or downloading a case study—and scores them accordingly. As soon as a lead hits that "ready" score, they're automatically routed to a sales rep along with a full history of every interaction. Your reps walk into every call with complete context. No more generic pitches. They can have meaningful discussions from the very first hello.

This whole process shaves days, weeks, or even months off the sales cycle. But beyond just understanding the benefits, you have to prove them. The best way to do that is by accurately calculating the return on investment for your marketing.

Ultimately, showing the dollars-and-cents value of your work is what gets you more budget and a seat at the table. For a detailed breakdown of the math, check out our guide on how to calculate marketing ROI. It gives you a clear framework to make the case for automation undeniable.

Choosing Your B2B Automation Platform

Picking the right business-to-business marketing automation platform isn’t just about buying software. It’s a strategic move. Think of it as installing the central nervous system for your entire marketing and sales operation. Get it right, and it will amplify everything you do. Get it wrong, and you're stuck with data silos, frustrated teams, and endless bottlenecks.

Your choice really boils down to your company's specific needs, where you are on your growth journey, and where you want to go. Are you just trying to get foundational tasks like email nurturing and basic segmentation off the ground? Or are you aiming for predictive insights and customer journeys that feel like they were built for one person at a time? Nailing that answer is the first step.

The market is crowded, and every vendor promises the world. Just a quick glance shows how many options are out there.

Two business professionals analyzing a platform checklist and data on tablets during a collaborative meeting.

Each platform offers a different cocktail of features, integrations, and pricing models. That’s why having a clear evaluation plan before you ever book a demo is so critical.

Actionable Checklist for Platform Evaluation

Don't get hypnotized by long feature lists. Instead, tie every feature back to a strategic goal. Use this checklist during your research and demo calls to stay focused on what matters.

  • [ ] CRM Integration: Is it a seamless, native, two-way sync with your CRM (like Salesforce or HubSpot)? This is non-negotiable for aligning sales and marketing.
  • [ ] Lead Scoring Flexibility: Can you build custom scoring models based on both demographics (job title, company size) and behavior (pages visited, content downloaded)? Test its limits.
  • [ ] Reporting and Analytics: Does it have intuitive dashboards that can track campaign performance and, critically, attribute revenue back to your marketing efforts? Can it measure your MQL-to-SQL conversion rate easily?
  • [ ] Workflow Builder Usability: Is the interface for building automated campaigns a drag-and-drop visual editor, or does it require technical expertise? Your marketing team needs to be able to use it without constant help.
  • [ ] Scalability and Pricing: Does the pricing model punish you for success (e.g., steep jumps in cost per contact)? Ensure it can grow with your business without breaking the bank.

If you're trying to weigh your options, a good marketing automation tools comparison guide can be a huge help for seeing how different platforms stack up side-by-side.

Comparing Traditional vs AI-Native Platforms

The biggest shift happening in automation right now is the rise of AI. Traditional platforms are great at following orders—they run on pre-set, rule-based workflows you have to build and maintain. But AI-native systems bring an entirely new layer of intelligence to the table, one that can adapt and optimize on its own.

An AI-native platform doesn't just execute the commands you give it; it learns from your data to suggest better strategies, predict customer behavior, and personalize content at a scale that is impossible for a human team to manage manually.

This isn’t just a minor upgrade; it’s a fundamental difference in how the machine thinks. Here’s a quick breakdown to help you understand the practical differences.

Comparing Traditional vs AI-Native B2B Automation Platforms

FeatureTraditional AutomationAI-Native Automation (e.g., marketbetter.ai)
Workflow LogicFollows rigid "if-this-then-that" rules set by a marketer.Dynamically adapts journeys based on real-time behavior and predictive models.
PersonalizationUses basic segmentation (e.g., by industry or job title).Creates 1:1 personalization using dynamic content and predictive recommendations.
Lead ScoringRelies on manually assigned point values for specific actions.Uses predictive models to score leads based on their likelihood to convert.
AnalyticsProvides historical reports on past campaign performance.Offers predictive insights, forecasting future trends and identifying opportunities.

While a traditional platform can make you more efficient, an AI-native system is built to make your entire marketing operation smarter. You can explore a curated list of modern AI marketing automation tools to see how these advanced capabilities are already being used.

Ultimately, the choice comes down to this: do you need a tool that just follows instructions, or one that helps you write a better playbook?

An Actionable Implementation Roadmap

A beast of a marketing automation platform is like a race car engine sitting on a pallet. It’s got all the power in the world, but it’s useless without a chassis, wheels, and a driver who knows the track. Just buying the software won’t get you to the finish line. Winning depends on a smart, strategic rollout that connects the tech to your team and your process.

This roadmap breaks it all down into simple, manageable phases. The goal isn’t to try and automate everything on day one—that’s a recipe for disaster. It’s about nailing an early, high-impact win to get some momentum and prove this thing actually works.

Phase 1: Laying the Foundation (Weeks 1-2)

Before you even think about building a workflow, you have to decide what a "win" looks like. The number one reason these projects fail is that teams jump into the software without a clear plan. This first part is all about strategy.

Your first few steps need to be focused and collaborative:

  1. Pick One Big Problem: What’s the single most important thing you need to solve? Is it getting more sales-qualified leads (SQLs)? Slashing the time it takes to close a deal? Getting better quality leads in the door? Choose one primary goal for your first pilot project.
  2. Get Sales and Marketing on the Same Page: This is absolutely non-negotiable. Both teams have to agree on exactly what a marketing-qualified lead (MQL) and an SQL are. When everyone shares the same definitions, you kill the classic "marketing keeps sending us junk leads" argument before it starts.
  3. Audit Your Content Arsenal: You can’t nurture anyone without having something valuable to say. Map out your existing assets—whitepapers, case studies, blog posts—and see how they line up with different stages of your buyer’s journey. Find the gaps you’ll need to fill before you launch anything.

The smartest automation strategies start small. Instead of trying to automate the entire customer journey at once, just pick one high-value process. A simple "welcome" series for new subscribers is a perfect place to start. It's easy to build and gives you immediate, measurable engagement right out of the gate.

Phase 2: Data and Technical Setup (Weeks 2-3)

Okay, with the strategy locked in, it’s time to get your hands dirty with the technical stuff. Your automation platform is only as smart as the data you feed it. If it’s garbage in, it will be garbage out, and your entire effort is doomed.

This phase is where you make sure the system actually runs and your messages get delivered.

  • Data Cleanup and Integration: Make this your top priority. Go through your existing contact list and clean it up—get rid of duplicates, fix typos, and standardize your fields. Then, set up a solid, two-way sync with your CRM. This is crucial for making sure marketing and sales are always looking at the same, up-to-the-minute info.
  • Technical Configuration: Grab someone from your IT team to help with the essentials, like setting up your sending domains (SPF/DKIM) to make sure your emails actually hit the inbox. This one step keeps your carefully written messages from getting flagged as spam.

Phase 3: Building Your First Campaign (Weeks 3-4)

Finally, it’s time to build something. Remember that goal from Phase 1? Here’s where you bring it to life. We’ll stick with the lead welcome series example.

Think of this workflow as your digital handshake. It’s the very first impression a new lead gets of your brand, so you want to make it a good one.

Here’s a no-nonsense way to get it done:

  1. Map it Out: Grab a whiteboard and sketch out the journey. What kicks off the sequence (like a form fill)? How many emails are you sending? What’s the timing between each one?
  2. Create Your Assets: Write the email copy, design the templates, and build any landing pages you need. Make sure every single piece of content pushes the user toward a specific action.
  3. Start Simple with Lead Scoring: Don't go crazy here. Just assign points for a few key actions inside this one workflow. For example: +5 points for opening an email, +10 for clicking a link to a case study, and +25 for checking out the pricing page.
  4. Test. Test. And Test Again: Send it to yourself. Send it to your team. Make sure every link works, every personalization tag pulls the right data, and the whole thing fires off exactly as you planned.

By starting with a simple but meaningful campaign, you get a tangible win that builds confidence across the company. That early success becomes the bedrock for all the more complex business to business marketing automation you’ll build later, turning that new software into an engine that actually drives revenue.

Measuring What Matters with Automation KPIs

Putting a new marketing automation system in place without knowing how to measure success is like flying a plane blind. You’re moving, but you have no idea if you’re gaining altitude or heading for the mountains. In the world of B2B marketing automation, success is written in data. You absolutely have to track the right Key Performance Indicators (KPIs) to prove the value of your investment and fine-tune your strategy.

To make this practical, let's break the metrics down into three critical areas. This structure helps you build a performance dashboard that tells a clear story, from the first touchpoint all the way to a closed deal.

This simple flow shows the core steps to getting your automation engine running.

A diagram illustrating the B2B automation flow with three steps: Plan (lightbulb), Data (database), and Launch (rocket).

Each stage builds on the last, making sure that when you finally hit "launch," your campaigns are backed by a solid plan and clean, reliable data.

Gauging Lead Generation Health

This first bucket of KPIs tells you if the top of your funnel is actually working. We're looking at both the volume of leads coming in and, far more importantly, the quality of those leads your automation platform is attracting and sorting.

  • Cost Per Lead (CPL): Think of this as your efficiency baseline. Just divide your total campaign spend by the number of new leads you got. If your CPL is creeping up, it’s a red flag that your targeting might be off or your creative isn't landing.
  • Marketing-Qualified Lead (MQL) to Sales-Qualified Lead (SQL) Conversion Rate: This is the big one. It’s the ultimate test of whether marketing and sales are on the same page. A low conversion rate here almost always means marketing’s idea of a “good lead” isn’t what the sales team needs to actually close business.

These metrics are your foundation. To go a level deeper, check out our guide on essential lead generation key performance indicators.

Analyzing Campaign Effectiveness

Okay, so you've got leads in the door. Now you need to know if your nurture campaigns are doing their job. These metrics measure engagement and tell you if your content is actually resonating with your audience.

An effective automation strategy isn't just about sending emails; it's about starting conversations that guide prospects through their buying journey. If your engagement numbers are flat, your message isn't connecting.

A couple of key metrics to keep a close eye on:

  • Email Engagement Rates: Go beyond basic open rates—they can be misleading. The real story is in your click-through rates (CTR) and, even better, the conversion rates from those clicks. That tells you who’s taking action.
  • Landing Page Conversion Rates: Your landing pages are where value gets exchanged. A low conversion rate is a clear sign of a disconnect between your ad, your offer, and the on-page experience.

Connecting Automation to Revenue

This is where the rubber meets the road. These KPIs draw a straight line from your marketing activities to the company’s bottom line, making the value of your automation platform impossible for leadership to ignore.

The pressure to prove this connection is only growing. By 2025, digital channels are expected to handle about 80% of all B2B sales interactions. On top of that, 74% of sales professionals believe AI will fundamentally change how they work, cementing automation as a non-negotiable part of the sales process. You can discover more insights about sales automation trends from Kixie.com.

To show the real financial impact, focus on these two metrics:

  • Sales Cycle Length: How long does it take to convert a brand-new lead into a paying customer? A good automation system should shrink this timeline by handing off better-qualified, sales-ready leads.
  • Marketing-Influenced Revenue: This metric tallies up the total revenue from all the deals that marketing touched. It’s a powerful way to show exactly how your team’s efforts are fueling the company’s growth.

Common B2B Automation Traps (and How to Sidestep Them)

Even the slickest marketing automation platform can turn into an expensive, dust-gathering subscription if you're not careful. The dream is efficiency and scale. The reality, for many, is a mess of broken workflows and frustrated teams.

So, how do you avoid the potholes? It's not about working harder; it's about starting smarter. Most teams stumble not because of a lack of effort, but because they skip the foundational work.

Fortunately, the biggest traps are well-known, and each one has a clear escape route.

Mistake 1: Trying to Boil the Ocean on Day One

It’s so tempting. You get the keys to your new platform and immediately try to map every "if-then" scenario for the entire customer journey. You sketch out a monstrous, multi-branched workflow that accounts for every possible click, download, and email open.

This is a classic rookie move, and it almost always ends in disaster. What you're left with is a system that's a nightmare to build, impossible to debug, and takes months to produce a single result.

The better way? Start with a single, quick win.

  • Actionable Fix: Pick one high-impact process and nail it. A simple welcome series for new demo requests is a perfect candidate. So is a re-engagement campaign for leads that have gone cold. Get a simple, clean workflow live, prove its value, and build momentum from there.

Mistake 2: Ignoring Your Data Problem

Think of your automation platform as a high-performance engine. Your data is the fuel. Pumping it full of garbage—duplicates, missing fields, inconsistent formatting—is like pouring sand in the gas tank.

It grinds everything to a halt. Worse, it leads to cringe-worthy personalization fails, like calling a CEO by the wrong first name or sending a case study about the wrong industry. Automation doesn't fix bad data; it puts a megaphone to it.

Crucial Takeaway: Your marketing automation tool will only amplify the data problems you already have. Cleaning up your data isn't a "nice-to-have" pre-launch step. It's non-negotiable.

  • Actionable Fix: Before you even think about migrating contacts, do a ruthless data audit. Merge duplicates, standardize job titles, normalize company names, and fill in the blanks. Just as important, set up validation rules on your forms to stop bad data from getting into your system in the first place.

Mistake 3: Using Your New Tool as a Spam Cannon

You just bought a sophisticated platform designed for personalization at scale. The absolute worst thing you can do is upload your entire database and blast everyone with the same generic newsletter.

This is the fastest way to torch your email list and tank your sender reputation. It completely misses the point of automation, which is to deliver the right message to the right person at the right time. Treating your platform like a glorified email-blasting service will send your unsubscribe rates through the roof.

Your goal is to make every touchpoint feel personal, even when a machine is doing the work.

Here’s your actionable plan to avoid being a spammer:

  1. Segment Like a Pro: Don't talk to a CFO the same way you talk to a Head of Engineering. Use your buyer personas to create different communication tracks with content that actually speaks to their specific pains and priorities.
  2. Use Dynamic Content: Most platforms let you swap out blocks of content in an email—like a specific customer quote or a relevant case study—based on the recipient's industry or title. It’s a simple move that makes your outreach feel instantly more relevant.
  3. Map Content to the Buyer’s Journey: Someone who just downloaded their first-ever whitepaper isn't ready for a pricing sheet. Make sure the content you send matches where they are in the decision-making process. Nurture them; don't shove them.
Free Tool

Try our Marketing Plan Generator — generate a complete AI-powered marketing plan in minutes. No signup required.

Got Questions About B2B Automation? We've Got Answers.

Even after you see the potential, diving into the world of marketing automation can bring up a few "what ifs" and "how does thats." It's totally normal. Here are the straight answers to the questions we hear most often.

How Much Does B2B Marketing Automation Actually Cost?

This is usually the first question out of the gate, and the honest answer is: it really depends. The price tag is almost always tied to two things: how powerful the platform is and, more importantly, how many contacts you have in your database.

Here’s a rough breakdown:

  • For startups and small businesses: You can get started with core features like email nurturing and simple workflows for $50 to $300 a month.
  • For mid-market companies: As your needs grow, so does the price. Expect to pay somewhere between $800 and $3,000 per month for platforms with deeper CRM integrations, lead scoring, and solid analytics.
  • For enterprise teams: The sky's the limit. Top-tier platforms with predictive AI, custom reporting, and white-glove support can easily run $3,000+ per month.

But remember, cost is only half the equation. If a $1,000-per-month platform helps your team land just one extra $10,000 deal, it’s already paid for itself ten times over.

How Long Will It Take to Get This Running?

This isn't like flipping a switch. A successful rollout is about much more than just the software—it's about your strategy, your data, and getting your team on board. The best approach is always to start small and build from there.

One of the biggest mistakes we see is trying to build the "perfect" system right from day one. Instead, aim for a quick win. You can get a pilot campaign up and running in as little as 2-4 weeks, while a full, company-wide implementation might take 3-6 months.

Your timeline will really hinge on a few key things:

  1. Your Data Quality: Be honest—is your contact data a clean, well-oiled machine or a bit of a mess? Data cleanup can easily be the most time-consuming part of the whole process.
  2. Team Readiness: Is your team excited and trained for new ways of working, or is there some hesitation?
  3. Integration Complexity: Hooking into a standard CRM like Salesforce or HubSpot is usually straightforward. Custom-built systems or complex integrations will definitely add time.

Is Automation Really a Good Fit for a Small Business?

Absolutely. In fact, for a small team, automation isn't just a nice-to-have; it's a force multiplier. It gives a handful of people the power to execute a marketing strategy that would normally require a much, much bigger team.

A small business doesn't need a sprawling enterprise system. A basic platform can handle the crucial but repetitive stuff—like lead follow-ups, welcome emails, and data entry—freeing up your team to focus on building relationships and closing deals. Those are the things you can't automate. The trick is to pick a platform that can grow with you.


Ready to see how an AI-native platform can accelerate your growth without all the complexity? marketbetter.ai brings content creation, campaign optimization, and personalization together in one smart system. Discover the future of B2B marketing.

The 2026 Marketing Tech Stack: What $500/mo vs $50K/mo Actually Gets You

· 28 min read

A marketing tech stack is the collection of software that marketing teams use to actually get work done—planning campaigns, running them, and seeing what worked. Think of it like a professional chef's kitchen. It’s not just a pile of pots and pans; it's a curated set of tools like CRMs, analytics platforms, and automation software that all work together. This integrated system is the engine that drives modern marketing.

Decoding Your Marketing Technology Arsenal

Imagine trying to build a house with nothing but a hammer. You could probably put a basic frame together, but it would be wobbly, inefficient, and definitely wouldn't pass inspection. The same logic applies to marketing. If you’re leaning on just one or two disconnected tools, like using an email platform that doesn't sync with your sales CRM, you’re limiting your ability to connect with customers, understand what they’re doing, and prove your impact on the business.

A marketing tech stack, or "martech stack," fixes this by combining specialized tools into a single, cohesive system. It’s not just a random shopping spree on a software marketplace; it's a strategically assembled group of technologies designed to support each other. Actionable Tip: To see this in action, map your current customer journey from first touch to final sale. Identify where data is being dropped or manually transferred. Those gaps are the first places to target for better tool integration. For example, your website's analytics tool should be feeding data into your email marketing platform, which then updates customer profiles inside your CRM. That interconnectedness is what makes a stack so powerful.

The Shift from Optional to Essential

Not too long ago, having a few solid marketing tools was a nice-to-have, a competitive edge. Today, it’s table stakes. It’s a fundamental requirement for survival, let alone growth. The reason is pretty simple: customer expectations have completely changed. People now demand personalized experiences, relevant content, and smooth interactions everywhere they engage with you. A well-designed martech stack is really the only way to deliver on that promise at scale.

You can see this shift reflected in where companies are putting their money. The global martech market isn’t just growing; it's exploding.

In 2024, the market was valued at $465.18 billion and is projected to skyrocket to over $1.38 trillion by 2030. On average, marketing teams now dedicate 31.4% of their total budgets just to technology. That alone tells you how central it's become to modern strategy. Explore the full market trends to see how these investments are shaping the future of marketing.

This spending isn't just about collecting shiny new software. It’s about building a robust foundation to automate the repetitive grunt work, get much deeper customer insights, and, most importantly, prove marketing’s direct contribution to revenue.

Why a Strategic Stack Matters More Than Ever

A thoughtfully constructed marketing tech stack does a lot more than just make a marketer's job easier. It directly impacts the bottom line by turning marketing from what some executives still see as a cost center into a predictable revenue driver. Here's a direct comparison of a team with and without a strategic stack:

  • Improved Efficiency: Without a stack, a marketer might spend 5 hours a week manually exporting email lists and importing them into another system. With an integrated stack, this task is automated, freeing up those 5 hours for high-value strategic work.
  • Deeper Customer Understanding: When you integrate data from different touchpoints—website visits, email clicks, social media engagement—you can finally build a comprehensive, 360-degree view of your audience.
  • Enhanced Personalization: A generic email blast might get a 2% click-through rate. A personalized email, powered by data from your stack showing a user's browsing history, can easily achieve a 5-7% rate, directly boosting conversions.
  • Data-Driven Decision Making: You can finally stop relying on guesswork. With the right analytics and reporting tools, you can measure exactly what’s working, what isn’t, and optimize your campaigns for much better results.

Deconstructing the Core Components of a Modern Stack

Building a marketing tech stack can feel like assembling a high-performance engine without the instruction manual. With thousands of tools clamoring for your attention, it’s easy to get lost. The secret? Stop thinking about individual software and start thinking in terms of core functions.

Think of it like building a car. You need an engine, a chassis, and a navigation system. Your martech stack is no different—it requires distinct, powerful components that work together to drive your marketing forward. By grouping tools into these foundational pillars, you get a clear map for navigating the crowded landscape.

Diagram illustrating a marketing tech stack with personalization, automation, data, and personal profiles.

This isn’t just about collecting logos for a slide. A winning stack is a strategic system, one designed to turn raw data into automated, deeply personal customer experiences.

Let's break down the essential pillars that every modern stack is built on.

The table below outlines these foundational pillars, their primary jobs, and the types of tools that fit within each.

Core Marketing Tech Stack Components and Functions

PillarCore FunctionExample Tool Types
Data & AnalyticsCollecting, unifying, and interpreting customer data to guide strategy.CRM, Analytics Platforms, CDP, Business Intelligence (BI) Tools
Content & ExperienceCreating, managing, and delivering consistent brand messaging and experiences.CMS, SEO Tools, Digital Asset Management (DAM), Landing Page Builders
Automation & EngagementExecuting campaigns and nurturing leads at scale across multiple channels.Marketing Automation, Email Marketing, Social Media Management, AdTech
Management & OperationsOrganizing workflows, fostering team collaboration, and ensuring efficiency.Project Management Software, Collaboration Platforms, Budgeting Tools

Each of these pillars is crucial. A stack missing any one of them will struggle to perform, much like a car missing a wheel.

The Brain: Data and Analytics

This is the central nervous system of your entire marketing operation. It’s where you collect, store, and make sense of customer data to understand behavior, track performance, and make smart decisions. Without a solid data foundation, the rest of your stack is flying blind.

Tools in this pillar are all about answering the big questions: "Who are our most valuable customers?" and "Which campaigns are actually driving revenue?"

  • Customer Relationship Management (CRM): This is your single source of truth. A platform like Salesforce is a powerhouse for large sales-driven organizations, offering deep customization. In comparison, HubSpot's CRM is known for its user-friendly interface, making it a great choice for teams that need to get up and running quickly.
  • Analytics Platforms: Tools like Google Analytics give you a clear view of website traffic and user behavior, helping you see how people find and engage with you online.
  • Customer Data Platforms (CDP): A CDP is built to unify messy customer data from multiple sources into a persistent, single customer profile. To see how these systems tie everything together, check out our guide on customer data platform integration.

The martech landscape is always in motion, with the number of available solutions ballooning to an incredible 15,384 in 2025. One key shift is that while CDPs remain important, cloud data warehouses are emerging as the true core of modern data architecture, offering more power and flexibility.

The Voice: Content and Experience

If data is the brain, then content is the voice your brand uses to speak to the world. This pillar covers all the tools you use to create, manage, and deliver compelling experiences across your website, blog, and social channels. It’s all about making sure your message is consistent, engaging, and easy to find.

A specialized tool, like a ChatGPT rank tracker free tool, can easily slot into this pillar to sharpen your SEO and content strategy.

  • Content Management System (CMS): The backbone of your digital presence. Platforms like WordPress offer unmatched flexibility with a vast ecosystem of plugins, making it ideal for custom sites. In contrast, a CMS integrated into an all-in-one suite like HubSpot provides simplicity but less customization.
  • SEO Tools: You can't just create content; it has to be discoverable. Tools like Semrush offer a broad suite of features including competitor analysis and PPC data, while a tool like Ahrefs is often praised for its superior backlink index. The right choice depends on whether you need an all-around tool or best-in-class backlink data.

The Conductor: Management and Operations

Finally, you need the tools that keep your marketing team organized, productive, and pulling in the same direction. These platforms are the conductors of your marketing orchestra, making sure every instrument plays in perfect harmony.

A well-managed stack isn’t about having the most tools. It’s about having the right tools working together seamlessly to make your team’s life easier.

This category covers everything from high-level campaign planning to day-to-day communication.

  • Project Management Software: Forget endless email chains and missed deadlines. Tools like Asana are great for task-driven, recurring workflows, while Trello excels with its visual Kanban board approach, ideal for managing content pipelines.
  • Collaboration Platforms: Real-time communication is non-negotiable for agile marketing teams. Platforms like Slack or Microsoft Teams keep everyone aligned, making file sharing and quick decisions a breeze.

Choosing the Right Tools for Your Business

Picking the right software for your marketing stack can feel like wandering through a massive trade show floor, with hundreds of vendors vying for your attention. The trick is to walk in with a plan, not just chase the shiniest new toy. A little discipline here goes a long way, ensuring you end up with tools that solve real problems, play nicely together, and actually get used by your team.

The most common mistake? Starting with the tool. Before you even look at a demo, you need to know what you’re trying to accomplish. Actionable Step: Define 3-5 key business goals (e.g., boost lead quality by 20%, cut content production time in half) and write them down. Every tool you evaluate must directly support one of these goals.

Once you know your goals, you can map them back to specific needs. Don't fall for a laundry list of features; fall for a solution that fixes your biggest headaches.

Create Your Vendor Evaluation Scorecard

To keep things objective, build a vendor scorecard. It's a simple but powerful way to rate tools against a consistent set of criteria—the stuff that actually matters to your business. This little document stops you from getting wowed by a slick sales pitch and keeps the decision grounded in reality.

Your scorecard should hit a few key areas:

  • Core Functionality: Does this thing actually solve the main problem I have? How well does it handle the absolute must-have functions?
  • Integration Capabilities: How easily does it connect to our existing systems, especially the CRM and data warehouse? Bad integrations create painful data silos and endless manual work.
  • Ease of Use: Is the interface intuitive? A powerful tool that nobody can figure out is just an expensive paperweight.
  • Support and Community: What kind of customer support can we expect? Is there an active user community where the team can troubleshoot and learn from others?
  • Total Cost of Ownership (TCO): Look past the sticker price. You need to factor in implementation fees, training costs, and any required add-ons to see the real investment.

Assessing Integration and Total Cost

Integration isn’t just a checkbox; it's the glue that holds your entire marketing stack together. A tool that can't talk to your CRM or analytics platform will quickly become an expensive, isolated island of data. Always, always ask vendors for specific examples of integrations with the tools you already rely on.

Likewise, calculating the Total Cost of Ownership (TCO) is non-negotiable. One platform might look cheaper on paper but requires a pricey consultant to get it running. Another might have a higher monthly fee but includes unlimited support and training, saving you a fortune in the long run.

The true cost of a marketing tool isn't just the price tag. It's the combined cost of the software, implementation, training, and the internal resources needed to manage it effectively.

Run a Pilot Program Before You Commit

Never sign a big software contract without a trial run. The only way to truly vet a tool is to run a pilot program with the people who will be in it every day. This hands-on testing will uncover usability quirks and integration snags that you’d never catch in a polished demo.

Actionable Step: Set clear success metrics for the pilot. For instance, if you're testing a new automation platform, the goal might be to "build and launch three specific nurture campaigns within 30 days." This gives you concrete data to base your final decision on, not just feelings.

This is also where curated lists can save you a ton of research time. If you're focused on paid media, for example, starting with a comparison of the top Facebook Ads automation tools can narrow the field quickly.

By getting your team involved from the start, you also build internal buy-in, which dramatically boosts the odds of successful adoption later. This structured process turns a daunting choice into a smart, strategic decision. And as you get deeper, it’s worth looking ahead—our guide on AI marketing automation tools can give you a peek into where the industry is heading.

Comparing Stack Architectures: All-in-One vs. Best-of-Breed

Picking your marketing tech stack architecture is a lot like choosing a car. You can buy a reliable, all-in-one family sedan that does everything pretty well, or you can build a custom hot rod from the best parts on the market. Both will get you down the road, but they offer wildly different experiences.

This is the core debate: the unified all-in-one suite versus the specialized best-of-breed approach. There’s no single "right" answer here. The best fit comes down to your team's size, technical chops, budget, and where you plan on driving your business.

A desk with a monitor, tablet, and laptop displaying business software interfaces, highlighting 'All-in-one vs Best'.

The All-in-One Suite: The Unified Command Center

An all-in-one platform like HubSpot or Salesforce Marketing Cloud is your central command center. Think of it as a Swiss Army knife for marketing—it has a tool for almost every job, all neatly folded into one package. The big draw is simplicity. Everything is built to work together from day one.

This approach is a godsend for teams that value ease of use and need a single source of truth for their data. You get one vendor, one bill, one support number, and a consistent interface for your marketing automation, CRM, and content. It just works.

But that convenience has a price. While an all-in-one suite is good at many things, it’s rarely the absolute best at any single one. You might find its SEO tools can't hang with a dedicated platform, or its social scheduling is a bit basic. You also run the risk of vendor lock-in, making it a massive headache to ever leave because your entire marketing world lives in that one ecosystem.

The Best-of-Breed: The Composable Powerhouse

The best-of-breed (or "composable") approach is the polar opposite. Instead of one tool to rule them all, you hand-pick the top-performing software for each specific task and stitch them together. Your stack might look something like Salesforce for CRM, Marketo for automation, Semrush for SEO, and Slack for team chat.

This route gives you incredible power and flexibility. Your team uses the most advanced tools on the market, letting you build a high-performance marketing engine tailored to your exact needs. If a better analytics tool comes along next year, you can swap it in without blowing up your entire operation.

The catch? It’s a lot more work. Juggling multiple vendors, contracts, and invoices adds a layer of administrative pain. The real challenge, though, is getting all these different systems to talk to each other. This requires dedicated tech resources or integration platforms (iPaaS) to keep data flowing smoothly. The integration headache is the single biggest drawback to this powerful model.

A best-of-breed stack offers maximum capability but demands technical maturity. An all-in-one suite provides streamlined efficiency but may limit functional depth. The choice reflects your company's core priorities.

The decision between these two models really comes down to an honest look at your organization. Do you have the in-house talent to manage complex integrations? Or does your team need a user-friendly system they can run with immediately? Nailing this down is the first real step toward building a tech stack that actually helps you win.

All-in-One Suite vs. Best-of-Breed Stack Comparison

To make the decision clearer, here’s a side-by-side look at how these two architectures stack up across key business criteria. Use this table to map your own team’s needs, budget, and technical skills to the approach that makes the most sense.

CriteriaAll-in-One Suite (e.g., HubSpot)Best-of-Breed/Composable (e.g., Salesforce + Marketo + Slack)
FunctionalityBroad features covering most needs; a "jack of all trades, master of none."Deep, specialized functionality from category-leading tools.
Ease of UseHigh. Unified interface and pre-built integrations make for a smoother user experience.Variable. Requires users to learn multiple systems, each with its own UI/UX.
IntegrationSeamless. All components are designed to work together out of the box.Complex. Requires significant technical effort or iPaaS tools to connect disparate systems.
Flexibility & CustomizationLimited. You're confined to the vendor's ecosystem and feature roadmap.High. You can swap tools in and out as needs change or better technology emerges.
Data ManagementCentralized. A single, unified database provides a "single source of truth."Decentralized. Risk of data silos if integrations aren't managed properly.
Vendor ManagementSimple. One contract, one point of contact for support and billing.Complex. Involves managing multiple contracts, invoices, and support relationships.
Cost StructureOften a single, predictable subscription fee. Can be cost-effective for broad needs.Can be higher overall due to multiple subscriptions, plus hidden costs for integration/dev work.
InnovationSlower. Tied to a single vendor's development cycle and priorities.Faster. Can adopt new, cutting-edge tools from innovative startups as they appear.
Best ForTeams prioritizing simplicity, unified data, and speed-to-value without deep technical staff.Mature teams with specific, advanced needs and the technical resources to manage complexity.

Ultimately, there's no universally "better" option. An all-in-one suite is perfect for a team that needs to get up and running quickly with a solid, integrated foundation. A best-of-breed stack is built for the expert team that needs elite performance from every single tool in its arsenal and has the resources to make it all sing in harmony.

Actionable Sample Stacks for Different Business Stages

Theory is one thing, but seeing a marketing tech stack in the wild is another. A stack isn't a one-size-fits-all purchase; it’s a living thing that evolves right alongside your company. What works for a five-person startup will absolutely cripple a global enterprise, and vice versa.

To make this real, I've mapped out three sample stacks for distinct business stages. Think of these less as rigid prescriptions and more as battle-tested blueprints you can adapt for your own needs. They show how the mission changes at each phase of growth—and how your tools have to change with it.

Wooden blocks with business icons, a laptop, and the text 'Starter to Enterprise' on a desk.

The Lean Startup Stack

When you’re just starting, the name of the game is "do more with less." Every tool has to be affordable, dead simple to use, and focused on the absolute essentials. The goal isn’t fancy automation—it's about planting your flag, figuring out who your first customers are, and getting some initial traction without lighting your cash on fire.

This stack is all about getting the foundational jobs done without the fluff.

  • Analytics: Google Analytics is the non-negotiable first step. It’s free, shockingly powerful, and gives you the core website traffic and user behavior data you need.
  • Email & Basic CRM: Mailchimp is perfect for pulling double duty here. You get simple email campaigns and basic contact management to start building a list and nurturing those first precious leads.
  • Social Media: The free or low-cost tiers of Hootsuite or Buffer are lifesavers. They let you schedule posts across platforms, which buys you back precious time while keeping your social presence consistent.
  • Content: A simple CMS like WordPress gives you a home base. It’s the foundation for your blog and website, letting you publish content without needing to call a developer for every tiny change.

The entire strategy here is pure efficiency. Each tool is picked for its low cost and high utility, allowing a tiny team to cover all the bases without getting lost in complexity.

The Scaling Mid-Market Stack

Once your business hits product-market fit and the growth curve starts ticking up, your tech stack needs to grow up, too. The focus shifts from just getting things done to automating workflows, integrating systems, and building a single source of truth for your customer data. All those manual processes that worked before are now serious bottlenecks.

This is where you either go all-in on a unified platform or start building a tightly integrated "best-of-breed" stack. The mission is to build repeatable, scalable marketing programs that can run without constant manual intervention.

  • CRM & Automation Hub: This becomes the heart of your operation. HubSpot is the classic all-in-one choice, pulling together marketing automation, a solid CRM, and sales tools. Or, you might go for a more composable stack, pairing a powerhouse CRM like Salesforce with a dedicated automation platform like Pardot or Marketo.
  • Advanced SEO: Organic traffic is now a critical growth engine. A tool like Semrush or Ahrefs becomes indispensable for deep keyword research, spying on competitors, and running technical site audits.
  • Data Integration: To kill off data silos before they multiply, a Customer Data Platform (CDP) like Segment is huge. It pulls in customer data from everywhere—your website, app, CRM—and pipes a clean, unified version out to every other tool in your stack.

The mid-market stack is all about the strategic shift from doing things to automating systems. You're building a cohesive engine where data flows freely, enabling real personalization and far more efficient campaigns.

The Enterprise Powerhouse Stack

At the enterprise level, the martech stack is a completely different beast. It’s a sophisticated ecosystem built for massive scale, deep customization, and omnichannel personalization. The off-the-shelf tools of the past give way to powerful, configurable platforms designed to handle immense data volumes and mind-bendingly complex business rules.

The focus here is on bulletproof data architecture and granular control.

  • Experience Cloud: A comprehensive suite like Adobe Experience Cloud often becomes the core. It provides enterprise-grade, interconnected tools for analytics, content management, personalization, and campaign orchestration.
  • Data Warehouse: This is the central nervous system. A cloud data warehouse like Snowflake or Google BigQuery acts as the single repository for all marketing and customer data, becoming the fuel for your business intelligence tools.
  • Advanced Analytics & BI: Basic analytics just won't cut it anymore. Enterprise teams use tools like Tableau to visualize the complex data sitting in their warehouse, uncovering the deep strategic insights that drive major business decisions.

This stack is built for raw power and surgical precision. It gives large, global marketing organizations the control they need to manage complex campaigns and prove marketing's dollar-for-dollar impact on the bottom line.

How to Measure the ROI of Your Marketing Tech Stack

So you’ve invested in a powerful marketing tech stack. That’s the easy part. Now you have to prove its worth. If you can’t show how it’s making or saving the business money, you're just running an expensive hobby.

But when you can demonstrate a clear return on investment (ROI), your stack stops being a line-item expense and becomes a strategic asset in the eyes of the C-suite.

The good news is, measuring this value isn't as daunting as it sounds. It really just comes down to tracking how your tech moves the needle in three key areas: operational efficiency, marketing performance, and long-term strategic growth. With the right metrics, you can build a rock-solid case backed by cold, hard data.

Tracking Efficiency Gains

The first, and most immediate, return you’ll see is time. Your marketing team’s time. Automation tools are built to take over the repetitive, soul-crushing tasks, freeing up your people to focus on strategy and creative work—the stuff that actually requires a human brain.

Actionable Tip: To quantify this, calculate the hours saved on tasks now handled by software. For instance, if your marketing automation platform saves each of your five team members four hours per week on manual email workflows and lead routing, you've just reclaimed 20 hours a week. That’s half of a full-time employee’s salary in strategic thinking time, a direct boost to productivity and a cut in operational drag.

Measuring Performance Metrics

Performance gains are where your stack proves it can directly make the company money. These are the numbers that connect your team's day-to-day activities to actual financial outcomes. The goal here is to show your tools are making your campaigns not just faster, but cheaper and more effective.

Key metrics to keep your eyes on:

  • Lower Customer Acquisition Cost (CAC): Your integrated tools should give you better targeting and personalization, which means less wasted ad spend and more of the right people converting.
  • Increased Conversion Rates: With solid analytics and A/B testing capabilities, you can continuously optimize landing pages and campaigns to squeeze more value out of every visitor.
  • Shorter Sales Cycles: A tightly integrated CRM and automation platform nurtures leads far more effectively, guiding them through the funnel and into the hands of sales much faster.

A well-tuned marketing tech stack should act as a performance multiplier. It doesn’t just do the work; it makes the work you do more valuable by improving key financial indicators like CAC and lead-to-customer conversion rates.

By comparing these metrics from before and after you implemented a new tool, you can isolate its direct financial uplift. For a deeper look at the math, our guide on how to calculate marketing ROI breaks down the formulas.

Assessing Strategic Impact

Finally, the most powerful way to measure ROI is to look at the long-term strategic impact. This goes beyond immediate campaign wins to show how your tech stack is contributing to the overall health and growth of the business. These are the metrics that really get leadership’s attention.

Focus on big-picture KPIs like:

  • Increased Customer Lifetime Value (CLV): Personalization engines and robust CRMs help create better customer experiences, which leads directly to higher retention and more repeat business over time.
  • Improved Attribution Modeling: Advanced analytics tools finally let you connect revenue to specific marketing channels with confidence, proving exactly where your budget is delivering results.

When you combine the story of efficiency, performance, and strategic impact, you build an undeniable case for your technology investments. This data-driven approach doesn’t just justify your budget—it positions the marketing team as a core engine for sustainable business growth.

Free Tool

Try our Tech Stack Detector — instantly detect any company's tech stack from their website. No signup required.

Common Questions (and Straight Answers) About Martech Stacks

Building and running a marketing tech stack is never a straight line. No matter how carefully you plan, real-world questions always pop up. Here are the most common hurdles I see marketing leaders face, along with some no-nonsense advice.

How Often Should I Review My Martech Stack?

Treating your stack like a "set it and forget it" project is a recipe for wasted money and frustrated teams. It’s a living, breathing part of your marketing engine, and it needs regular check-ups to stay in fighting shape.

Here is an actionable review schedule that works best for most companies:

  • Annually: This is your deep-dive audit. Pull everyone into a room and question everything. Is our marketing automation platform still the right fit for our 3-year plan? Are we getting real value from that expensive analytics tool? This is the time to re-evaluate big contracts and make strategic shifts.
  • Quarterly: Think of this as a quick health check. Look for underused tools, integration gaps, or new features you haven’t turned on yet. It’s the perfect time for smaller tweaks and optimizations that keep things running smoothly.
  • Continuously: The best insights often come from the people in the trenches. Keep an open channel for your team to flag issues or suggest better tools. Their daily frustrations are your best early-warning system.

What's the Biggest Mistake to Avoid When Building a Stack?

The single most expensive mistake you can make is buying tools before you have a strategy. It's the classic "shiny object syndrome"—a hot new AI tool hits the market, and suddenly everyone feels like they need it, without a clear problem to solve.

This approach always ends the same way: a cluttered, disconnected mess of subscriptions that nobody really uses.

A marketing tool without a clear business problem to solve is just expensive noise. The goal isn't to collect software; it's to build a system that drives results.

Actionable Tip: Before you even think about booking a demo, force your team to answer these three questions:

  1. What specific business goal will this tool help us hit? (e.g., "increase lead-to-meeting conversion by 15%")
  2. What painful problem does it solve for our team or our customers? (e.g., "stop reps from wasting 5 hours a week on manual data entry")
  3. How will we know if it's working in the first 90 days? What’s the metric?

When you start with strategy, every tool you buy becomes a direct investment in a business outcome, not just another line item on the credit card statement.

How Do I Ensure My Team Actually Uses the New Tools?

Low adoption is the silent killer of martech ROI. A brilliant piece of software is worthless if it just sits there collecting digital dust. The secret to getting your team on board isn't force—it's involvement.

People support what they help create. To drive real adoption, take these actionable steps:

  • Involve them early. Don't just announce a new tool and hand over logins. Bring your power users and team leads into the evaluation process. When they have a say in choosing the software, they’ll have a personal stake in making it work.
  • Provide great training. A link to a knowledge base isn't training. Invest in proper onboarding sessions, designate an internal "champion" for the tool, and offer office hours for the first few weeks. Build their confidence, and they'll build new habits.
  • Show them the "why." This is the most important part. You have to connect the dots between the new tool and their daily work. Clearly demonstrate how it eliminates a tedious task, saves them time, or helps them hit their numbers faster. Once they see the personal benefit, adoption becomes a non-issue.

Ready to build a smarter, more efficient stack? marketbetter.ai integrates AI across content, campaigns, and customer journeys, giving your team the power to prove ROI and drive growth. See how our AI-powered platform can transform your marketing efforts at https://www.marketbetter.ai.

A Guide to Measuring Marketing Effectiveness

· 26 min read

So, what does “measing marketing effectiveness” actually mean?

It’s about figuring out if your marketing is actually doing its job—if it’s hitting your business goals. It's the only way to draw a straight line from what you spend on a campaign to the real money it brings in. Think of it as the ultimate proof that marketing isn't just a cost center, but a revenue driver.

Why Measuring Marketing Effectiveness Matters

A scenic view of a ferry boat on the ocean, a lighthouse on a grassy hill, and a dirt path.

Let's kill a bad idea right now: marketing is not just another line item on a budget. When it’s done right—and measured properly—marketing is the engine for sustainable growth. But without measurement, you’re just guessing. You're spending money and hoping something good happens.

Imagine your marketing strategy is a ship setting sail. Effectiveness isn’t about how fast the ship is moving, which you might track with things like social media likes, ad impressions, or website clicks. Those are vanity metrics. They look impressive on a report, but they don't tell you if you're actually headed in the right direction.

True effectiveness is about whether you’re actually reaching your destination: concrete business goals like more revenue, a bigger slice of the market, and fiercely loyal customers.

Shifting from Activity to Impact

In a world drowning in data, you can't afford to guess anymore. Measuring marketing effectiveness is non-negotiable. It’s the only way to justify your budget, prove your team’s value to the C-suite, and build a tight feedback loop that makes every campaign better than the last. The entire goal is to connect every dollar spent to a tangible business outcome.

Measuring success and allocating budget are two sides of the same coin. In order to make wise budget allocation decisions, we must understand which efforts have been successful and which have not.

This forces a critical conversation about the numbers we choose to watch. Not all metrics are created equal.

Vanity Metrics vs. Business-Impact Metrics

It's easy to get distracted by numbers that feel good but mean very little. Let's compare the two so you can take action and focus on what really moves the needle.

Metric CategoryExamplesWhat It Actually Tells YouActionable Takeaway
Vanity MetricsSocial Media Likes, Impressions, Page ViewsThis shows surface-level activity. It tells you people saw your content, but offers zero insight into whether it changed their behavior or convinced them to buy.Use these as secondary health indicators, but never as your primary measure of success. High impressions with low clicks means your creative or targeting is off.
Business-Impact MetricsCustomer Acquisition Cost (CAC), Return on Ad Spend (ROAS), Customer Lifetime Value (CLV)This directly links your marketing spend to revenue and profit. It tells you if your campaigns are actually generating real, sustainable growth for the business.Make these the headlines of your reports. If ROAS is low, you have a clear mandate: pause the ad, change the offer, or re-evaluate the channel.

See the difference? One makes you feel busy, while the other makes the business money.

The Foundation for Smart Decisions

At the end of the day, a serious commitment to measuring marketing effectiveness lets you answer the big questions. Which channels are bringing in our most profitable customers? How much should we really invest in that new campaign to hit our revenue targets? Which ad copy is actually working?

Without this data, you’re steering the ship with a blindfold on. This guide is your compass. We’re going to move past the surface-level noise and uncover the metrics that signal true business impact and drive smart, forward-thinking decisions.

Choosing the Right KPIs for Your Marketing Goals

So you're convinced that measuring marketing matters. Great. Now comes the hard part: what, exactly, should you be measuring? It’s incredibly easy to get lost in a sea of data, staring at dozens of dashboards that tell you everything and nothing at the same time.

A focused approach is the only way to win. You need to pick the Key Performance Indicators (KPIs) that actually line up with your real business goals. Think of them as your guideposts—the specific numbers that turn a fuzzy objective like "grow the brand" into something you can actually track and improve.

Your KPIs are the turn-by-turn directions on your GPS. Your business goal is the destination. Without the right directions, you're just driving in circles, burning fuel and getting nowhere. Whether you’re trying to build brand awareness, generate high-quality leads, or keep your existing customers happy, your KPIs have to connect directly to that outcome.

Aligning KPIs with Business Objectives

Different goals demand different yardsticks. A campaign designed to get your name out there is going to look very different on a spreadsheet than one built to drive immediate sales. Let's break down how to map the right KPIs to the right job with actionable steps.

  • Goal: Brand Awareness Your mission is to get your brand in front of a wider, relevant audience. Forget just counting impressions—that's a vanity metric. Instead, focus on numbers that suggest people are actually paying attention.

    • Actionable KPIs: Look at social media engagement rate (not just likes), share of voice (how often your brand is mentioned compared to competitors), and tangible increases in direct and branded search traffic.
    • How to Act on It: If branded search traffic is flat, your awareness campaigns aren't memorable enough. It's time to A/B test your core messaging.
  • Goal: Lead Generation Here, we shift from eyeballs to action. Cost Per Lead (CPL) is a classic starting point, but it's dangerously incomplete. A low CPL doesn't mean much if the leads are junk. The real metric to obsess over is the Lead-to-Customer Conversion Rate. This tells you about lead quality.

    • Actionable KPIs: Track CPL, Lead-to-Customer Rate, and Marketing Qualified Leads (MQLs).
    • How to Act on It: Compare the conversion rates from different channels. A channel with a higher CPL but a much higher lead quality is often a better investment. You'd much rather have 10 leads that convert at 50% than 100 leads that convert at a measly 1%.
  • Goal: Customer Retention & Loyalty It's almost always cheaper to keep a customer than to find a new one. To see how you're doing here, you need to be tracking Customer Lifetime Value (CLV), churn rate (the percentage of customers who leave you over a period), and your repeat purchase rate.

    • Actionable KPIs: Monitor CLV, churn, and repeat purchase rate.
    • How to Act on It: If your churn rate ticks up, immediately survey departing customers to find out why. Is it a product issue? A pricing problem? Use that feedback to prevent more customers from leaving.

Practical KPI Comparisons in Action

The "right" KPIs are completely dependent on your business model. A B2B SaaS company and a direct-to-consumer e-commerce brand are playing two totally different sports, even if they're both running digital ads.

Let's compare two scenarios:

Campaign ScenarioB2B SaaS Company (Free Trial Campaign)E-commerce Brand (Holiday Sale)
Primary GoalAcquire qualified product users who will eventually pay.Drive as much revenue as possible in a short, competitive window.
Key KPIs• Trial Signup Rate
Trial-to-Paid Conversion Rate
• Customer Acquisition Cost (CAC)
Return on Ad Spend (ROAS)
• Average Order Value (AOV)
• Conversion Rate
Actionable DecisionIf the Trial-to-Paid Conversion Rate is low, the problem isn't marketing—it's the product onboarding. Time to work with the product team.If ROAS is below your target, immediately reallocate budget from the worst-performing ad set to the best-performing one. Don't wait.

This shows why you need a tailored measurement dashboard. Stop tracking dozens of metrics. Find the handful that give you a crystal-clear, honest view of how you're performing against your specific goals.

Today, digital channels dominate marketing budgets, but measuring their true impact means looking past simple clicks. It's about connecting what you do with what the business earns. It’s no surprise that 89% of top-performing marketers use strategic metrics like gross revenue, market share, and customer lifetime value (CLV) to prove their campaigns work.

When picking your KPIs, understanding the difference between ROI vs ROAS is absolutely critical. ROAS measures the gross revenue you get back for every dollar you spend on ads, while ROI takes all your costs into account to show you the real profit. Getting this right is the key to making smart, sustainable budget decisions.

So, how do you give credit where it’s due?

Imagine this: a customer sees your Facebook ad on Monday, clicks a Google search result on Thursday, and finally pulls the trigger after opening a promo email on Saturday. Which touchpoint gets the high-five for the sale? This is the exact puzzle that marketing attribution solves.

Think of it like a soccer team scoring a goal. The striker who kicks the ball into the net gets the glory, but what about the midfielders who passed it up the field? Or the defender who started the play? Each one played a part. Attribution is just the process of figuring out how much each player contributed.

Without it, you might give all the credit to the last email and slash the budget for the Facebook ad that started the whole journey. Bad move. Good attribution helps you see the entire field, not just the final kick.

From Simple Guesses to Strategic Insights

Attribution models run the gamut from dead-simple to seriously complex. Each one tells a different story about your customer’s path, and picking the right one boils down to your business goals and how long it takes for someone to buy from you. Let's compare the two most basic models.

  • First-Touch Attribution: This one’s easy. It gives 100% of the credit to the very first interaction a customer had with you.
    • Actionable Use: Use this model to identify which channels are best at generating initial awareness. If you need to fill the top of your funnel, optimize the channels that win here.
  • Last-Touch Attribution: This is the most common model because it's the easiest to track. It hands 100% of the credit to the final touchpoint right before the conversion.
    • Actionable Use: Perfect for understanding which channels are your best "closers." If you need to boost end-of-quarter sales, double down on the channels that score high with last-touch.

But here’s the catch: both of these single-touch models have tunnel vision. They completely ignore everything that happens in the middle of the journey—which, let's be honest, is often where the real magic happens.

Attribution isn't just about counting clicks; it's about understanding influence. The real goal is to see the complete picture of how all your channels work together to turn a stranger into a customer.

The Power of Multi-Touch Attribution

If you’re not selling impulse-buy items, you need a clearer view. For businesses with longer sales cycles, multi-touch attribution provides a much more balanced and accurate picture of what’s actually working. These models spread the credit across multiple touchpoints, acknowledging the reality that most sales are the result of a series of nudges, not a single tap.

This decision tree helps visualize how different goals—like building awareness, generating leads, or driving sales—demand different ways of measuring success.

A decision tree diagram showing marketing effectiveness, starting with START, branching into Awareness, Leads, and Sales.

As you can see, your main business objective points you down a specific measurement path, making sure you’re tracking the right numbers at every stage of the funnel.

Which Marketing Attribution Model Is Right for You?

Choosing the right model is a big deal. It dictates where you put your budget and how you measure your team's success. To help you figure out what fits, here's a quick comparison of the most common multi-touch models. Each one offers a unique lens through which to view your customer journey.

Attribution ModelHow It WorksBest ForActionable Insight
LinearSpreads credit evenly across every single touchpoint. A simple, democratic approach.B2B companies with long sales cycles where every interaction plays a role in nurturing the lead.Reveals your "workhorse" channels that consistently contribute across the entire journey, even if they don't open or close the deal.
Time-DecayGives more credit to the interactions that happened closer to the sale.Short-term promotional campaigns or B2C sales cycles where recent touchpoints are most influential.Helps you optimize the final steps of the buyer journey by highlighting what nudges people over the finish line.
U-ShapedGives 40% credit to the first touch, 40% to the last, and divides the remaining 20% among the middle touches.Businesses that highly value both lead generation (the first touch) and conversion (the last touch).If a channel appears often in the middle but gets little credit, it might be a great nurturing channel that you're undervaluing.

At the end of the day, there’s no single "best" model that works for everyone. The right choice is the one that best reflects how your customers actually buy. An e-commerce brand with a three-day sales cycle might be perfectly fine with a Last-Touch or Time-Decay model. But a B2B software company with a six-month sales process? They’d get far more truth from a Linear or U-Shaped model.

For a deeper dive into these frameworks, check out our complete guide to multi-touch attribution models.

Advanced Measurement Frameworks for a Holistic View

Attribution models are fantastic, but they're starting to tell an incomplete story. In a world where privacy rules are getting tighter and third-party cookies are disappearing, leaning entirely on user-level tracking is becoming a risky bet. It’s time to zoom out and bring in frameworks that give you the full, top-down picture of what’s really working.

Think of digital attribution like tracking individual plays in a football game—it shows you who passed the ball and who scored. That's crucial stuff. But these advanced frameworks are like the post-game analysis from the skybox, revealing how things like weather, crowd noise, and even team morale influenced the final score. You absolutely need both perspectives to understand what truly drives a win.

These broader methods help you measure the stuff that’s historically been a black box, like the real impact of a billboard or a TV ad, and see how all your marketing efforts sing together.

Marketing Mix Modeling: The Privacy-First Powerhouse

One of the most powerful top-down approaches is Marketing Mix Modeling (MMM). At its core, this is a statistical method that digs through your historical data—sales numbers, ad spend across every single channel, and even external factors—to measure how much each piece contributed to your revenue.

Instead of tracking individuals, MMM looks at aggregated data over time. It’s built to answer the big, strategic questions like, "For every dollar we put into YouTube ads last quarter, how many dollars in sales did we actually get back?" It also cleverly accounts for all the real-world variables that attribution models completely ignore, such as:

  • Seasonality: How do holiday rushes or summer slumps really affect our sales?
  • Promotions: What was the actual sales lift from our 20% off sale, beyond what we would have sold anyway?
  • Competitor Actions: Did our rival's massive new ad campaign put a dent in our performance?
  • Economic Trends: How is something like inflation impacting what our customers are willing to spend?

This kind of analysis is becoming non-negotiable as old-school digital attribution hits a wall. A recent EMARKETER study found that over 61% of marketers are actively trying to improve their measurement with better and faster MMM solutions. That’s a huge signal that the industry is shifting. You can dive deeper into the latest measurement trends and find more great insights over at Analytic Edge.

Incrementality Testing: Uncovering True Causal Impact

While MMM gives you that crucial 30,000-foot view, Incrementality Testing is all about answering a much more direct question: did my marketing campaign cause an increase in sales that wouldn't have happened otherwise? It’s designed to isolate the true "lift" your ads generated.

The most common way to do this is with a classic A/B test or a lift study. Here’s the simple version: you split your target audience into two groups. The "test group" sees your ad, while the "control group" doesn't. By comparing the conversion rates between the two, you can measure the real, causal impact of that specific campaign.

Incrementality moves you beyond correlation to pure causation. It’s the difference between knowing sales went up while your ad was running, and knowing sales went up because your ad was running.

This is the gold standard for proving the worth of channels that are notoriously tough to measure with last-click attribution, like brand awareness campaigns on social media or video platforms.

Combining Frameworks for a 360-Degree View

So, which one is right for you: attribution, MMM, or incrementality? The real answer is, you need all three. They aren't competing with each other; they're answering different questions at different altitudes, giving you a complete measurement toolkit.

Here’s a comparison of how to put them into action:

Measurement FrameworkPrimary Question AnsweredActionable Use CaseKey Limitation
Attribution ModelingWhich touchpoints deserve credit for a specific conversion?Use daily to tweak bids in Google Ads or optimize creative in your social campaigns for better immediate performance.Struggles with offline channels and is increasingly hamstrung by data privacy.
Marketing Mix Modeling (MMM)How did my total marketing budget and outside factors impact overall sales?Use quarterly for high-level budget planning. Decide if you should shift 10% of your budget from paid search to connected TV next year.Less granular and slower to produce insights compared to digital attribution.
Incrementality TestingDid this specific campaign cause a real lift in conversions?Use for major campaign launches to prove the real value of a new channel or strategy before you scale the budget.Can be complex and expensive to run for every single marketing activity you do.

When you weave these frameworks together, you create a powerful, multi-layered measurement strategy. Use MMM for your high-level budget planning, attribution for the daily grind of digital optimization, and incrementality tests to validate the true impact of your most important campaigns. This integrated approach is how you finally get that holistic view of your marketing effectiveness you've been looking for.

Common Measurement Pitfalls and How to Avoid Them

A desk with a laptop, measuring tape, and blueprints, and a sign saying 'AVOID PITFALLS' in the background.

Even with the slickest frameworks and best intentions, it's dangerously easy to fall into a few classic measurement traps. These aren't just small errors; they're the kinds of mistakes that warp your perception of what's working, leading you to pour money into the wrong channels and starve the ones that are actually driving growth.

Good measurement isn't about getting a number—it's about getting the right number. It's about finding the truth. Let's walk through the most common blunders marketers make and, more importantly, how you can sidestep them.

Confusing Correlation with Causation

This is the big one. It's the oldest trap in the book. You launch a new social media campaign, and sales go up. The campaign must have worked, right?

Not so fast. Maybe a competitor fumbled their inventory. Maybe a good news story about your industry created a halo effect. Correlation just means two things happened around the same time. Causation means one thing made the other happen.

How to Fix It: Stop guessing and start proving. Run incrementality tests (like an A/B test) to isolate the true impact of a campaign.

  • Actionable Step: For your next big Facebook campaign, work with their platform to run a brand lift study. Show your ads to a test group but hold them back from a control group. The difference in their behavior is the real, causal lift your marketing generated.

"The goal is to move beyond observing what happened and start proving what you made happen. That shift from correlation to causation is where true measurement confidence is born."

Getting Trapped by Data Silos

Your customer data is everywhere. It’s in Google Analytics, your CRM, social ad platforms, your email tool—a dozen different systems that don't talk to each other. This creates a horribly fragmented view of the customer journey. You see a new lead pop up in Salesforce, but you have no clue which ad, blog post, or email chain brought them there.

This isn’t just messy; it’s misleading. Nielsen data famously revealed that while marketers often rank radio near the bottom for performance, it frequently delivers some of the highest ROI. Why the disconnect? Because last-click attribution on digital channels is easy to see, so we overvalue it and ignore the bigger picture. You can see more of these surprising ROI findings on Nielsen.com.

Overvaluing Short-Term Wins

Metrics like Cost Per Click (CPC) and daily sign-ups are addictive. They give you that instant hit of feedback. But focusing only on these short-term numbers can trick you into killing your most valuable long-term plays.

A top-of-funnel brand campaign isn't meant to drive a sale today. Its job is to build the awareness and trust that fuels all of your other channels tomorrow. If you judge it by immediate conversions, you’ll always conclude it's a failure and cut the budget, kneecapping your future growth.

How to Fix It: Use a balanced scorecard. Judge each marketing activity by its actual goal.

  • Actionable Comparison:
    • Brand Building (e.g., YouTube Pre-Roll): Track things like share of voice, branded search volume, and social engagement. Goal: Increase branded search by 15% this quarter.
    • Direct Response (e.g., Google Search Ad): Here you can focus on ROAS, CPA, and immediate conversion rates. Goal: Achieve a 4:1 ROAS on this campaign.

Ignoring the Offline World

This is a huge blind spot for digital-first teams: if it doesn't have a tracking pixel, it didn't happen. That thinking can be catastrophic.

Imagine you run a podcast sponsorship that’s absolutely killing it. But because your attribution model can't connect listens to purchases, it looks like a zero on your dashboard. So you cut it. You just killed a high-performing channel because it didn't fit into your neat, pixel-based world.

How to Fix It: Get creative with bridging the offline-to-online gap.

  • Actionable Step: For your next podcast ad, use a unique promo code (PODCAST20) and a vanity URL (yoursite.com/podcast). Ask "How did you hear about us?" in your checkout form. Compare the data from all three sources to get a much truer picture of the campaign's impact.

The Future of Marketing Measurement with AI

The frameworks we've covered are solid, but the next chapter in measuring marketing is already being written, and the author is Artificial Intelligence. AI is taking measurement from a backward-looking chore to a forward-looking strategic weapon. It’s making the whole process smarter, faster, and more predictive than ever before.

Imagine running a complex Marketing Mix Model (MMM) not at the end of a quarter, but almost in real-time. That's the kind of power AI puts on the table. AI-powered platforms can chew through colossal datasets to automate analyses that once took data science teams weeks to finish, handing you insights at the speed you actually need them.

This isn't a small tweak. It fundamentally changes how marketers work.

From Reporting to Predicting

The old way of doing things is looking at last month's report to figure out what broke. AI flips that script completely. The game is shifting from reacting to past performance to proactively shaping future outcomes. We're no longer just asking what happened, but what will happen next.

This is possible because AI is a master at spotting patterns and forecasting what comes next. The future of measurement will lean heavily on predictive modeling techniques supercharged by AI, allowing us to anticipate trends with startling accuracy. Marketers can now make calls based not just on history, but on probable futures.

AI doesn't just show you a dashboard of the past; it gives you a roadmap for the future. It’s the difference between looking in the rearview mirror and having a GPS that sees traffic jams before you hit them.

Actionable AI-Powered Optimization

The real magic of AI in marketing measurement isn't just the data—it's the ability to deliver clear, actionable recommendations. It’s about decision intelligence.

Here’s a practical comparison of the old way vs. the AI way:

TaskOld Way (Manual & Reactive)AI Way (Automated & Proactive)
Budget AllocationYou spend hours in spreadsheets trying to guess the best mix for next quarter based on last quarter's data.Before you spend a dollar, AI runs thousands of budget scenarios to show you the likely ROI of shifting 15% of spend from paid search to Connected TV.
Campaign OptimizationYou notice at the end of the week that a social media campaign's CPA has climbed. You pause it after the money is already spent.AI monitors your campaigns in real-time, spots the underperforming ad, and pings you with a recommendation to reallocate funds to a rising star before you waste more budget.

At the end of the day, AI isn’t here to replace the marketer. It's the indispensable partner we’ve been waiting for. It handles the heavy computational lifting, freeing up human minds to focus on what we do best: creativity, brand storytelling, and high-level strategy. By automating complex measurement and offering predictive insights, AI empowers us to make truly intelligent, data-backed decisions that drive real business growth. Learn more about how you can get ahead with our guide to predictive analytics in marketing.

Free Tool

Try our Marketing Plan Generator — generate a complete AI-powered marketing plan in minutes. No signup required.

A Few Common Questions We Hear

Even with the best game plan, the real world throws curveballs. Once you start digging into the numbers, practical questions pop up fast. Here are a few of the most common hurdles marketers face, along with some straight talk on how to clear them.

"How in the world do I measure my radio ads or print campaigns?"

Measuring offline marketing can feel like shouting into the void and hoping for the best. But you don't have to guess. The trick is to build a simple, trackable bridge from the physical world to your digital one.

The goal is to give people a unique path to follow. For example, a radio ad could mention a specific URL like yoursite.com/radio that you don't link to anywhere else. Anyone who lands there came from that ad. Simple.

Here’s a comparison of ineffective vs. actionable tracking methods:

The Old Way (Low Visibility)The Smart Way (High Visibility)
Running a generic ad and hoping for a sales bump.Using a unique promo code (RADIO20) so you can directly attribute sales.
Putting your main phone number on a billboard.Setting up a dedicated, trackable phone number just for that billboard campaign.
Just telling people to visit your homepage.Adding a QR code that sends them to a specific, measurable landing page.

By creating these dedicated pathways, you're making the invisible impact of your offline channels show up loud and clear in your analytics.

"I have a small team and an even smaller budget. Where do I even start?"

You don't need a massive budget or a data science team to get this right. In fact, trying to track everything at once is the fastest way to get overwhelmed and do nothing. The key is ruthless focus.

Start with the basics. Google Analytics 4 is free and an absolute powerhouse for understanding your website traffic and what people are doing there. It's your ground zero.

The most important first step? Define your one, single, most critical conversion. Is it a purchase? A demo request? A newsletter signup? Whatever it is, focus all your energy on tracking that one action flawlessly before you do anything else.

Once that’s locked in, you can start layering on other metrics. But for a small team, victory comes from nailing the essentials, not from building a dashboard that looks like a spaceship cockpit.

"What’s more important to track—brand awareness or lead generation?"

This is the classic marketing tug-of-war, but it’s a false choice. You don't pick one. You measure both, but you measure them differently, with different yardsticks. Judging a brand campaign by how many leads it generated today is like judging a fish by its ability to climb a tree.

It's much smarter to create two separate scorecards.

  • Actionable Plan for Brand Awareness: Keep an eye on things like branded search volume (are more people Googling your name?), social media engagement, and direct traffic. Set a quarterly goal to increase branded search queries by 10%.
  • Actionable Plan for Lead Generation: This is where you get clinical. Track the hard numbers: Cost Per Lead (CPL), Lead-to-Customer Conversion Rate, and, of course, Return on Ad Spend (ROAS). Set a monthly goal to keep your CPL below $50.

A healthy marketing engine needs both. Your brand-building efforts fill the top of your funnel, which makes all your lead generation work down the line cheaper and far more effective. They work together.


Stop guessing and start optimizing. marketbetter.ai uses AI to connect your marketing spend to real revenue, giving you the clarity to make smarter budget decisions and prove your impact. Discover how our AI-powered platform can transform your marketing measurement.

AI Driven Content Creation 2026: The Practical Workflow (Tested on 50+ Posts)

· 20 min read

So, what exactly is AI driven content creation? It's not about robots taking over your keyboard. Think of it as a super-powered creative partner—like giving your best writer the research skills of a data analyst and the speed of a supercomputer. The goal is to scale your marketing in ways that weren’t possible before by making your team faster, smarter, and more strategic.

What Is AI Driven Content Creation?

A modern workspace with a laptop displaying 'AI CREATIVE PARTNER', a plant, notebook, and bar chart.

At its heart, AI driven content creation means using smart algorithms to generate and optimize content far more efficiently than any human could alone. This isn't a magic button that spits out a perfect, finished article. Instead, it’s a genuine collaboration where the tech does the heavy lifting—research, outlining, drafting—freeing up your team to focus on what humans do best: strategy, creativity, and adding that final, essential polish.

Let's make it actionable. Imagine you need a deep-dive blog post on a tricky subject.

  • The Old Way: Hours of keyword research, sifting through competitor articles, and sketching out an outline before you even type the first sentence. A multi-day process.
  • The AI-Driven Way: An AI tool can crush that entire process down to minutes. It analyzes search data to find what people are actually looking for, spots content gaps your competitors missed, and builds a solid, data-backed outline for you to start with.

The engine behind all this is a combination of generative AI and Natural Language Processing (NLP). These models have been trained on mind-boggling amounts of data, which is why they can grasp context, adopt different writing styles, and produce text that feels surprisingly human.

Traditional vs AI Driven Content Creation At a Glance

The difference between a manual process and an AI-assisted workflow is night and day. One is slow and linear; the other is fast, dynamic, and built for modern marketing demands.

Here’s a quick breakdown of how they stack up.

AspectTraditional Content CreationAI Driven Content Creation
SpeedSlow and methodical, often taking days or weeks for a single asset.Rapid ideation and drafting, reducing timelines from weeks to hours.
ScaleLimited by individual or team capacity, making it difficult to produce high volumes.Nearly unlimited, enabling the production of hundreds of content pieces at once.
Data UseRelies on manual research and intuition for topic selection and SEO.Uses real-time data to identify trends, keywords, and user intent for optimization.
PersonalizationBroadly targeted content; one-to-one personalization is nearly impossible.Enables hyper-personalization, tailoring messages to specific audience segments.

As you can see, the shift isn't just about doing the same things faster—it's about unlocking entirely new capabilities.

The goal isn't to replace human creators but to amplify their abilities. AI handles the repetitive, data-intensive tasks, allowing marketers to focus on the strategic and creative elements that AI cannot replicate.

This isn't just a passing trend; it's a massive market shift. The global AI content creation market was valued at USD 2.15 billion in 2024 and is expected to explode to USD 10.59 billion by 2033. That kind of growth shows just how foundational AI is becoming for content strategy.

If you're looking to understand how this plays out in the real world, our guide on how to use AI in marketing is a great next step. It’s clear that businesses are no longer asking if they should use AI, but how they can integrate it to get ahead.

Why AI Is a Strategic Move for Your Business

A tablet displaying business charts and data, a coffee cup, and a notebook on a wooden desk with "FASTER ROI" text.

Using AI driven content creation isn't a futuristic "what if" anymore. It’s a practical, right-now decision that hits your bottom line. Smart businesses now see AI as the tool that turns content from a cost center into a genuine growth engine. The core idea is simple: AI collapses the time, effort, and money it takes to produce high-value content.

Think about the old way. A single, well-researched blog post could take weeks to get from idea to live. AI compresses that entire timeline, turning weeks into days, or even hours. This isn't just about being faster; it's a massive competitive edge that lets you jump on market trends and own niche topics before your competitors have even finished their keyword research.

Radically Reduce Content Production Costs

The numbers here are impossible to ignore. By automating the most grinding parts of content creation—like initial research, outlining, and first drafts—you free up a serious amount of cash and time. The most immediate win? Less reliance on freelancers or the need to hire more writers just to keep up.

Let's compare the time investment for a single blog post:

TaskTraditional Manual ApproachAI-Assisted Approach
Research & Outlining4-6 hours of a strategist's time30 minutes of prompt refinement
First Draft Writing6-8 hours from a skilled writer1 hour for generation and initial review
SEO Optimization2-3 hours of manual keyword work45 minutes for AI-driven analysis & edits
Total Estimated Time12-17 hours~2.25 hours

The math is brutal. Tools for AI driven content creation can slash production time by over 85%. For any marketing team, that reclaimed time is gold. It lets them stop focusing on the manual grind and start thinking about high-level strategy, creative direction, and what’s actually moving the needle.

Unlock Hidden Revenue Opportunities

This is about more than just saving money. AI opens up growth opportunities that were just too difficult or expensive to chase before. For instance, AI-powered SEO tools can chew through enormous amounts of search data to find profitable, low-competition keywords your team would almost certainly miss with manual research.

Actionable Tip: Use an AI tool to analyze your top 10 competitor websites. Ask it to identify the keywords they rank for that you don't. This five-minute task can reveal dozens of high-intent content ideas to directly feed your sales pipeline.

Adopting AI isn't just about operational efficiency. It's about empowering your team to make smarter, faster decisions that drive tangible revenue growth and build a more resilient content engine for the future.

This is exactly why the market is exploding. Between 2024 and 2029, the market for AI content creation tools is projected to grow by an incredible USD 60.47 billion. That growth is happening because businesses are seeing a clear ROI. You can learn more about the market forces driving AI adoption on Technavio.com.

Scale Personalization and Boost Engagement

Finally, AI gives you the power to personalize content at a scale that's just not humanly possible. Instead of one generic message for your entire audience, you can instantly spin up dozens of variations tailored for different segments, industries, or stages in the buyer's journey.

The impact is immediate:

  • Increased Lead Quality: Content that nails a prospect's specific pain point is far more likely to convert.
  • Better Engagement Metrics: Personalized emails see higher open rates and click-through rates.
  • Stronger Brand Loyalty: Customers feel seen when you deliver content that’s actually relevant to them.

By making your content creation faster, cheaper, and smarter, AI gives you a direct path to a healthier bottom line.

Choosing the Right AI Content Creation Tools

Jumping into AI content creation feels like walking into a massive hardware store for the first time. There are tools for everything, each promising to change the game. The secret isn't finding one magic tool—it's about building a smart toolkit that actually fits your business needs.

If you choose wisely, you’ll build a powerful, efficient content engine. If you don’t, you’ll end up with expensive software nobody uses. The first step is understanding the different types of tools available.

The Three Flavors of AI Content Tools

Not all AI is built the same. Some tools are specialists, designed to do one thing exceptionally well. Others are more like a Swiss Army knife. Your job is to figure out which problems you actually need to solve.

  • The Wordsmiths (Text Generators): Think of these as your workhorse writers. Tools like Jasper are masters at churning out high-quality drafts for blogs, ad copy, and emails. They're perfect for teams that need to scale up written content without losing their brand voice.
  • The Visualizers (Image & Video Creators): Let's face it, visuals grab attention. AI tools like Midjourney or Synthesia make creating custom images or entire videos from a simple text prompt ridiculously easy. If you need compelling visuals but don't have a big design team, these are for you. You can find great comparisons of AI video generator tools that break down the options.
  • The Command Centers (All-in-One Suites): This is where platforms like our own marketbetter.ai or HubSpot's AI tools come in. They don't just create content; they plug it directly into your marketing machine, combining text generation with campaign management, analytics, and personalization.

Feature Comparison of Leading AI Content Tools

To help you cut through the noise, here’s a quick breakdown of how these different tool categories stack up. A flashy feature is only useful if it solves a real problem for your team.

Tool CategoryExample ToolsPrimary Use CaseKey StrengthsIdeal For
Text GeneratorsJasper, Copy.aiScaling written content like blogs, emails, and ad copy.High-quality text output, brand voice consistency, speed.Content marketing teams needing high-volume written assets.
Visual CreatorsMidjourney, SynthesiaCreating custom images and videos from text prompts.Fast visual asset production, creative ideation, cost-effective.Social media managers and creative teams on a budget.
All-in-One Suitesmarketbetter.ai, HubSpotIntegrating content creation with full marketing campaigns.Unified workflow, data-driven insights, personalization at scale.B2B marketing departments focused on ROI and lead generation.

The best strategy usually involves a mix-and-match approach. You might use a specialized text generator to draft blog posts, then plug that content into an all-in-one suite to run the email campaign that promotes it. The goal is synergy, not a single silver bullet.

A No-Nonsense Checklist for Picking Your Tools

Before you pull out the company card, run every potential tool through this simple checklist. It’ll help you get past the marketing hype and focus on what matters.

  1. What’s the Real Problem? Be honest. Is your bottleneck writing blog posts fast enough? Is it the cost of video production? Or is it that your email campaigns feel generic? Pinpoint your single biggest pain point and find a tool that crushes it.
  2. Will Your Team Actually Use It? A powerful tool with a clunky interface is just expensive shelfware. Is it intuitive? Look for a free trial and have your team members test it on a real project.
  3. How Good Is the Output? Run some real-world tests. Give it prompts your team would actually use. Does the output sound like your brand? Critically, how much editing does it need? The best tools let you refine output to meet your standards. For a deeper look, check out our guide on the top social media content creation tools.
  4. Does It Play Well with Others? Your new AI tool must fit into your existing tech stack. Does it integrate with WordPress? Your marketing automation platform? If it doesn’t, you’re just creating more manual work.
  5. What’s the Real Cost? Don't just look at the monthly price tag. Dig into the usage limits—word counts, video minutes, seats. A plan that looks cheap can get expensive fast if you keep hitting the limits.

Your Step-By-Step AI Implementation Plan

Let's get practical. Talking about AI-driven content creation is one thing, but actually wiring it into your daily operations is where the real wins happen. A smart rollout is a phased approach that builds confidence, proves value, and scales without breaking your existing workflow. The key is to start small with tasks that have a clear, immediate payoff. This gets the team on board and gives you tangible results to justify going further.

Phase 1: Start with Low-Risk, High-Reward Tasks

Your first dip into the AI pool should focus on speed and efficiency gains. The goal is to use AI as a smart assistant to slash the time spent on tedious prep work. It’s the safest, fastest way to show your team how this tech makes their jobs easier.

Actionable First Steps:

  • Topic Ideation: Prompt an AI with: "Analyze the top 5 articles for the keyword '[your target keyword]'. Identify common themes and suggest 10 new blog titles that cover a unique angle."
  • Outline Generation: Feed a chosen title back to the AI: "Create a detailed, SEO-friendly blog post outline for the title '[your new title]'. Include H2s, H3s, and bullet points covering key topics."
  • Social Media Snippets: Once a post is written, ask the AI: "Write 5 promotional tweets and 2 LinkedIn posts for this article. Make the tone [witty/professional/etc.] and include relevant hashtags."

By starting here, you prove the concept internally. Your team sees firsthand that AI is great at handling the grunt work, freeing them up to focus on strategy and creativity.

The first phase isn't about replacing writers; it's about supercharging your researchers. Focus on using AI to gather and structure information faster than any human ever could. Turn hours of manual labor into minutes of smart prompting.

This simple framework can help you categorize, compare, and select the right tools for these initial jobs.

A three-step process infographic showing Categorize, Compare, and Select with respective icons.

Breaking down the selection process makes it much easier to pick a tool that solves a specific, nagging problem in your current workflow.

Phase 2: Move on to Drafts and Personalization

Once the team is comfortable using AI for research, it's time to level up. In this phase, AI graduates from research assistant to drafting partner. The focus shifts to generating complete first drafts and creating personalized content at scale. A human-in-the-loop process becomes non-negotiable. The AI generates the initial draft, but a human editor must always review, refine, and add the final layer of brand voice, nuance, and strategic insight.

Here’s a quick look at how the workflow changes:

Workflow StageThe Old Manual WayThe New AI-Assisted Way
First Draft CreationA writer spends 6-8 hours staring at a blank page, crafting a draft.An AI tool produces a solid first draft in less than 30 minutes.
Editing & RefinementAn editor spends 3-4 hours on structural edits and polishing.An editor spends 2-3 hours enhancing the AI draft with expertise.
The ResultA process that eats up a full day, maybe more.A workflow that's 60-70% faster, letting you publish more, faster.

Phase 3: Lock in Governance and Scale Up

The final phase is all about formalizing your process so you can scale your AI-driven content creation without sacrificing quality. This means creating clear guardrails and quality control checkpoints that everyone on the team understands.

Actionable Step: Create an AI Brand Guideline document. It should include:

  1. Tone & Voice Prompts: Give the AI specific, copy-pasteable examples of your brand's voice (e.g., "Write in a helpful, expert tone like a friendly mentor. Use analogies but avoid clichés.").
  2. Formatting Rules: Detail exactly how you want headlines, lists, and other elements structured.
  3. Fact-Checking Protocol: Make it a rule that any statistic, data point, or claim from the AI must be verified against a primary source.

This governance structure is what turns AI from a cool new toy into a core, scalable part of your content engine.

How to Maintain Quality and Ethical Standards

A desk setup with an open book, magnifying glass, keyboard, and plant, displaying 'MAINTAIN TRUST'.

Simply cranking out content faster isn't the point. The real challenge of AI-driven content creation is scaling up your output without torching the quality, accuracy, and trust you’ve worked so hard to build. Without a strong governance framework, AI can quickly dilute your brand and erode your credibility.

The content creation market is projected to hit USD 66.8 billion by 2030. Unchecked automation in this booming space can seriously degrade the quality of information online, a huge problem for brands that rely on expertise to win customers. You can dig into the numbers in this market forecast on Mordor Intelligence.

Adopting a responsible approach is the only way to make sure AI becomes a sustainable asset, not a ticking time bomb.

Building Your AI Governance Checklist

Think of AI governance as the quality control system for your content engine. It's a set of non-negotiable rules and processes ensuring every piece of content meets your standards.

Here’s a practical checklist to get you started:

  1. Mandatory Fact-Checking: Treat every statistic from an AI as a placeholder. It's not real until a human has checked it against a primary source. This is the most critical firewall for maintaining trust.
  2. Originality Audits: Run every AI-generated draft through a reliable plagiarism checker. While these tools aim to create original text, weird overlaps can happen. It’s your job to catch them.
  3. Brand Voice Refinement: An AI can mimic your tone, but it can’t replicate your brand’s soul. Your human editors are there to inject nuance, storytelling, and the kind of strategic messaging that is uniquely yours. An AI content analysis can pinpoint where the AI's output is drifting away from your core voice.

The Rise of the AI Editor

The most important piece of any responsible AI workflow is the human-in-the-loop. This has created a new, vital role on content teams: the AI Editor. This person is more than a proofreader; they're a strategist who guides, refines, and validates what the AI produces.

Traditional Editor RoleModern AI Editor Role
Focuses on grammar, style, and flow of human-written drafts.Guides AI with expert prompts to generate high-quality first drafts.
Spends significant time on structural and developmental edits.Spends more time on fact-checking, adding expertise, and brand alignment.
Works linearly on one piece of content at a time.Oversees and quality-controls multiple AI-generated assets simultaneously.

This role shifts the team's focus from manual creation to strategic curation. The AI Editor ensures technology speeds up the process without ever compromising the integrity of the final product.

Adopting AI responsibly means you never fully outsource your thinking. The technology is a powerful assistant for the "how," but your human team must always own the "why" and the "what."

Finally, using AI ethically is also about how you talk to your audience. The question of whether to disclose AI usage is getting bigger. While there’s no single law on the books yet, transparency is almost always the right call for building long-term trust.

Actionable Tip: Consider adding a simple disclosure at the end of articles where AI played a big role in drafting or research. It shows respect for your readers and signals that you're confident in your quality control. And beyond the content itself, sticking to legal frameworks is crucial; a practical guide to AI GDPR compliance is a good starting point for navigating these complex rules.

Free Tool

Try our Marketing Plan Generator — generate a complete AI-powered marketing plan in minutes. No signup required.

Burning Questions About AI Content

Stepping into AI-driven content always brings up a few big questions. Everyone wants to know about search engine penalties, brand voice, and where to start without breaking the bank. Let's tackle these head-on.

Will Google Punish Me for Using AI Content?

No. Google doesn't care how content is made; they care if it's helpful and high-quality. Their entire E-E-A-T framework (Experience, Expertise, Authoritativeness, Trustworthiness) is the only yardstick that matters.

  • Bad AI Content: AI used to churn out spammy, keyword-stuffed articles. This will be punished.
  • Good AI Content: AI used as an assistant to draft, research, and outline, with a human expert reviewing, editing, and adding real insight. This content can rank very well.

The takeaway: Value beats origin, every time. Focus on creating helpful, human-polished content, and you’ll be perfectly aligned with what search engines want to see.

How Can I Keep My Brand Voice from Sounding Like a Robot?

This is a huge concern, and rightly so. The key is to give the AI specific marching orders. Don't just ask it to "write a blog post." Instead, feed it a detailed brand style guide using custom instructions.

Actionable Tip: Create a "Master Brand Prompt" that you can use every time. Include details on your:

  • Tone: "Write in a witty but professional tone for tech executives."
  • Style: "Use short, punchy sentences and avoid industry jargon."
  • Audience: "Our audience is marketing VPs who are short on time and need actionable advice."

But the single most important step? A human must always have the final say. An editor needs to review and refine every piece of AI-generated output, weaving in the strategic messaging and unique personality that makes your brand yours.

What's the Smartest Way to Start If I'm on a Tight Budget?

You do not need a massive budget to get started. The best approach is to start small and prove the value. Many leading AI tools have free or low-cost plans that are surprisingly powerful.

Don't try to boil the ocean. Instead, pick one or two repetitive, time-sucking tasks you're already doing and see if AI can help.

Actionable Ideas for a Small Budget:

  • Brainstorming: Use a free tool to generate a month's worth of blog titles and outlines in minutes.
  • Repurposing: Turn a single blog post into a week's worth of social media updates.
  • Meta Descriptions: Have an AI write compelling, SEO-friendly meta descriptions for your top 20 pages.

Track the time you save. That simple number—"we saved 8 hours this month"—is all you need to build a rock-solid business case for a bigger investment down the road.


Ready to integrate a powerful, all-in-one AI solution into your marketing strategy? marketbetter.ai combines content creation, campaign optimization, and deep analytics to drive measurable growth. Explore the platform today.

A Modern Demand Gen Strategy That Drives Revenue

· 25 min read

A modern demand gen strategy isn't just a marketing plan; it's a full-funnel machine built to create predictable revenue. The goal is to shift from just capturing existing leads to proactively creating new demand for whatever you sell.

When you do this right, you build trust and become the obvious choice long before a buyer is even ready to talk to sales.

Beyond Lead Capture: A New Demand Gen Strategy

Let’s get one thing straight: the old playbook of just capturing leads at the bottom of the funnel is broken. A winning demand gen strategy doesn't obsess over the tiny fraction of your market that's ready to buy today. It focuses on educating and nurturing the massive portion who aren't, making your solution the one they think of first when the need finally hits.

This is a fundamental shift in thinking. Instead of pouring all your budget into "request a demo" CTAs, you build a comprehensive engine that informs, educates, and establishes your authority. This is how you align marketing and sales around a single shared goal: creating a pipeline filled with educated, high-intent buyers who are already sold on you.

The 95-5 Rule of B2B Marketing

The entire philosophy of modern demand generation hangs on one critical market insight. Research consistently shows that only about 5% of your total addressable market is actively looking to buy at any given moment. The other 95% are future buyers who aren't in a purchasing cycle right now.

Any strategy that ignores 95% of its potential market is, by definition, broken. The real goal is to become the go-to vendor for that massive group, so when they eventually enter that 5% "in-market" segment, you're already their top choice.

This is where you move from chasing leads to building an audience.

Diagram illustrating the three steps of demand generation: create, capture, and drive revenue.

As you can see, the process starts by creating broad awareness and interest before funneling that cultivated demand into actual revenue opportunities. You play the long game.

Demand Creation vs. Demand Capture

To make this work, you have to understand the two core pillars: creating demand and capturing it. They are two sides of the same coin, and you absolutely need both for a balanced, resilient strategy.

  • Demand Creation is your "educate and inform" motion. The goal is to make your audience aware of a problem they might not even know they have and position your solution as the answer. This is all about targeting that dormant 95%.
  • Demand Capture is the "convert" phase. Here, you're focused on prospects who are already problem-aware and actively looking for a solution. The goal is to intercept their buying journey and make it easy for them to choose you. This targets the in-market 5%.

To see how this plays out in the real world, it helps to put them side-by-side.

AttributeDemand CaptureDemand Creation
GoalConvert existing, high-intent interest into pipeline.Educate the market and build brand affinity over time.
AudienceThe 5% actively searching for a solution.The 95% who are not currently in-market.
ChannelsPaid search, G2, Capterra, SEO for bottom-funnel keywords.Social media, podcasts, content hubs, communities, events.
MetricsMQLs, SQLs, Demo Requests, Pipeline Generated, CAC.Share of voice, branded search volume, direct traffic, content engagement.

Both are essential. Without creation, your capture channels will eventually dry up. Without capture, all the brand awareness you build will never turn into revenue.

For a deeper look at the tactics involved, check out these practical B2B demand generation strategies. The key is balancing both creation and capture to build a revenue engine that works, no matter what the market is doing.

Defining Your Audience and Revenue Goals

A demand gen strategy without a laser-focused target is just wishful thinking. It's like having a map but no destination—you'll spend a lot of time, energy, and money going nowhere fast. Before you write a single line of copy or launch an ad, you need absolute clarity on two things: who you're talking to and what you want them to do.

This is the bedrock of a predictable revenue engine. Everything else builds on this foundation.

Two men discuss at a table with a laptop, next to a glass wall displaying 'Predictable Revenue Engine' diagram.

It all starts with your Ideal Customer Profile (ICP). This isn't just a list of industries or company sizes. A great ICP gets into the nitty-gritty: the specific business pains, the tech stack they use, the buying triggers that signal they need you now. It's about finding the companies that are a perfect fit for what you sell.

Move Beyond Personas to a Pinpoint ICP

Too many marketers get stuck on buyer personas—those semi-fictional profiles like "Marketing Mary." While personas are decent for nailing down your content's tone of voice, they miss the bigger picture. They don't have the business context you need for a winning demand gen strategy.

The ICP, on the other hand, is all about the account.

Think of it this way: a persona describes the person. An ICP describes the company where that person works. You absolutely need both, but the ICP has to come first. It tells you where to aim your budget.

Here’s how the two approaches stack up in the real world:

FeaturePersona-Led Approach (Broad)ICP-Led Approach (Focused)
FocusIndividual roles and their personal goals.Firmographics, technographics, and business challenges.
Example"Marketing managers who want to be more efficient.""B2B SaaS companies with 200-1000 employees, using Salesforce, and who recently hired a new VP of Marketing."
ActionCreate general content about marketing efficiency.Develop targeted campaigns addressing integration pains with Salesforce.
OutcomeHigh volume of low-quality, unqualified leads.Lower volume of high-quality, high-intent accounts.

Building a rock-solid ICP isn't guesswork. You need to get your hands dirty. Interview your best customers. Sit down with your sales team and find out what their best deals had in common. Dig through your CRM data for patterns. For a deeper dive, our guide to customer segmentation strategies can walk you through the process step-by-step.

Set Goals That Actually Drive Revenue

Once you know who you're after, you have to define what a "win" looks like. This is where most demand gen efforts go off the rails. They get fixated on vanity metrics—impressions, clicks, even raw Marketing Qualified Leads (MQLs)—that look good in a report but don't actually tie back to business growth.

A successful demand gen strategy is measured by its impact on pipeline and revenue, not by the volume of leads it generates. Shifting your focus from MQLs to revenue-centric KPIs is non-negotiable for long-term success.

Stop chasing a high MQL count. It’s a recipe for friction between sales and marketing. Instead, focus on goals the C-suite actually cares about. That’s how you prove marketing’s value and earn the right to ask for more budget.

Actionable Revenue-Focused KPIs to Track:

  • Pipeline-Influenced Revenue: This shows the total value of sales opportunities that marketing has touched. It’s about demonstrating influence, not just sourcing.
  • Customer Acquisition Cost (CAC): How much are you spending to bring in each new customer? Your goal is to keep this number well below their lifetime value.
  • Sales Cycle Length: A great strategy doesn't just find leads; it delivers more educated buyers to sales, which should shorten the time it takes to close a deal.
  • Marketing-Sourced Revenue: This is the ultimate metric. It’s the bottom-line number—the total revenue generated directly from opportunities your team created.

For example, a weak goal is "increase MQLs by 30%." A powerful, revenue-focused goal is to "generate $2 million in marketing-sourced pipeline this quarter with a target CAC of $5,000."

See the difference? That kind of goal aligns your team’s daily work directly with the company's financial objectives. It makes your demand gen strategy an indispensable part of the business, not just a cost center.

Your Content and Channel Playbook

Alright, you know who you’re talking to and what you want to achieve. Now for the fun part: building the engine that drives your entire demand gen strategy. I’m talking about your content and the channels you use to get it in front of the right people.

Content is the fuel for every single interaction, but it’s completely useless without a smart distribution plan. This is where we stop guessing and start building an actionable playbook—one that connects the right message with the right person at exactly the right time.

The goal isn't just to crank out more stuff. It's about creating the right stuff for each stage of the buyer's journey. A big-picture, thought leadership webinar is perfect for someone just realizing they have a problem. But a detailed, data-heavy case study? That's what you need for someone who's already deep in the consideration phase, comparing their options.

Mapping Content to the Buyer's Journey

A truly effective playbook doesn't just throw content at the wall to see what sticks. It strategically maps specific formats and channels to each stage of the buying cycle, guiding prospects from that first flicker of awareness all the way to a final decision. This approach is what keeps your efforts relevant and, just as importantly, efficient.

Here's a breakdown of how this actually looks in practice:

Buyer's StageContent FormatsPrimary ChannelsKey Metric
AwarenessBlog posts, podcasts, short-form video, infographics, industry reports, thought leadership articles.Organic social (LinkedIn), SEO/organic search, targeted display ads, industry publications.Website traffic, social engagement, reach, new subscribers.
ConsiderationWebinars, in-depth guides, comparison sheets, white papers, email mini-courses.Retargeting ads, email marketing, LinkedIn sponsored content, niche communities (Slack/Discord).MQLs, webinar registrations, content downloads, time-on-page.
DecisionCase studies, customer testimonials, ROI calculators, free trials, product demos, implementation guides.Direct email outreach, targeted search ads (branded keywords), sales-led conversations, review sites (G2/Capterra).Demo requests, trial sign-ups, sales qualified leads (SQLs), pipeline velocity.

As you can see, the key is to align every single piece of content with a specific purpose and audience mindset. Top-of-funnel content for the "Awareness" stage should be educational and problem-focused, never salesy. As prospects move into "Consideration," your content has to shift gears to be solution-oriented. Finally, at the "Decision" stage, you need assets that build trust and prove your solution works in the real world.

The most successful demand generation efforts don’t just happen; they are the result of strategic clarity and confidence. This allows marketing teams to allocate resources more intelligently and build personalized buyer experiences at scale.

This kind of clarity is mission-critical, especially as more companies double down on content and account-based marketing (ABM) to hit their growth targets. The top-performing teams know that a well-defined content map is non-negotiable, a fact underscored by the findings in the 2025 Demand Generation Benchmark Survey.

Choosing Your Channel Strategy

Picking the right distribution channels is just as critical as creating great content. One of the most common mistakes I see is teams trying to be everywhere at once. A focused, multi-channel approach that prioritizes the watering holes where your ICP actually spends their time is infinitely more effective.

Let's compare two common paths: the broad, high-volume shotgun blast versus a targeted, niche laser beam.

  • The Broad Strategy (Volume Play): This is where you push content across every major platform—LinkedIn, X (formerly Twitter), Facebook, broad industry pubs. The goal is maximum reach. While this might build some general brand awareness, it almost always leads to low engagement and a ton of unqualified traffic because the message is too generic.

  • The Targeted Strategy (Value Play): This approach zeroes in on a few key channels where your ideal customers are highly active and engaged. This could be a specific Slack community, a niche industry podcast, or hyper-targeted LinkedIn Ads aimed at a precise audience segment. The reach is smaller, sure, but the quality of engagement and the leads that come from it are dramatically higher.

For most B2B companies, the targeted strategy wins. Every. Single. Time. It's about depth, not breadth.

The Art of Repurposing Content

Let's be real: one of the biggest headaches for any marketing team is producing enough high-quality content consistently. The secret isn't working harder; it's working smarter by repurposing a single "pillar" piece of content into an entire ecosystem of assets. This maximizes your investment and squeezes every last drop of value out of your best ideas.

Imagine you just hosted a killer 60-minute webinar with an industry expert. That one event can fuel your content calendar for weeks.

Here's how to do it.

An Actionable Repurposing Playbook:

  1. The Pillar Piece: The full webinar recording. Host it on your website behind a simple email gate.
  2. Blog Posts: Write 2-3 detailed blog posts that dive deep into the key themes and takeaways. Don't forget to embed short video clips from the webinar directly into the posts for extra engagement.
  3. Social Media Videos: Edit the recording into 5-7 short, punchy video clips (30-90 seconds). Each clip should highlight one compelling insight or quote. These are gold for LinkedIn and YouTube Shorts.
  4. Quote Graphics: Create 10-15 slick, visually appealing graphics featuring powerful quotes from the speaker. Share them across all your social channels.
  5. In-Depth Guide: Combine the webinar transcript, slides, and some additional research into a comprehensive downloadable guide or eBook. This is a perfect mid-funnel asset.
  6. Email Nurture Sequence: Build a short email series that shares different webinar highlights over several weeks, driving traffic back to the full recording and the related blog posts.

By adopting this model, that one hour of effort can generate weeks of promotional material, making sure your demand gen strategy is both efficient and impactful. It’s a sustainable system for creating value without burning out your team.

Using AI and Automation to Scale Your Efforts

Let's be honest: trying to scale a modern demand gen strategy by hand is a losing game. To keep up with the market, you need technology—specifically, AI and automation—to work smarter, not just harder. These aren't just nice-to-have tools anymore; they are the core engine for executing at the pace and scale required to win.

This isn’t about replacing marketers. It's about augmenting their skills. It’s about automating the repetitive, soul-crushing tasks that drain their time and unlocking insights a human simply couldn't find in the noise. When you nail this, you free up your team to focus on what actually moves the needle: strategy, creativity, and building real relationships.

Shifting from Manual to AI-Driven Processes

The difference between a traditional, manual approach and an AI-powered one is night and day. It's the difference between guessing and knowing. Between reacting to the market and predicting its next move. A manual process is slow, riddled with human error, and struggles to adapt. An AI-driven one is fast, data-backed, and always learning.

Take a classic marketing function like lead scoring. The old way feels ancient by comparison.

FeatureManual Lead ScoringAI-Powered Predictive Scoring
MethodRelies on simple actions like email opens and form fills, tied to a rigid, arbitrary points system.Analyzes thousands of data points—behavioral signals, firmographics, and real-time buying intent.
FocusShows you who engaged, but often misses the subtle signals of true buying intent.Predicts which accounts are actually likely to convert, sometimes before they even engage with you.
SpeedSlow. Requires constant manual updates and rule tweaks from the marketing team.Happens in real-time and self-optimizes as new data flows in, no human intervention needed.
OutcomeSales ends up chasing low-quality leads, creating friction and wasting everyone's time.Delivers a prioritized, high-intent account list to sales, boosting conversion rates and efficiency.

This same shift applies across your entire strategy, from creating content to analyzing campaign results. If you want to go deeper, we've broken down more examples in our guide to AI for marketing automation.

Scaling Personalized Content with AI

One of the most powerful places to put AI to work is content creation. Gone are the days of a one-size-fits-all blog post. Tools like marketbetter.ai let you produce high-quality, genuinely personalized content at a scale that was impossible just a few years ago. You can finally create tailored blog posts, social media updates, and ad copy for dozens of micro-segments without burning out your entire team.

Here's a look at how a platform can help teams orchestrate their content and campaign planning in one place.

Overhead view of a modern workspace with a laptop displaying a calendar, a smartphone, and a 'Content Playbook' text.

This kind of centralized view is critical. It ensures every single piece of content, from a tweet to a whitepaper, is perfectly aligned with the broader demand gen strategy.

The results speak for themselves. We've seen AI-driven personalization boost customer engagement by up to 40%. In other cases, chatbot implementations have pushed conversion rates up by nearly 30%. By using AI to analyze massive datasets and spot behavior patterns, you stop guessing what your audience wants and start delivering it before they even ask.

Building Your Automation Tech Stack

Of course, none of this happens without the right tech stack. The goal isn't just to buy tools; it's to build an integrated system where data flows seamlessly, automating workflows and creating a single source of truth for your team.

Your tech stack should be a force multiplier for your strategy, not a messy garage full of disconnected tools. Pick platforms that automate the grunt work, deliver deep insights, and empower your team to do high-impact work.

A solid B2B demand gen stack usually includes a few core components:

  • Marketing Automation Platform (MAP): Your central hub for email, landing pages, and nurturing. Think HubSpot or Marketo.
  • Customer Relationship Management (CRM): The system of record for every customer and prospect interaction, like Salesforce.
  • AI Content Platform: The engine for scaling the creation and personalization of content across every channel (e.g., marketbetter.ai).
  • Analytics and Attribution Tool: To measure what's actually working and tie marketing efforts directly to revenue. This could be Google Analytics or a more dedicated attribution platform.
  • Intent Data Provider: To find accounts that are actively researching solutions like yours right now. Players like Bombora or 6sense are key here.

When you carefully select and integrate these tools, you're not just buying software. You're building a powerful, automated engine that scales your demand gen strategy efficiently and gives your team the freedom to become true drivers of business growth.

Measuring Performance That Ties to Revenue

Your demand gen strategy is an engine. But without a dashboard, you're driving blind. Is it actually working?

To prove it, you have to get past the surface-level metrics like clicks and impressions. It’s time to focus on the numbers the C-suite and your CFO actually care about. This is how you stop defending marketing as a cost center and start presenting it as a predictable revenue driver.

The goal is to build a tight feedback loop: analyze performance, find what's working, and double down on it to improve your return.

A person points at a computer screen displaying an 'AI Powered Scale' dashboard with data visualizations and charts.

From Vanity Metrics to Revenue KPIs

Too many marketing teams get stuck reporting on metrics that feel good but mean nothing to the bottom line. A spike in website traffic is nice, but if none of it converts into pipeline, who cares? The key is connecting every single activity to a real business outcome.

Don't just measure what's easy. Measure what matters. Your credibility hinges on drawing a clear, undeniable line from your team's efforts to the company's revenue goals.

This means obsessing over a handful of core metrics that tell the whole story.

The KPIs That Prove Your Worth:

  • Customer Acquisition Cost (CAC): This is the total spend across sales and marketing to land one new customer. An effective demand gen strategy should consistently drive this number down.
  • Lifetime Value (LTV): This is the total revenue you can expect from a single customer over their entire relationship with you. The gold standard is an LTV that's at least 3x your CAC—that’s the sign of a healthy, sustainable business.
  • Pipeline Velocity: How fast are deals moving from first touch to closed-won? A solid content strategy educates buyers before they even talk to sales, which should directly shorten your sales cycle and boost velocity.
  • Marketing-Sourced Revenue: This is the ultimate proof. It’s the total revenue generated from opportunities that came directly from your campaigns. There’s no ambiguity here—it’s the clearest measure of your team’s contribution.

Choosing the Right Attribution Model

Once you’re tracking the right things, the next question is: which activities get the credit? This is where attribution models come in, and getting this wrong is a huge risk. You could end up cutting budget from a channel that’s quietly doing the heavy lifting.

Let’s break down the two most common ways to look at this.

Attribution ModelFirst-Touch AttributionMulti-Touch Attribution
How it WorksGives 100% of the credit to the very first marketing interaction a prospect had.Spreads the credit across multiple touchpoints that influenced the buyer's journey.
Best ForSimple, top-of-funnel analysis. Good for seeing what generates initial awareness.Complex B2B sales cycles where people interact with lots of content over time.
The DownsideIgnores every other interaction that nurtured the lead, giving you a skewed, incomplete picture.Can be more complicated to set up and often requires better analytics tools to get right.

For any modern demand gen strategy, a multi-touch model is almost always the way to go. It reflects reality. A prospect might see a LinkedIn post, attend a webinar a month later, and finally book a demo after reading a case study. Each of those moments played a part.

A multi-touch model gives you the insight to invest wisely across the entire journey. If you’re ready to get more sophisticated, you can explore the different types of multi-touch attribution models to see which approach fits your business best.

Free Tool

Try our Marketing Plan Generator — generate a complete AI-powered marketing plan in minutes. No signup required.

Common Demand Gen Strategy Questions

Even with the best-laid plans, building a demand gen strategy always kicks up a few tricky questions. I've heard them all. Below, I’ll tackle the ones that come up most often, giving you straight answers and practical advice to help you build and scale your revenue engine with confidence.

How Is Demand Generation Different From Lead Generation

This is, without a doubt, the most common point of confusion. Getting this right is critical because they are two fundamentally different philosophies. One is about harvesting existing demand; the other is about creating it from scratch.

Think of it like fishing.

Lead generation is like dropping a baited hook in a well-stocked pond. You know the fish are there, you know they're hungry, and your only job is to catch them. This is all about targeting that small slice of your market—maybe 3-5%—who are actively looking for a solution right now.

Demand generation, on the other hand, is like building an entire, thriving lake ecosystem. You’re not just fishing; you’re cultivating the environment. You're making sure the water is clean, the food source is rich, and the habitat is perfect. It's a long-term play focused on educating your entire market, building trust, and becoming the only name people think of when they eventually get hungry.

A lead gen mindset asks, "How can we capture more demo requests today?" A demand gen mindset asks, "How can we become the undisputed authority in our space so the best buyers come to us automatically?"

What Is a Good Starting Budget

There’s no magic number here. Anyone who gives you one is just guessing. The right budget depends completely on your context: your industry, company stage, market competition, and how aggressive your growth goals are.

Instead of picking a number out of thin air, work backward from your revenue target. It's the only way to ground your budget in reality.

  1. Start with the Revenue Goal: Let’s say you need to generate $500,000 in new pipeline this quarter. That's your north star.
  2. Calculate Required Deals: If your average deal size is $25,000, you know you need to close 20 new customers.
  3. Factor in Your Close Rate: Maybe your sales team closes 20% of qualified opportunities. That means you need to generate 100 sales-qualified opportunities (SQOs) for them.
  4. Estimate Your Costs: Now you can start looking at channel costs. If you know from experience or industry benchmarks that a paid LinkedIn campaign costs roughly $5,000 per SQO, you suddenly have a real number to build a budget around.

A seed-stage startup might start lean, maybe $5,000 - $10,000 a month, focusing on just one or two channels to prove a concept. A more established scale-up trying to grab market share might invest $50,000+ per month across a more diverse playbook. The key is to start with a data-informed estimate and be ready to pivot as the real performance data rolls in.

How Long Until I See Results

This is where patience becomes a marketer’s greatest virtue. The timeline for seeing results from demand gen depends entirely on what you're doing. I find it helpful to think about this in two buckets.

  • Demand Capture (Short-Term Results): These are activities aimed at that 5% of the market actively buying now. Think Google Ads targeting bottom-funnel keywords or sponsoring a category on a software review site. With these tactics, you can often see qualified leads and meetings hitting the calendar within 30 to 90 days.

  • Demand Creation (Long-Term Results): This is the long game. You're playing to win over the other 95% who aren't in a buying cycle. Building authority with a podcast, a killer blog, or an industry community doesn't happen overnight. You’ll see leading indicators like more website traffic, branded searches, and social engagement within 3 to 6 months. But the real, tangible impact on pipeline often takes 6 to 12 months (or more) to fully kick in.

Your best bet is to run a balanced playbook. Use demand capture tactics to get some quick wins and keep the sales team happy, while your demand creation engine builds the foundation for predictable, long-term growth.

Which Channels Are Best for B2B Demand Generation

The "best" channels are simply wherever your ideal customers hang out to learn and connect with their peers. Don’t overcomplicate it. While every business is different, a few channels are consistently heavy hitters in the B2B world.

  • LinkedIn: It’s still unbeatable for targeting specific job titles, industries, and company sizes. Great for sharing thought leadership, running sponsored content, and even tasteful, direct outreach.

  • Organic Search (SEO): This is the ultimate long-term asset. Creating genuinely helpful content that solves your ICP's problems builds a competitive moat and delivers a steady stream of high-intent visitors who are literally searching for what you do.

  • Niche Communities: This could be a specific Slack group, an industry forum, or a subreddit. These are high-signal places where you can build real trust by providing value first and selling second (or never).

  • Podcasts: Whether you're a guest on a popular show in your space or you start your own, audio is an incredibly intimate way to build brand affinity. You're literally in your prospect's ear, establishing expertise while they walk the dog or commute to work.

My advice? Start small. Pick two channels you have a strong gut feeling about and run a focused experiment. Once you find a repeatable motion that works, you can earn the right to expand from there.


Ready to stop guessing and start building a predictable revenue engine? marketbetter.ai gives you the AI-powered tools to scale your content, personalize customer journeys, and prove your marketing's impact on the bottom line. See how you can accelerate your demand gen strategy by visiting https://www.marketbetter.ai.

The Modern B2B Inbound Lead Gen Playbook

· 25 min read

Inbound lead gen isn't about shouting into the void with cold outreach. It’s the art of attracting customers to your business with genuinely valuable content and experiences. Think of it as a magnetic approach that pulls interested prospects toward you, creating warmer, more qualified leads who are already looking for the exact solution you provide.

This shift—from pushing messages out to pulling an audience in—is the entire game for sustainable B2B growth.

Why Inbound Lead Gen Is Crushing It in B2B Today

Let's be real: B2B buyers are smarter and more self-sufficient than ever. They’re deep into their research online—reading blogs, comparing solutions, watching demos—long before they ever want to talk to a salesperson. This is precisely where inbound marketing shines. It meets buyers exactly where they are with helpful information, not an unsolicited pitch.

The philosophy is simple: earn attention, don't buy it.

An outbound strategy, like a mass cold email blast, is a pure interruption. You're fighting for a sliver of a prospect's time they never planned on giving you. Inbound, on the other hand, builds a lasting asset. When a potential customer stumbles upon your definitive guide that solves one of their biggest headaches, you're not just another vendor. You're a trusted authority.

Inbound vs. Outbound: The Core Difference

This difference in approach creates a massive difference in results. Sure, outbound can sometimes generate a quick spark of interest (often low-quality), but inbound builds a predictable engine for growth that runs for you. Let's compare the two head-to-head.

FeatureInbound Lead Gen (Magnetic)Outbound Lead Gen (Megaphone)
ApproachAttract prospects with valuable content (SEO, blogs, social).Interrupt prospects with direct outreach (cold calls, email blasts).
Lead QualityHigher quality; leads are actively researching a solution.Lower quality; leads are often unqualified and not in-market.
CostLower cost-per-lead over time as content assets compound.Higher cost-per-lead; requires constant manual effort and ad spend.
ScalabilityHighly scalable; a single blog post can generate leads for years.Difficult to scale; requires hiring more reps to make more calls.

Inbound marketing is about creating a system where your ideal customers find you, trust you, and actually want to do business with you. It transforms your marketing from a line item expense into a revenue-generating asset that appreciates over time.

The Real-World Impact on Your Pipeline

This isn't just a philosophical debate; the numbers don't lie.

Recent studies show inbound tactics generate 54% more leads than outbound marketing, all while slashing the cost per lead by a whopping 62%. The advantage gets even starker when you look at closing rates. SEO-driven leads, for instance, have a lead-to-close rate that is seven times higher than outbound leads.

To really make this work, you need to build an automated lead generation system that consistently pulls in, nurtures, and converts your ideal customers. That strategic foundation is what separates a few lucky wins from sustainable, cost-effective growth.

Defining Your Audience and Setting Clear Goals

Every great inbound lead gen program starts with a moment of intense clarity, not a flurry of content creation. Before you touch a keyboard to write a blog post or design a landing page, you have to be crystal clear on two things: who you're talking to and what you're trying to accomplish.

Without that foundation, you're just making noise.

Trying to market to everyone is the fastest way to resonate with no one. The real first step is nailing down a detailed Ideal Customer Profile (ICP). This goes way beyond surface-level details like company size or industry. A truly useful ICP defines the specific DNA of the companies that get the most value from what you sell—and, in turn, are the most profitable for you.

A laptop on a wooden desk displays a customer profile webpage with 'Ideal Customer PROFILE' text overlay.

Crafting a B2B Ideal Customer Profile

A weak ICP sounds like, "We sell to mid-market tech companies." That's not a profile; it's a guess.

A strong, actionable ICP gets surgically precise: "We target Series B to D SaaS companies with 200-1,000 employees, a dedicated marketing team of at least 10 people, and a clear need to improve content creation velocity."

See the difference? That level of detail is what allows you to actually target your marketing. Once you have that company-level foundation, you can start building out personas for the key people inside those accounts. You have to remember that in B2B, you're never selling to just one person.

The buying committee is a real thing, and each member has their own agenda.

  • The Champion (e.g., Content Marketing Manager): They're in the trenches, worrying about content quality and workflow headaches.
  • The Decision-Maker (e.g., CMO/VP Marketing): They live and die by ROI, campaign performance, and hitting board-level targets.
  • The Influencer (e.g., Marketing Ops): Their world is about smooth tech integrations and making sure the process doesn't break.

When you understand these distinct roles, you can stop creating generic content and start speaking directly to each person’s problems. A deep-dive guide on customer segmentation strategies in our guide, for example, is tailor-made for that marketing director trying to get their team to focus on the right accounts.

From Personas to Actionable SMART Goals

Okay, so you know exactly who you're talking to. Now what? You need to set goals that actually mean something. "Get more leads" isn't a goal; it's a wish. It’s useless for guiding a team.

This is where the SMART framework—Specific, Measurable, Achievable, Relevant, and Time-bound—comes in. It’s a classic for a reason. It forces you to turn vague ambitions into concrete targets that create real accountability.

The difference is night and day.

Vague GoalSMART Goal
Increase website conversions.Increase the conversion rate on our main demo request landing page from 2.5% to 4% by the end of Q3.
Generate more MQLs.Generate 150 new Marketing Qualified Leads (MQLs) from organic blog traffic in Q2.
Lower acquisition costs.Reduce our Customer Acquisition Cost (CAC) for inbound leads from $550 to $475 within the next six months.

These are goals you can build a plan around. They give your team a finish line to run toward, transforming your inbound strategy from a collection of random activities into a focused, data-driven growth engine.

The connection between a well-defined audience and sharp, measurable goals is the most critical link in any inbound lead gen strategy. One without the other is a recipe for wasted resources and disappointing results.

By anchoring your entire plan in who you're talking to and what success looks like, you create a powerful filter for every decision you make. Suddenly, every blog post, every ad campaign, and every dollar spent has a clear purpose: driving your business toward its most important objectives.

Creating Content That Attracts and Converts

Alright, you’ve defined your goals and you know exactly who you’re talking to. Now comes the fun part: building the engine for your entire inbound lead gen machine. I’m talking about content.

But let's be clear. This isn't about tossing random blog posts into the void and hoping someone bites. It's a calculated process. We're going to map specific content formats to each stage of the buyer's journey to attract, engage, and ultimately, get them to raise their hand.

Think of it like this: every piece of content you create has a job to do. It’s supposed to guide a prospect from one room to the next, building trust and momentum along the way. Your goal is a content calendar where every single asset—from a short video to a deep-dive whitepaper—is pulling its weight.

Mapping Content to the Buyer's Journey

The content that grabs the attention of someone just realizing they have a problem is worlds away from what a buyer needs when they're comparing you against two competitors. This is one of the most common places I see strategies fall apart. You can't offer a demo to someone who doesn't even have a name for their pain point yet.

Let's break down how to get this right:

  • Awareness Stage: Your ideal customer is feeling the pain, but they can't quite diagnose it. Your job here is to educate, not to sell. Think helpful blog posts like "5 Signs Your Manual Reporting is Costing You Money," easy-to-digest infographics, or short, sharp educational videos.
  • Consideration Stage: They've put a name to their problem and are now actively hunting for solutions. This is where you can start to introduce your brand as a credible answer. Webinars that go deep, detailed case studies, and comprehensive guides that compare different approaches are gold here.
  • Decision Stage: The prospect has a shortlist, and you're on it. Now, your content needs to scream, "Here's why you should choose us." This is the time to roll out the big guns: product demos, free trials, one-on-one consultations, and crystal-clear pricing pages.

The best inbound programs don’t just create content; they create a content experience. Each piece should feel like the natural next step, guiding a prospect from a vague problem to a clear solution—with your brand as the trusted expert.

From Brainstorming to a Repeatable Framework

So, how do you stop guessing what to write about and start creating things your audience is actually searching for? You need a system.

Start by talking to your sales and customer success teams. Seriously, book the time. They are on the front lines every single day, hearing the raw, unfiltered challenges your customers face. Their insights are your topic goldmine.

Once you have a list of ideas, fire up a keyword research tool to validate them. You're looking for phrases with decent search volume and an intent that perfectly matches your ICP's problems. This two-step dance—internal interviews plus external data—is the key to making sure your content is both relevant and discoverable. To really nail this down, check out this complete content marketing strategy guide.

B2B Content Funnel Mapping

To help you visualize this, here's a table that breaks down which content formats work best at each stage of the funnel. Think of it as your cheat sheet for matching the right asset to the right audience at the right time.

Funnel StagePrimary GoalEffective Content FormatsKey Metrics
Top of Funnel (Awareness)Attract & EducateBlog Posts, Infographics, Social Media, Short Videos, ChecklistsWebsite Traffic, Social Engagement, Keyword Rankings, Video Views
Middle of Funnel (Consideration)Build Trust & Provide SolutionsCase Studies, Webinars, Whitepapers, Ebooks, Comparison GuidesLead Magnet Downloads, Webinar Registrations, Time on Page
Bottom of Funnel (Decision)Convert & CloseDemos, Free Trials, Consultations, Pricing Pages, TestimonialsDemo Requests, Trial Sign-ups, Conversion Rate, Sales Inquiries

Using a map like this takes the guesswork out of your content calendar. You're no longer just creating "stuff"—you're strategically deploying assets designed to move people forward.

Comparing Content Distribution Tactics

Creating a brilliant piece of content is only half the job. A game-changing whitepaper that nobody ever sees is just a fancy PDF sitting on your server. Your distribution strategy is what turns that asset into a lead-generating powerhouse.

You've got a few key levers to pull, and a balanced approach usually wins.

ChannelPrimary Goal & Use CaseKey Advantage
SEOLong-term organic discovery. This is for grabbing people who are actively searching for answers to their problems.Builds a compounding asset that generates leads around the clock without you having to constantly feed it ad dollars.
LinkedInPrecise audience targeting. Perfect for pushing content to specific job titles, industries, and company sizes.There is simply no better platform for B2B targeting. You can put your content right on the screen of your ICP.
Email NewslettersNurturing existing contacts. Ideal for re-engaging your list and guiding them deeper into the funnel.You own this channel. It's a direct, reliable line to your warmest audience—people who have already said yes.

Ultimately, the right mix depends on your immediate goals. For sustainable, long-term growth, SEO is your bedrock. For hyper-targeted ABM plays, LinkedIn is your scalpel. And to get the most value from the audience you've already earned, email is your most trusted tool.

Building Your Lead Capture and Scoring Machine

Getting traffic to your site is a great start, but it's really just the first half of the inbound lead gen playbook. The real work begins when you have to turn that hard-won traffic into actual, actionable leads your sales team can run with. This is where you build the machine that separates anonymous visitors from qualified prospects.

It all starts with optimizing every single conversion point, from your landing pages and forms to the very first conversation a prospect has with your brand. A huge piece of this puzzle is using smart tools like lead generation chatbots to engage and qualify visitors 24/7. These bots can handle the initial questions and gather key info without any friction, keeping the momentum going even when your team is offline.

Think about the path a buyer takes—it's not a straight line. They move from being vaguely aware of a problem to actively considering solutions, and finally, making a decision.

A three-stage customer journey diagram with icons for Awareness (magnifying glass), Consideration (checklist), and Decision (handshake).

This journey underscores a critical point: your capture strategy needs to meet buyers where they are, offering the right thing at the right moment.

Designing Intelligent Forms and Landing Pages

Let's be honest, not all forms are created equal. Slapping the wrong one on a landing page is a surefire way to tank your conversion rates. The guiding principle is simple: the value of what you're offering must feel greater than the "cost" of filling out the form.

For a top-of-funnel asset—say, a quick checklist or an infographic—keep the barrier to entry almost nonexistent. Name and email. That's it. If you start asking for their phone number, company size, and job title right away, you’re creating friction for someone who's just kicking the tires.

This is where progressive profiling is a game-changer. When that same person comes back for a more substantial, middle-of-funnel piece like a detailed whitepaper or a case study, you can ask for a little more. Smart forms will recognize them and swap out the fields they've already filled in for new ones, letting you build a richer profile over time without being intrusive.

Form TypeBest ForTypical FieldsKey Benefit
Short-Stack FormTop-of-funnel assets (checklists, infographics)First Name, EmailMaximizes conversion volume by reducing friction.
Progressive ProfilingMid-funnel assets (webinars, case studies)Job Title, Company Size (on 2nd visit)Gathers deeper qualifying data without overwhelming new leads.
Long-Form / DemoBottom-of-funnel requests (demo, consultation)All relevant fields, including custom questionsCaptures high-intent leads with all necessary info for sales.

Setting Up a Practical Lead Scoring System

Okay, so the leads are coming in. Now what? You need a system to sift through them and separate the curious browsers from the people who are actually ready to talk to sales. That’s exactly what lead scoring is for. It's a method of assigning points to leads based on who they are and how they're interacting with you.

A solid scoring model ensures your sales team doesn't waste a single minute on unqualified leads and can pour all their energy into the opportunities most likely to close. It’s the critical bridge between marketing activity and sales results.

You can start by defining criteria that fall into two main buckets.

1. Firmographic and Demographic Data (Who They Are) This is all about how well a lead fits your Ideal Customer Profile (ICP). You assign points based on the explicit data they give you.

  • Job Title: A "VP of Marketing" might get +15 points, while a "Student" gets -10.
  • Company Size: If you target enterprise, a company with 1,000+ employees could be worth +20 points.
  • Industry: A lead from a target industry like "B2B SaaS" might get +10 points.

2. Behavioral Data (What They Do) This is where you track engagement to gauge their interest and intent. These actions signal they're actively researching a solution like yours.

  • High-Value Page Visits: Someone checking out your pricing page? That’s a strong signal. Give them +15 points.
  • Content Downloads: Downloading a "Decision Stage" case study is a big deal. That could be worth +20 points.
  • Email Engagement: If they’re consistently opening and clicking your emails, add +5 points for each action to reflect that interest.

Your lead scoring threshold—the magic number that turns a lead into a Marketing Qualified Lead (MQL) ready for sales—shouldn't be set in a vacuum. It needs to be a collaborative decision, the handshake agreement that gets marketing and sales perfectly aligned on what a "good" lead really looks like.

Building a model from scratch can feel complicated, but it's an essential part of an efficient inbound engine. If you're ready to go deeper, our playbook on AI-powered lead scoring offers a complete framework for building a predictive and highly effective system. When you combine firmographic fit with behavioral intent, you create a powerful machine that doesn’t just capture leads—it intelligently qualifies them to drive real revenue.

Turning Interest into Pipeline with Smart Nurture Sequences

Alright, so you’ve got a new lead in the system. Your content worked. But let’s be real for a second: 96% of the people who land on your website aren't ready to buy anything. Not even close.

This is the moment where your inbound lead gen machine shifts gears—from simply capturing a name and email to actually building a relationship. And smart automation is how you do this at scale without drowning your team in manual follow-ups.

The goal here isn't to blast them with sales pitches. It's about guiding them, giving them value, and building trust so that when they are ready to talk, they think of you first.

Desk flatlay with a smartphone, flowchart notebook, laptop, and a plant, illustrating 'AUTOMATED NURTURE'.

Different Leads Need Different Conversations

A generic, one-size-fits-all nurture sequence is a massive missed opportunity. The smartest thing you can do is match the follow-up to the action that triggered it. This simple shift is what makes your automation feel helpful instead of robotic.

Let’s look at two of the most common nurture campaigns you’ll build.

Campaign TypeWelcome SequenceTopic-Specific Drip
TriggerSomeone subscribes to your newsletter.Someone downloads a specific whitepaper (e.g., "AI in Marketing").
GoalIntroduce your brand, set expectations, build a foundation.Reinforce your expertise on that one topic and guide them deeper.
Content FocusYour "greatest hits" content, company story, what makes you unique.More on the original topic: case studies, related blogs, webinar invites.
Example Email #1"Welcome! Here’s What to Expect...""Your AI Whitepaper + 3 More Resources to Check Out"

See the difference? One is a handshake; the other is a direct follow-up to a conversation they already started.

How to Write Emails That Don't Get Ignored

Here’s the golden rule for nurturing: educate, don't sell. Your job in these early emails is to become a trusted advisor. If every message screams "Book a demo!", you're just training people to hit the delete button.

A few tips I’ve learned for writing emails that people actually open and read:

  • One Goal Per Email: Don't throw the kitchen sink at them. Don't cram five links and three CTAs into one email. Each message should have a single, clear purpose. Is it to share a case study? Invite them to a webinar? Stick to one thing.
  • Go Beyond [First Name]: Personalization is more than just a name merge. Use dynamic content in your marketing automation platform to reference the exact thing they downloaded or the industry they're in. It shows you're paying attention.
  • Write Like a Person: Ditch the corporate-speak. Use a conversational tone, ask questions, and make it feel like it came from a human, not an automation bot.

Your nurture emails should feel less like a marketing blast and more like a helpful colleague forwarding an article they know you'll find useful. That’s how you earn the right to eventually ask for their time.

A 5-Email Nurture Flow You Can Steal

Let’s make this real. Imagine someone just downloaded your "Ultimate Guide to B2B SEO." Here’s a simple, effective nurture sequence you can build out.

  1. Email 1 (Immediately): Deliver the Goods.

    • Subject: Here's your SEO Guide!
    • Content: Keep it simple. A quick thank you and a clear, can't-miss-it link to the guide. Nothing else. Just deliver on your promise, instantly.
  2. Email 2 (Day 2): Offer a Quick Win.

    • Subject: One quick SEO tip from the guide
    • Content: Pull out one super actionable tip from the guide and spell it out in the email. This adds value right away and encourages them to actually open that PDF.
  3. Email 3 (Day 4): Show, Don't Tell.

    • Subject: How [Client Name] grew organic leads by 45%
    • Content: A relevant case study is pure gold. It takes the ideas from the guide and makes them feel real and achievable for a company just like theirs.
  4. Email 4 (Day 7): Zoom Out a Little.

    • Subject: Is your content strategy ready for SEO?
    • Content: Connect their initial interest (SEO) to a related, bigger-picture challenge (content strategy). This starts to position you as a broader strategic partner. Link to a relevant blog post or webinar on the topic.
  5. Email 5 (Day 10): The Gentle Pivot (Soft CTA).

    • Subject: A simpler way to manage your SEO & content
    • Content: Now you can start to introduce your solution. Briefly explain how your product or service helps solve the challenges you've been talking about. Instead of a hard "Book a call" push, offer something lower commitment, like a short video demo or a free tool.

This isn't rocket science. It's a strategic flow that builds trust and qualifies interest over time, turning a cold download into a warm, sales-ready conversation. This is the engine that drives your whole inbound strategy.

Measuring and Optimizing Your Inbound Engine

An inbound strategy isn't a "set it and forget it" machine. The moment you stop measuring, you start losing ground. This is where you graduate from just doing marketing activities to running a predictable, data-driven system that proves its value to the business. It’s how a good strategy becomes a great one.

Your starting point has to be a dedicated marketing dashboard. This is your single source of truth, the place your entire team looks to understand what's working. We're not talking about tracking every vanity metric under the sun; we're focused on the handful of KPIs that draw a straight line from your marketing spend to actual revenue.

Core Funnel Conversion Metrics

To really get a feel for the health of your inbound engine, you have to watch how leads move through each stage. These three conversion rates are non-negotiable. They tell a powerful story about where your process is humming along and where it's breaking down.

  • Visitor-to-Lead Rate: How good are you at turning anonymous website traffic into actual contacts? A low number here is a red flag. It usually points to a mismatch between your content and your audience, or weak, uninspired calls-to-action.
  • Lead-to-MQL Rate: This tells you if you're attracting the right people. If this rate is tanking, your lead magnets might be great at pulling in a crowd, but it's the wrong crowd—one that doesn't fit your ideal customer profile.
  • MQL-to-SQL Rate: This is the ultimate test of your alignment with the sales team. A low conversion rate here screams that there's a disconnect. What marketing calls "qualified" and what sales considers "ready to talk" are two different things.

The numbers don’t lie. If your MQL-to-SQL rate is consistently below your target, it's time to pull a sales leader into a room and recalibrate your lead scoring model together. That alignment is the bedrock of an efficient pipeline.

Attribution and the Power of A/B Testing

Beyond just tracking the flow, you need to know which channels and content are actually pulling their weight. That's the whole point of marketing attribution. Is the company blog driving more qualified demos than your LinkedIn ad campaigns? Attribution models give you the data to answer these questions, so you can double down on what works and cut the dead weight.

This data-first mindset is absolutely critical, especially when you realize that more than 50% of marketers see lead generation as a top priority. With businesses pouring over 40% of their digital marketing budgets into this function, you have to be able to prove your ROI. You can explore more lead generation statistics and trends to see just how high the stakes are.

Once you have your baseline metrics locked in, the real fun begins: optimizing for incremental gains with A/B testing. This is all about making small, controlled changes to see what moves the needle. Don't try to test five things at once; you'll never know what actually worked. Focus on one variable at a time for clean, actionable results.

Element to TestExample A (Control)Example B (Variation)Potential Impact
Landing Page Headline"Our Industry-Leading Software""Cut Your Reporting Time by 50%"Conversion Rate
CTA Button Copy"Submit""Get Your Free Guide"Click-Through Rate
Email Subject Line"Company Newsletter - June""A quick question about your goals?"Open Rate

This constant cycle—measure, analyze, test, repeat—is what separates stagnant programs from high-growth inbound engines. Every test, win or lose, gives you a new insight that helps you build a smarter, more effective lead generation machine over time.

Free Tool

Try our AI Lead Generator — find verified LinkedIn leads for any company instantly. No signup required.

Got Questions About B2B Inbound? We've Got Answers.

Even if you’ve been running B2B marketing for years, inbound can feel like its own beast. Let's tackle a few of the questions I hear all the time from teams trying to get their inbound engine humming.

How Long Does This Inbound Thing Actually Take?

Look, if you need leads tomorrow, paid ads are your friend. But if you want a sustainable, compounding asset, you need to play the long game.

Expect it to take a solid six to nine months to see real, repeatable momentum from inbound. The first few months are all about laying the foundation—creating content, building topical authority, getting your SEO legs under you. Unlike outbound's sugar rush, inbound is about building trust and an audience that comes to you. It’s an investment that works for you 24/7 once it’s up and running.

MQL vs. SQL: Why the Jargon Matters

This one trips up a lot of teams and is a classic source of friction between sales and marketing. Getting it right is non-negotiable.

  • Marketing Qualified Lead (MQL): This is someone who fits your Ideal Customer Profile (ICP) and has shown interest. They downloaded your case study or signed up for a webinar. They’re a good fit, but they aren't ready for a sales call just yet.
  • Sales Qualified Lead (SQL): This is an MQL that the sales team has looked at, accepted, and agrees is ready for a direct conversation. They've crossed a threshold—defined by your lead scoring—that signals real buying intent.

The handoff from MQL to SQL isn't just a status change in your CRM; it's the most critical moment in your entire funnel.

"But Does Inbound Work for Our Super Niche Industry?"

Yes. In fact, it often works better.

When you're in a highly specialized B2B space, your goal isn’t to attract thousands of leads. It's to attract the right few dozen. Blasting a huge outbound list is a waste of time and money here.

Inbound lets you create incredibly specific content that speaks directly to the unique pains of that tiny, high-value market. You’re not shouting into a void; you’re whispering the exact right thing to the only people who need to hear it. This is how you become the go-to expert and pull in the deals that truly matter.


Ready to build an inbound engine that consistently delivers qualified leads? The marketbetter.ai platform gives you the tools to create high-performing content, automate nurture sequences, and measure your ROI with precision. See how it works at https://www.marketbetter.ai.

What Is Multivariate Testing A Practical Guide

· 23 min read

Multivariate testing (or MVT for short) is a powerful way to optimize a webpage by testing multiple changes across different elements all at the same time. Instead of running separate tests for each tiny change, you test them in combination to find the exact mix that delivers the best results.

Understanding Multivariate Testing in Plain English

A person points at a white wall next to a laptop displaying images, with 'MULTIVARIATE TESTING' text.

Think of it like tuning a high-performance engine. An A/B test is like swapping out the spark plugs to see if you get more power. It’s a simple, direct comparison: Part A vs. Part B. Good, but limited.

Multivariate testing is like having a full pit crew. You’re not just swapping one part; you’re simultaneously testing different fuel mixtures, tire pressures, and spoiler angles to find the absolute perfect combination for the fastest lap time.

MVT goes way beyond a simple "this vs. that" showdown. Its real magic is in showing you how different elements interact. You might discover your punchy new headline only works when it’s paired with a specific hero image—an insight a standard A/B test would never uncover.

The Core Idea and Historical Roots

While it feels like a modern marketing tactic, the fundamental concept is centuries old. The idea of testing multiple factors at once has been around for ages. One of the earliest examples comes from 1747, when Royal Navy surgeon James Lind tested different combinations of remedies to find a cure for scurvy. You can read more about MVT's history on AB Tasty's blog.

Today, MVT is the go-to tool for refining high-traffic pages without needing a total redesign. By making small, simultaneous tweaks to key elements, you can pinpoint the exact recipe that gets you the biggest wins.

Actionable Tip: Don't use MVT for a total page redesign. Use it to fine-tune an existing, high-performing page by testing the headline, CTA button, and hero image simultaneously to find the most powerful combination.

Testing Methods at a Glance

To really get what MVT is all about, it helps to see how it stacks up against other common testing methods. Each one has its place, and knowing when to use which is half the battle.

Here’s a quick rundown to help you choose the right tool for the job.

Testing MethodWhat It TestsBest ForTraffic Needs
A/B TestingA single element with one or more variations (e.g., Headline A vs. Headline B).Radical redesigns or testing one big, bold change to see which performs better.Low to Moderate
Multivariate TestingMultiple elements and their variations simultaneously to find the best combination.Fine-tuning high-traffic pages by optimizing the interaction between several elements.High
Split URL TestingTwo or more entirely different web pages hosted on separate URLs.Major overhauls, such as comparing a completely new landing page design against the original.Low to Moderate

Ultimately, your goal dictates the test. If you’re making a big, directional change and need a clear winner, A/B testing is your best bet. But if you want to scientifically squeeze every last drop of performance out of an already successful page, multivariate testing is the only way to go.

So, Which Test Should You Run? A/B or Multivariate?

Deciding between an A/B test and a multivariate test isn't just a technical detail—it's a strategic call. The right move depends entirely on what you're trying to achieve. Are you swinging for the fences with a bold new design, hoping for a massive win? Or are you meticulously polishing an already solid page, trying to squeeze out every last drop of performance?

Getting this choice right is the foundation of any good testing program.

Think of it this way: A/B testing is a duel. You pit your champion (the original page) against a single challenger (the new version) to see who comes out on top. It’s fast, the winner is obvious, and it's perfect for testing big, radical ideas.

Multivariate testing, on the other hand, is a team tournament. You're not just finding the best player; you're figuring out the dream team lineup. It analyzes how every player (headline, image, CTA) performs with every other teammate to find the single most powerful combination. It’s a slower, more data-hungry process, but the insights are incredibly deep.

When to Use A/B Testing: Go for Big Swings and Clear Answers

A/B testing really shines when you're testing significant, high-impact changes. It’s the tool you pull out when your hypothesis boils down to a single, pivotal question.

You should absolutely opt for an A/B test for things like:

  • Complete Redesigns: You’ve built a brand-new landing page from scratch and want to know if it crushes the old one.
  • Validating a New Offer: You're testing a fundamental shift in your value proposition or core messaging.
  • Major User Flow Changes: You want to pit two completely different checkout processes or signup funnels against each other.

Because A/B tests are just comparing a couple of distinct versions, they don't need a ton of traffic to get a clear, statistically significant result. That means you get answers fast. If you're new to this, it's worth understanding how to conduct A/B testing before diving into more complex experiments.

When to Use Multivariate Testing: For Incremental Gains and Deep Insights

Multivariate testing (MVT) is your go-to for optimization, not revolution. You use it on pages that are already performing pretty well but you know have more potential. MVT is all about fine-tuning the experience by finding the perfect recipe of smaller elements.

Consider firing up a multivariate test when you want to:

  • Refine a High-Traffic Page: Like your homepage, where you want to test the headline, hero image, and CTA button text all at once.
  • Improve a Key Landing Page: Testing different form field labels, button colors, and social proof elements to nudge lead generation higher.
  • Optimize Product Pages: Experimenting with product descriptions, image styles, and trust badges to get more people hitting "add to cart."

The real magic of MVT is its ability to uncover interaction effects—how changing your headline might suddenly make a different CTA button more effective. This is an insight A/B testing simply can’t give you, helping you build a much deeper, almost intuitive, understanding of what your audience really wants.

A/B Testing vs Multivariate Testing: Choosing Your Approach

To make this crystal clear, let's break down the strategic differences. Choosing the right method is about matching the tool to your goals, traffic, and the specific questions you need answered. Getting it wrong just leads to muddy results and wasted clicks.

This table should help you decide which approach fits your immediate needs.

AttributeA/B TestingMultivariate Testing (MVT)
Primary GoalFind a clear "winner" between two or more completely different versions.Identify the best combination of elements and see how they influence each other.
Best Use CaseRadical redesigns, testing a single big change, validating a bold new concept.Fine-tuning high-performing pages by testing multiple small changes simultaneously.
ComplexityLow. Simple to set up and the results are easy to read.High. Requires more careful planning, a more complex setup, and deeper analysis.
Traffic NeedsLow to moderate. You can get a statistically significant winner with less traffic.High. You need a lot of traffic to properly test every possible combination.
Speed to ResultsFast. You can often get a clear answer in a much shorter timeframe.Slow. Tests have to run longer to gather enough data across all the variations.

Ultimately, A/B and multivariate tests aren't rivals. They're complementary tools in your optimization arsenal.

Think of it this way: Use A/B testing to find the right forest. Then, use multivariate testing to find the perfect path through it.

How to Design a Powerful Multivariate Test

Alright, let's get our hands dirty. Moving from knowing what a multivariate test is to actually building one is where the real work begins. Designing a powerful test isn't about throwing spaghetti at the wall to see what sticks; it’s a disciplined process that starts way before you hit "launch."

The whole thing lives or dies by one single element: your hypothesis. A weak, fuzzy hypothesis gives you muddy, useless results. A sharp one is your North Star, guiding every single decision from here on out.

Start with a Strong, Measurable Hypothesis

Before you touch a single pixel on the page, you have to be crystal clear about what you think will happen and, more importantly, why. A real hypothesis isn't a vague question like, "Will a new headline work better?" That's not a plan; that's a wish.

Instead, your hypothesis needs to be a predictive statement connecting a specific change to a measurable outcome. It needs teeth.

Actionable Example: "By changing the CTA button text from 'Sign Up' to 'Get Started Free' and replacing the stock hero image with a customer testimonial video, we will increase trial sign-ups by 15% because the new combination will build more trust and create a lower-commitment entry point."

See the difference? It's specific. It's measurable (a 15% lift). And it gives you the "why." This structure forces you to think through the user psychology you're trying to influence. Even if the test fails to lift conversions, you still learn something valuable about your audience's motivations.

This visual gives you a simple gut-check on which testing path makes the most sense.

Process flow illustrating different testing methodologies: Big Changes, A/B Test, Small Tweaks, and MVT.

As you can see, if you're making a big, bold change to a page, an A/B test is your best friend. But when you’re ready to fine-tune the winning formula by testing smaller, interacting elements, MVT is the tool for the job.

Select High-Impact Variables and Variations

Hypothesis locked in? Good. Now you need to pick which page elements—the variables—you're actually going to test. The trick here is to resist the temptation to test everything. Focus your firepower on the components that are most likely to move the needle on your primary goal.

Common variables with real leverage include:

  • Headline and Subheadings: This is your value proposition in a nutshell. Get it wrong, and nothing else matters.
  • Hero Image or Video: It’s the first thing people see. It sets the emotional tone instantly.
  • Call-to-Action (CTA) Button: The words, the color, the placement—it can all dramatically change click-through rates.
  • Social Proof Elements: Things like testimonials, customer logos, or review scores are all about building trust and credibility.

For each variable you pick, you'll create different versions, or variations. For your headline, maybe you test a benefit-focused variation against a question-based one. For a CTA button, it could be "Get Started" vs. "Request a Demo." You're looking for meaningful differences that truly test your assumptions.

This is also a great place to bring in what you know about your audience. By understanding customer segmentation strategies, you can craft variations designed to resonate with the specific needs or mindsets of different user groups.

Understand Traffic and Time Commitments

Finally, a reality check. MVT is a powerful tool, but it's a hungry one. Because it has to test every single combination of your variations, it chews through a lot of traffic to get a clean result.

Think about it: a test with two variables that each have two variations creates four unique combinations. Now add a third variable with two variations of its own, and you've suddenly jumped to eight combinations. The math gets big, fast.

Before you go live, use a sample size calculator. Get a realistic estimate of the traffic you'll need and how long the test will have to run to reach statistical significance. If your page isn't getting thousands of conversions a month, MVT might not be the right move. A series of clean, focused A/B tests would likely serve you better. Setting these expectations upfront keeps you from pulling the plug too early and making bad decisions on shaky data.

Running and Analyzing Your Test for Actionable Insights

Launching your multivariate test is a great feeling, but it’s just the starting line. The real money is made in what comes next: carefully watching the experiment unfold and, more importantly, making sense of the data it spits out. This is where you turn raw numbers into powerful, lasting lessons about what actually gets your audience to act.

Success here isn’t about finding one “perfect” combination and calling it a day. It’s about understanding the specific influence of each headline, button, and image you tested. That’s the kind of granular insight that pays dividends across all your marketing, turning a single test into a wellspring of strategic intelligence.

Monitoring Your Campaign and Key Metrics

Once your test is live, the first rule is to have some patience. It’s so tempting to check the results every five minutes, but early data is a notorious liar. One variation might shoot out to an early lead purely by chance, only to fizzle out as more traffic comes in. You have to let the test run long enough to get a reliable signal from the noise.

And don't just stare at your main conversion goal, like sales or sign-ups. You need to track secondary metrics to get the full story of what users are really doing. These often reveal subtle but critical interaction effects.

  • Bounce Rate: Did that killer new headline grab attention but fail to deliver, causing people to hit the back button immediately?
  • Time on Page: Are users sticking around longer with a certain image and description pairing, even if they aren't converting right away? That's a sign of engagement.
  • Click-Through Rate on Secondary CTAs: Is one version of your main button so effective that it’s stealing clicks from other important links on the page?

Tracking these data points helps you build a much richer story. It’s the difference between knowing what worked and truly understanding why it worked.

Demystifying Statistical Significance

As the numbers roll in, you’re looking for one thing above all else: statistical significance. Put simply, this is a measure of confidence. When a result is statistically significant—usually at a 95% confidence level or higher—it means you can be pretty sure the outcome wasn't just a random fluke.

Think of it like a clinical trial. You wouldn't trust a new drug if only three out of five patients got better. You'd want to see consistent results across a huge group to be confident it actually works. Statistical significance is the mathematical proof for your marketing experiments.

Getting to that level of confidence takes time and traffic. In fact, many analytics providers find that to run a successful MVT campaign, you often need at least 10,000 visitors a month, with tests running for several weeks. It requires patience, but the payoff can be a 20-30% lift in conversions—far beyond what simpler tests typically achieve. You can dig into more multivariate testing benchmarks at AB Tasty.

Interpreting Data and Finding Actionable Insights

Once your test hits statistical significance, it’s analysis time. Your testing tool will show you which combinations won, but the real gold is in isolating the impact of individual elements. You might discover that one headline consistently crushed it, no matter which image it was paired with. That’s a huge win! It’s a portable insight you can now apply to other landing pages, email subject lines, and ad copy.

This is also where more advanced tools can help you spot patterns that aren't immediately obvious. Using predictive analytics in marketing, for instance, can help forecast the long-term impact of a winning combination across different customer segments.

Ultimately, the goal is to find concrete actions on how to improve website conversion rates across the board. Don't just anoint the winner and move on. Force yourself to answer these questions:

  1. What did we learn about our customers? Did they respond better to emotional language or to hard data?
  2. Which single element had the biggest impact? This tells you exactly where to focus your optimization efforts next.
  3. Were there any results that completely surprised us? Often, the tests that demolish our assumptions are the most valuable ones.

By asking these questions, you build a powerful feedback loop. Every test—whether it’s a runaway success or a total flop—becomes a valuable step toward mastering your marketing.

Real-World Examples of MVT Driving Growth

A desk with business documents, charts, a laptop, a pen, and a coffee cup, featuring 'MVT Case Studies'.

This is where the rubber meets the road. All the theory in the world doesn't mean much until you see how companies are actually using MVT to make smarter decisions and, frankly, make more money.

Multivariate testing isn't some abstract academic exercise. It’s a battle-tested tool that top teams use to uncover surprising truths about their customers. Let's look at a few examples of MVT in the wild.

How a SaaS Company Fixed Its Pricing Page

A B2B SaaS company had a classic "good problem" that was driving them crazy. Their pricing page was pulling in solid traffic, but the demo request form at the end felt like a brick wall. Conversions were totally flat.

Instead of throwing the whole page out and starting over—a classic A/B test move—they decided to get surgical with an MVT approach. They had a hunch that the problem wasn't one big thing, but a few small things working against each other.

Here’s what they decided to test simultaneously:

  • Variable 1 (The Plan Names):
    • Variation A: Standard stuff like "Basic," "Pro," and "Enterprise."
    • Variation B: More aspirational names like "Starter," "Growth," and "Scale."
  • Variable 2 (The Feature Bullets):
    • Variation A: A dry list of technical features.
    • Variation B: Benefit-focused bullets (e.g., "Save 10 hours per week").
  • Variable 3 (The CTA Button):
    • Variation A: The old standby, "Request a Demo."
    • Variation B: A lower-pressure option, "See it in Action."

The winning combo was a genuine surprise. "Growth" as the plan name, paired with the benefit-focused feature list and the "See it in Action" CTA, delivered a 22% lift in qualified demo requests.

The real gold was in the why. The "Growth" plan name subconsciously primed visitors to think about outcomes, which made the benefit-oriented descriptions hit that much harder. It was a masterclass in how aligning every little element around a single psychological message can create a huge impact.

Cracking the "Add to Cart" Code for an E-commerce Brand

An online apparel store was struggling with a key funnel metric: the add-to-cart rate. Shoppers were looking, but they weren't committing. The team suspected a combination of weak visuals, unclear urgency, and shipping anxiety was causing the hesitation. MVT was the perfect tool to untangle it all.

Their hypothesis was that showing the product in a real-world context, making the discount obvious, and removing shipping cost fears would be the one-two-three punch they needed.

They set up a test with these moving parts:

  • Variable 1 (Product Photos):
    • Variation A: Clean, product-on-white-background shots.
    • Variation B: Lifestyle photos showing models wearing the apparel.
  • Variable 2 (The Discount):
    • Variation A: Simple "25% Off" text.
    • Variation B: A "slash-through" price showing both the original and sale price.
  • Variable 3 (Shipping Info):
    • Variation A: Tucked away in fine print below the button.
    • Variation B: A big, can't-miss-it banner: "Free Shipping On Orders Over $50."

The results were immediate and massive. The combination of lifestyle photos, the slash-through price, and the prominent shipping banner boosted add-to-cart actions by a whopping 31%.

This is the kind of insight that goes way beyond a single page. These findings can inform all sorts of marketing personalization strategies, because now they know exactly which visual and value cues their audience responds to.

The big takeaway? While each change had a small positive effect on its own, their combined power was explosive. The lifestyle shots created desire, the price comparison proved the value, and the shipping banner erased the last bit of friction. It was a perfect storm of persuasion, discovered only through MVT.

Common MVT Mistakes and How to Avoid Them

Even the sharpest marketers can see a multivariate test go completely sideways. You end up with junk data that points you in the wrong direction, and that's worse than having no data at all. Think of this as your pre-flight checklist—the stuff you absolutely have to get right before launching.

The single most common mistake? Testing too many elements with too little traffic. It’s tempting, I get it. You want to test five headlines, four images, and three CTAs all at once. But that creates a ridiculous number of combinations, and your traffic gets spread so thin that no single version can prove its worth in a reasonable timeframe. You'll be waiting forever for a statistically significant result.

The fix is to be ruthless. Prioritize. Focus on just 2-3 high-impact elements at a time. This keeps the number of combinations under control and gives each one a fighting chance to get enough data to be reliable.

Letting Impatience Drive Decisions

Here's another classic blunder: calling a test too early. You see one combination shoot out to an early lead after a couple of days and the urge to declare a winner is almost overwhelming. Don't do it. Early results are often just statistical noise, not a true reflection of user preference.

You absolutely have to let the test run its course until you hit a statistical significance level of at least 95%. Just as important, let it run for a full business cycle—at least one full week, ideally two. This smooths out the weird fluctuations you see between weekday and weekend user behavior.

A test stopped prematurely is worse than no test at all. It gives you false confidence in a conclusion that is likely based on random chance, not genuine user insight.

The Right Way vs. The Wrong Way

Let's make this concrete. Seeing the difference between a sloppy test and a disciplined one is the key to getting answers you can actually trust.

The Common MistakeThe Actionable Solution
Spreading Traffic Too Thin: Testing 5 variables with 3 variations each (243 combinations).Focusing on Impact: Testing 3 high-impact variables with 2 variations each (8 combinations).
"Peeking" and Ending Early: Stopping the test after 3 days because one variation is ahead by 10%.Exercising Patience: Running the test for 2 full weeks until it reaches a 95% confidence level.
Ignoring External Factors: Not considering a concurrent social media campaign driving unusual traffic.Maintaining a Clean Environment: Pausing other major campaigns or segmenting traffic to isolate the test's impact.

Finally, a critical error people overlook is failing to account for outside noise. Did a massive email blast or a viral social post go live in the middle of your test? Events like that can flood your page with a totally different kind of visitor, polluting your data and making the results meaningless.

The best practice here is to create a controlled environment. If you can, avoid launching other big marketing initiatives that might contaminate your test traffic. If that's not possible, you'll need to use advanced segmentation to isolate and exclude that traffic from your results. This discipline is what makes sure the insights you get from understanding what is multivariate testing are clean, reliable, and genuinely actionable.

Free Tool

Try our Marketing Plan Generator — generate a complete AI-powered marketing plan in minutes. No signup required.

Your Multivariate Testing Questions, Answered

Alright, you've got the theory down. But when the rubber meets the road, real-world questions always pop up. Let's tackle the most common ones marketers ask right before they hit "launch."

Seriously, How Much Traffic Do I Need?

There’s no magic number, but the honest answer is: a lot more than you'd need for a simple A/B test. The traffic requirement is tied directly to your current conversion rate and, crucially, the number of combinations you’re testing.

Every new element you add to the mix multiplies the number of variations, slicing your audience into smaller and smaller groups. Each one needs enough data to be statistically sound.

Actionable Takeaway: Pages that see thousands of conversions per month are prime candidates for MVT. If your page gets less traffic, stick to a series of focused A/B tests. You'll get clearer answers much faster without spreading your traffic too thin.

Before you even think about building the test, plug your numbers into a sample size calculator. It's the best way to avoid running a test that was doomed from the start.

How Long Should a Test Run?

Patience is key here. Your test needs to run long enough to hit statistical significance (the industry standard is a 95% confidence level) and to cover a full business cycle. A bare minimum is one to two full weeks.

Why? Because this duration smooths out the weird dips and spikes you see on weekends versus weekdays. It also accounts for traffic from a weekly newsletter or a short-lived promotion that could throw off your results. Never, ever stop a test early just because one version is rocketing ahead. Early leads are often just random noise.

Can I Test More Than Three or Four Elements at Once?

You can, but it's rarely a good idea. Modern tools can handle the complexity, but your traffic probably can't. Every element you add exponentially increases the number of combinations, spreading your traffic dangerously thin.

Just look at the math:

  • 3 Elements, 2 Variations Each: 2 x 2 x 2 = 8 combinations
  • 4 Elements, 2 Variations Each: 2 x 2 x 2 x 2 = 16 combinations
  • 5 Elements, 2 Variations Each: 2 x 2 x 2 x 2 x 2 = 32 combinations

For most businesses, the sweet spot is testing 2-4 high-impact elements. This gives you rich, actionable data on how your most important page components work together, without demanding an impossible amount of traffic to get a reliable answer.


Ready to stop guessing and start winning? The marketbetter.ai platform uses AI to automate this entire process, analyzing countless combinations to find the precise formula that drives real growth. See how our AI-powered marketing platform can transform your campaigns at https://www.marketbetter.ai.