AI for Sales Prospecting That Actually Works
AI in sales prospecting is about one thing: turning data into deals. It's the technology that automates tedious research, pinpoints leads who are actually ready to talk, and helps you personalize your outreach so it doesn't sound like a robot wrote it. This lets your reps get out of the weeds and into high-value conversations.
Moving Beyond Manual Prospecting
For too long, sales prospecting has been a grind. Picture your top reps, the ones who should be closing, buried in spreadsheets and endlessly scrolling through LinkedIn. They're spending hours hunting for breadcrumbs instead of actually connecting with people. This old way of doing things isn't just slow—it's a massive drain on your team's energy and morale.
This manual-first approach is where productivity goes to die. Time is the ultimate sales killer, and reps only spend 28% of their week actually selling. The rest gets eaten by admin work and chasing leads that go nowhere.
AI gives you those hours back. It’s already happening—54% of sales teams now use AI to customize outbound emails, and 45% use it for account research. The impact is undeniable.
The impact here is real. Teams using AI are cutting their lead follow-up time by as much as 60% and boosting conversions by 30%. Prospecting stops being a guessing game and starts becoming a precise, data-driven engine for growth.
The Shift from Guesswork to Guidance
Before we get into the nuts and bolts, let's be clear: the foundational sales prospecting best practices still matter. You still need to understand your buyer and deliver real value. That never changes.
What has changed is how we execute. Old-school prospecting was built on gut feelings and a whole lot of manual effort. AI flips the script, automatically capturing buying signals and turning them into clear, actionable tasks right inside your CRM.
This is the difference between:
- Manual Research vs. Automated Insights: Instead of a rep burning an hour researching one account, AI can surface critical intel—like a fresh funding round or a new executive hire—in seconds.
- Generic Outreach vs. Scaled Personalization: AI helps draft timely, relevant emails and call scripts that reference specific company events, finally killing the "Hi [First Name]" template.
- Reactive Follow-up vs. Proactive Engagement: AI spots intent signals, like a prospect hitting your pricing page for the third time, and immediately flags it as a high-priority task for a rep to jump on.
At the end of the day, AI for sales prospecting isn't about replacing reps. It’s about making them smarter and faster, freeing them from the low-value tasks so they can focus on what they do best: building relationships and closing deals.
The Core Functions of AI Prospecting Platforms
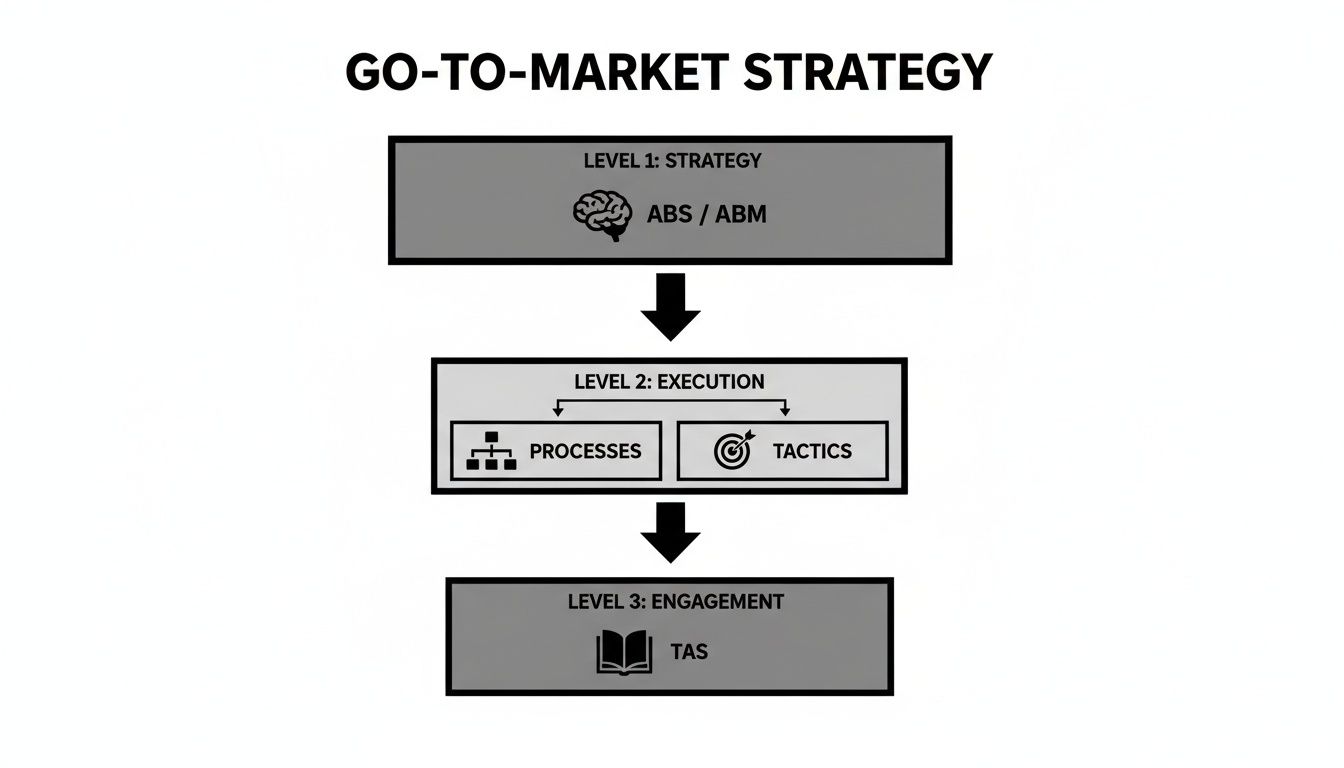
To see how AI for sales prospecting really changes the game, you have to look past the hype and see what the tech actually does. Don't think of it as a magic button. It’s more like a combination of four distinct, interconnected functions working together.
Each one takes a chunk of the old-school sales workflow and makes it smarter, faster, and less reliant on guesswork. The whole point is to free up your reps to focus on what they do best: having great conversations.
1. Intelligent Lead Scoring
Traditional lead scoring is broken. It’s usually a rigid, rules-based system that gets stale the minute you set it up. Someone visits the pricing page? +10 points. Downloads an ebook? +5 points. These rules are simple, but they miss the bigger picture entirely.
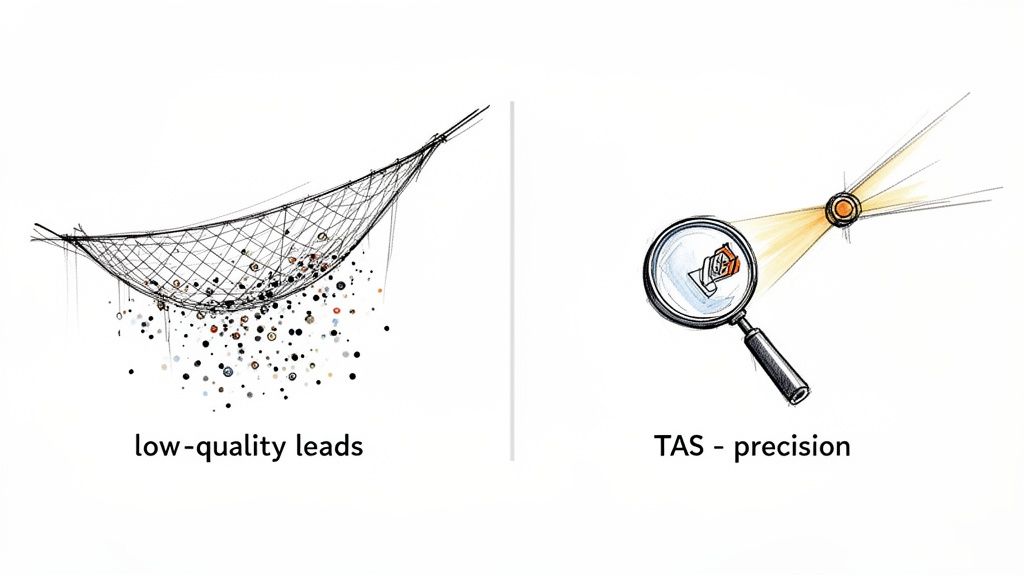
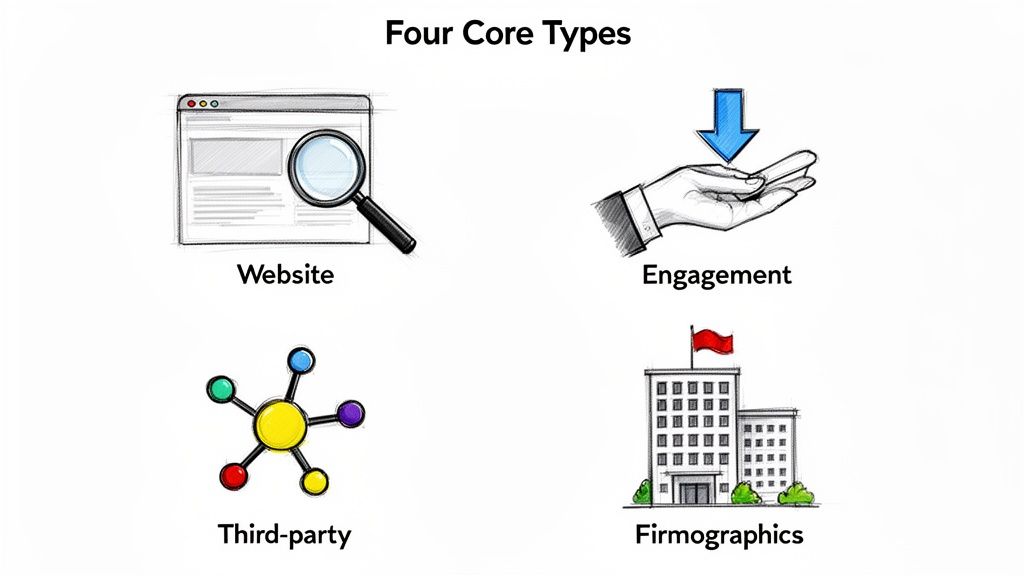
AI-powered lead scoring is a different beast altogether. It digs into thousands of data points in real time—things like the software a company uses (technographic), its size and industry (firmographic), and even whether they’re hiring for roles your product supports. It then stacks all that information against your past wins and losses to build a predictive model.
Basically, it learns what your best customers look like and finds more of them right now. For a deeper dive on this, check out our guide on lead scoring best practices.
This is the difference between a static checklist and a living, breathing system. Instead of a rep staring at a list of 100 "warm" leads, the AI tells them, "These 5 accounts are your top priority today. They match the profile of your last 10 closed-won deals and just posted a relevant job opening." That’s an instruction you can actually act on.
2. Automated Account Research
Before any good SDR makes a call, they do their homework. That usually means spending 15 to 30 minutes per prospect digging through news articles, LinkedIn profiles, and earnings reports, trying to find a relevant hook. It's a time-suck.
AI completely automates this discovery phase. It acts like a tireless research assistant, constantly scanning the web for critical buying signals and account intel.
- Company News: It flags recent funding rounds, new product launches, or big press mentions.
- Personnel Changes: It spots when a key executive joins or leaves a target company.
- Strategic Talking Points: It pulls out juicy quotes from an earnings call or a CEO's recent interview.
Instead of the rep piecing this puzzle together, the AI drops a concise brief right into their CRM. This instantly gives them the context they need to have a sharp, informed conversation from the very first hello.
This isn't just about saving time; it's about elevating the quality of every single interaction. An AI-surfaced insight turns a generic cold call into a timely, strategic conversation.
3. AI-Assisted Outreach
Let's be honest: generic, one-size-fits-all email templates are dead. Buyers can spot them a mile away. But personalizing every single message by hand is a recipe for burnout. This is where AI-assisted outreach finds the perfect middle ground.
Modern AI doesn't just plug in [First Name] and [Company Name]. It uses all the intel it gathered during the research phase to draft emails and call scripts that are genuinely context-aware.
Actionable Comparison: Manual vs. AI-Assisted Email
| Manual Template | AI-Assisted Draft |
|---|---|
| "Hi John, I saw you work at Acme Corp and thought our tool could help your team improve efficiency." | "Hi John, saw the news about Acme Corp's new logistics hub in Texas. As you scale operations, our platform can help streamline your supply chain workflows." |
The AI draft gets you 80% of the way there. It gives the rep a high-quality, relevant starting point, so all they have to do is add their personal touch and hit send.
4. Streamlined Workflow Execution
All the scoring, research, and drafting in the world is useless if it doesn't lead to action. This is the final, and most critical, piece of the puzzle. The best AI prospecting tools don't just find opportunities—they help you act on them.
They do this by plugging directly into a rep's existing workflow, usually inside a CRM like Salesforce or HubSpot.
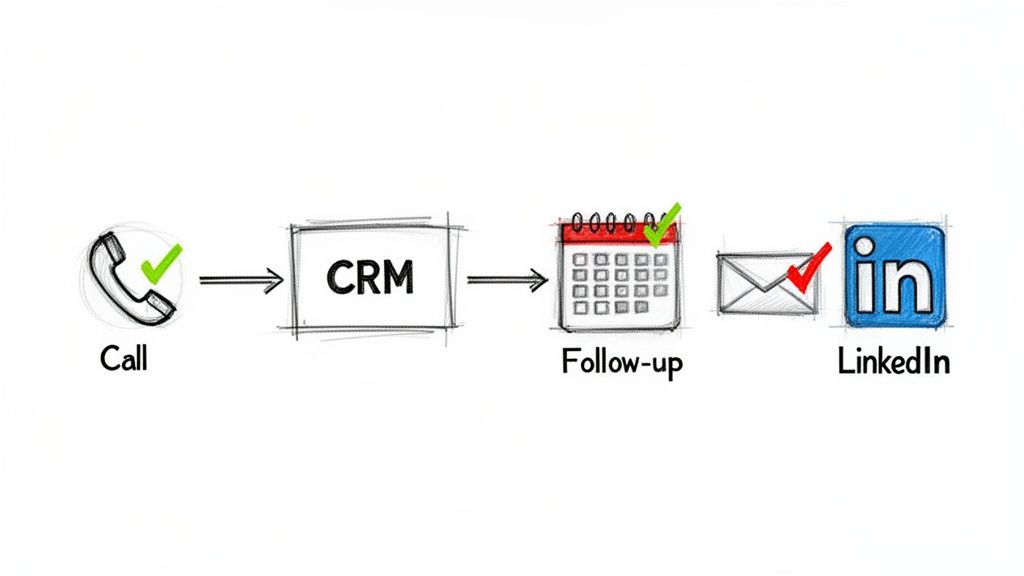
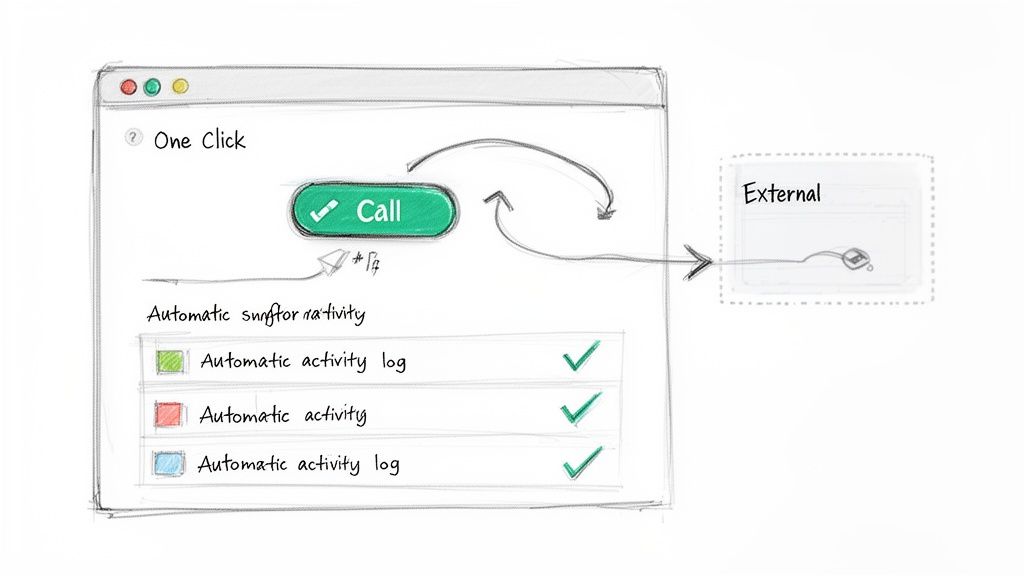
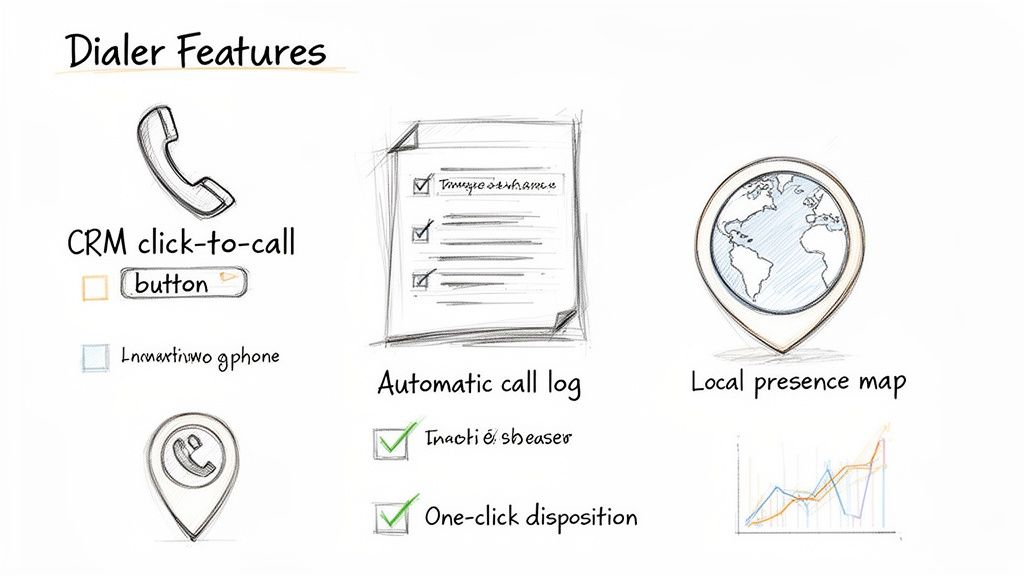
When the AI flags a high-intent signal, it doesn't just send a Slack alert and call it a day. It creates a prioritized task in the CRM—like "Call Jane Doe about their new product launch"—and attaches all the research and a suggested script. The rep can execute the task with a single click, and the AI automatically logs the outcome. No more manual data entry. It keeps the CRM clean without adding another chore to the rep's plate.
Comparing AI Prospecting Tools and Workflows
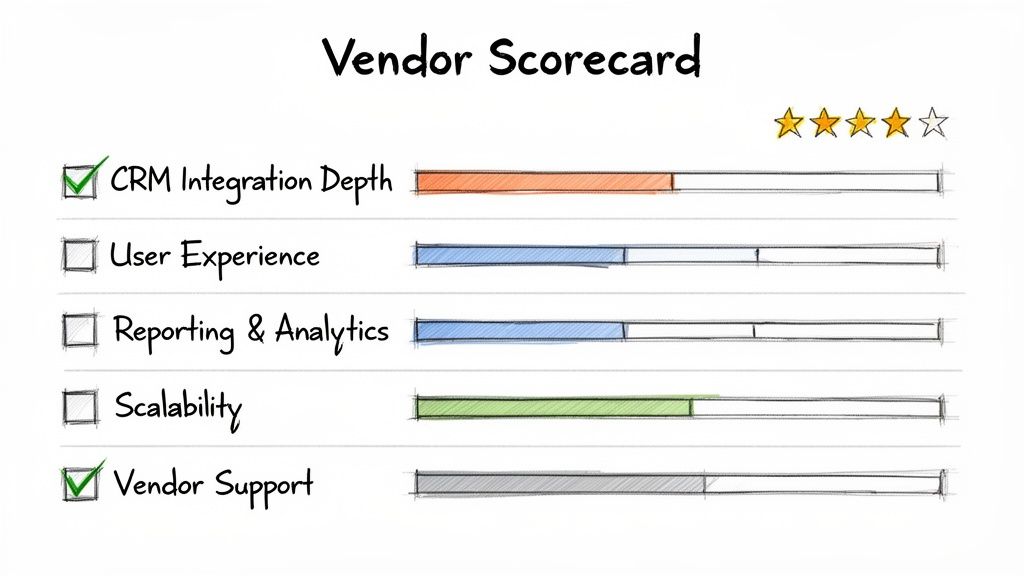
Picking the right AI for sales prospecting isn't just about features and price tags. It's a fork-in-the-road decision. One path speeds your team up, the other bogs them down in a mess of tabs and logins.
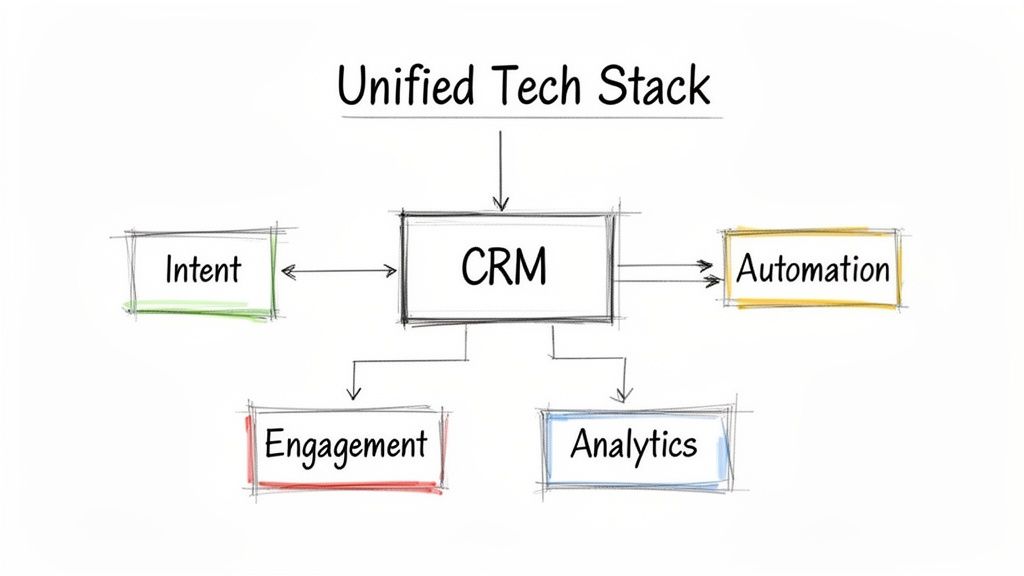
The choice really boils down to two philosophies. You can either stitch together a handful of separate 'Point Solutions' or you can adopt a single, 'Integrated Task Engine' that lives and breathes inside your CRM.
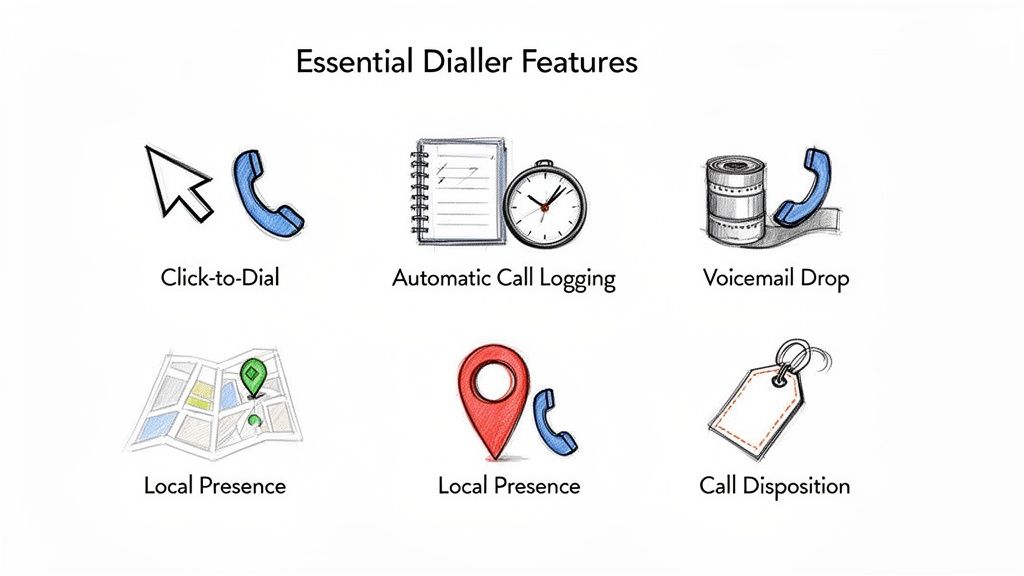
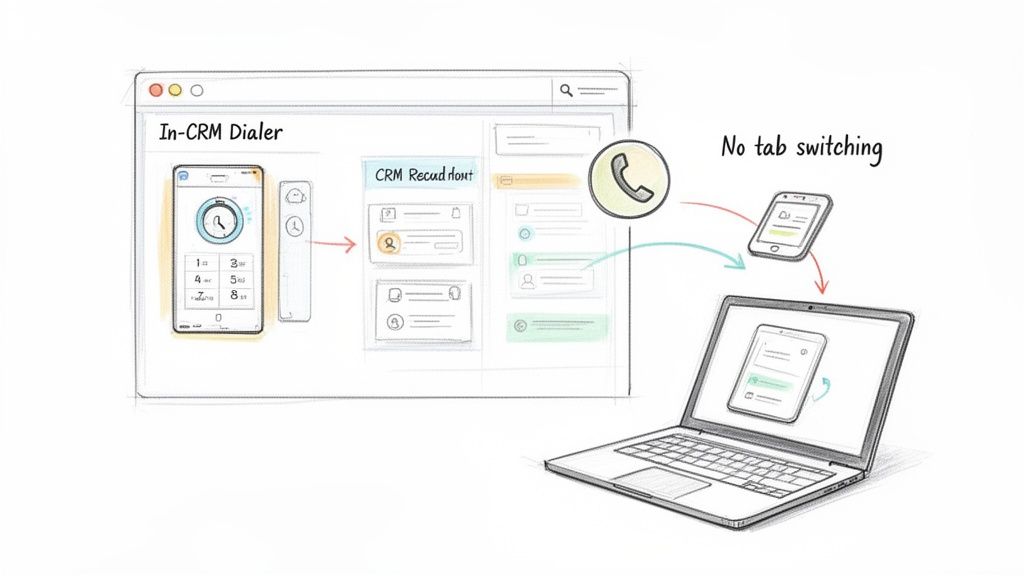
The difference is everything. The point solution route might mean using a slick AI email writer, a separate data provider, and a standalone dialer. Each tool might be best-in-class at its one job, but stringing them together creates a ton of invisible friction. Every click, every copy-paste, every tab switch is a tiny drain on a rep's momentum.
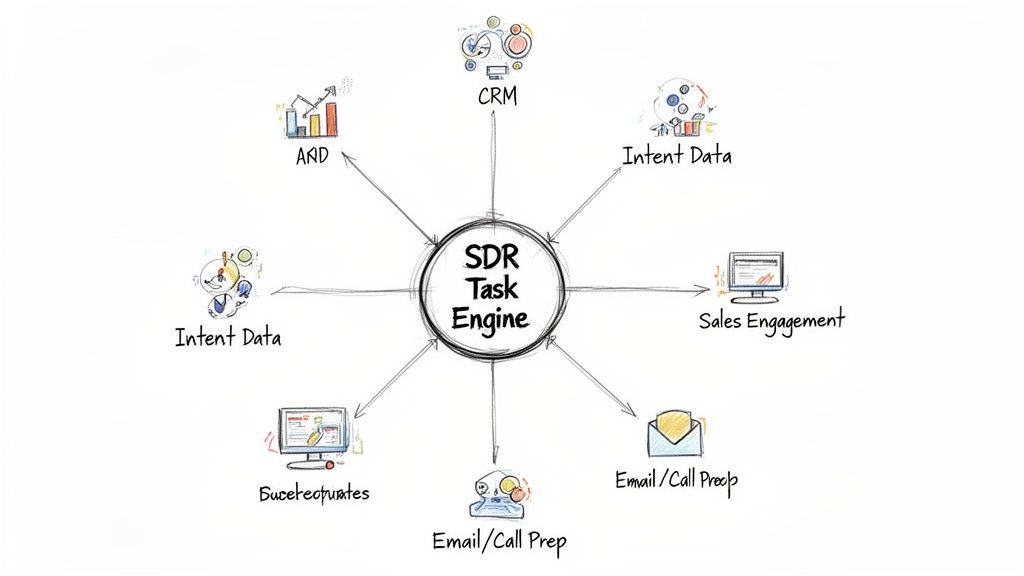
An integrated engine is different. It's built from the ground up to be a native part of your CRM. It connects the dots from an intent signal straight through to the outreach, creating one fluid motion where research, outreach, and logging all happen in the same place.
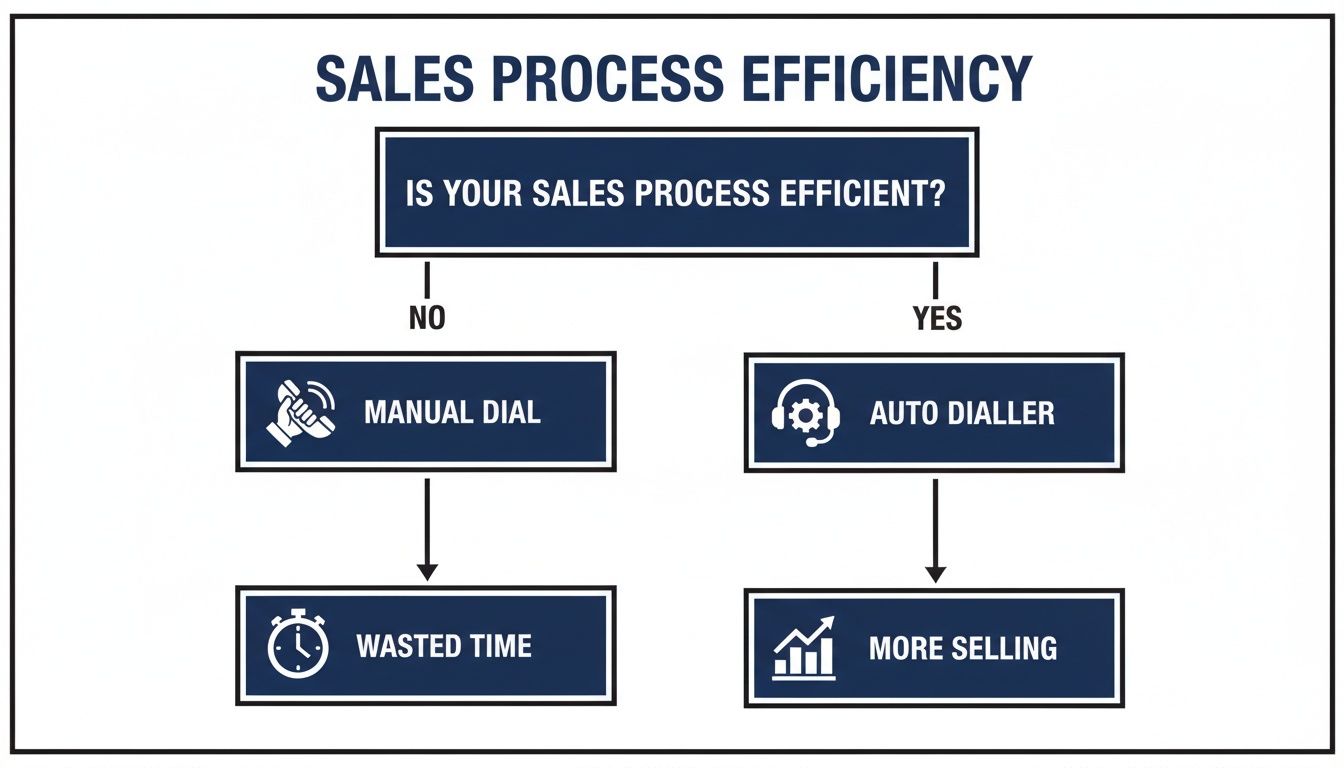
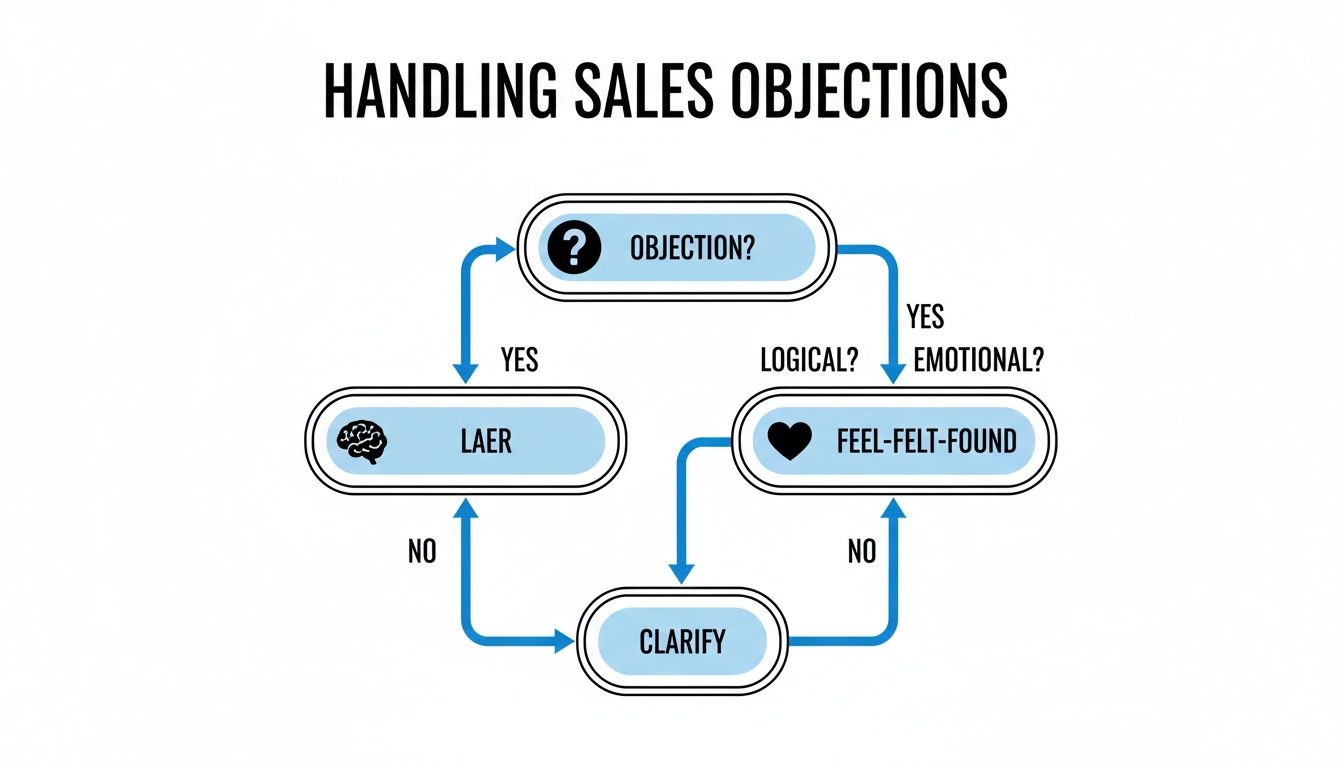
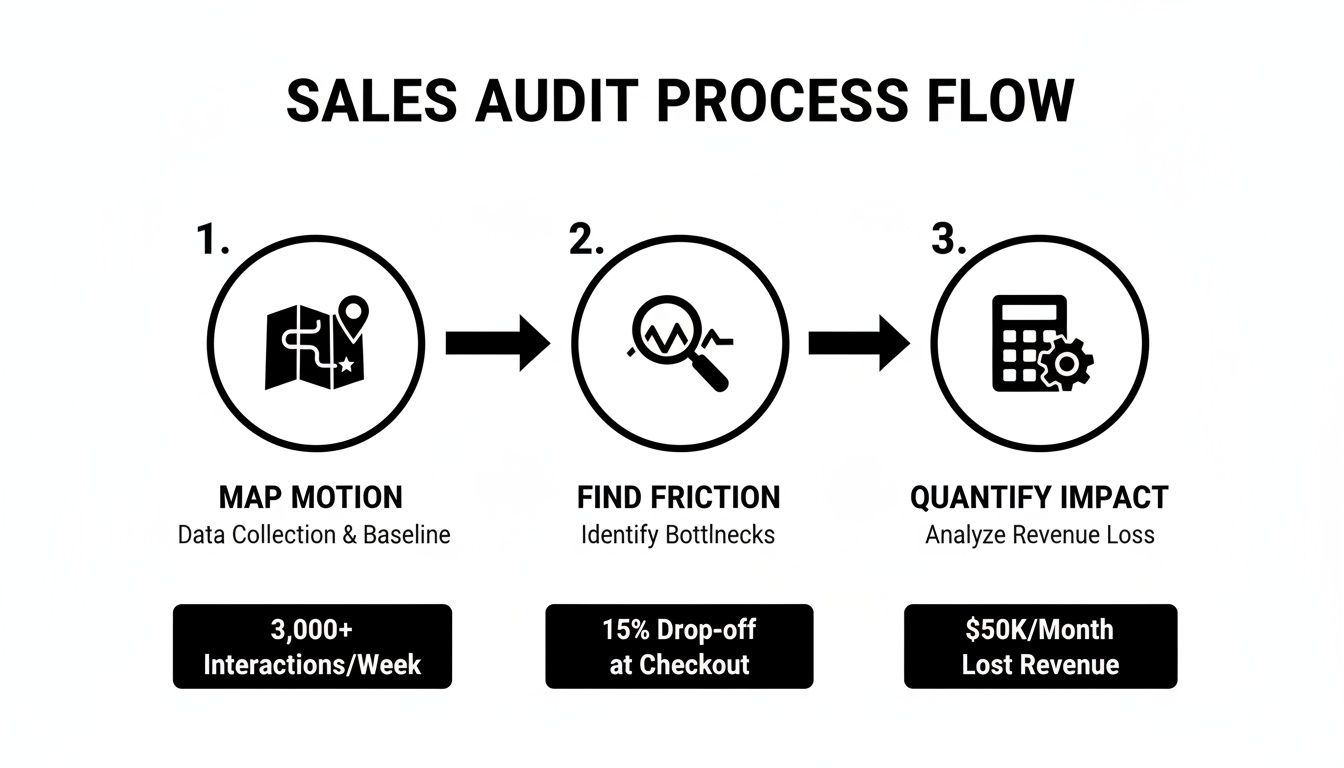
This decision tree shows the key jobs an AI prospecting system has to handle, from figuring out who to call first to executing the actual outreach.
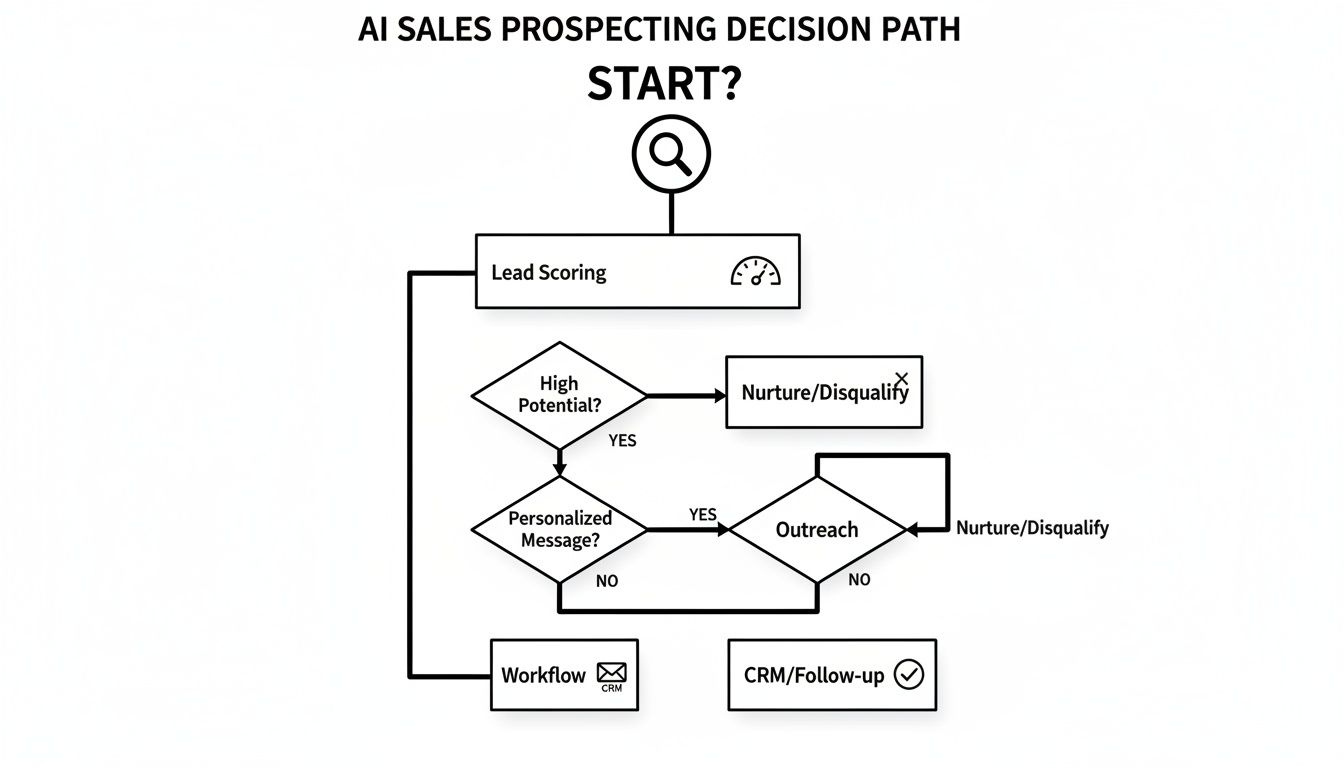
The real insight here? These aren't separate tasks. A system that actually works connects them all into a single, cohesive process. And that's where integrated engines usually win.
Integrated Engines vs. Point Solutions
The hidden tax you pay with separate tools is context switching. Every time a rep has to copy-paste a personalized line from an AI writer into their email client, momentum dies. Every time they have to manually log a call from their dialer into the CRM, you risk losing data. These little interruptions seem small, but they add up to a massive drag on your team's day.
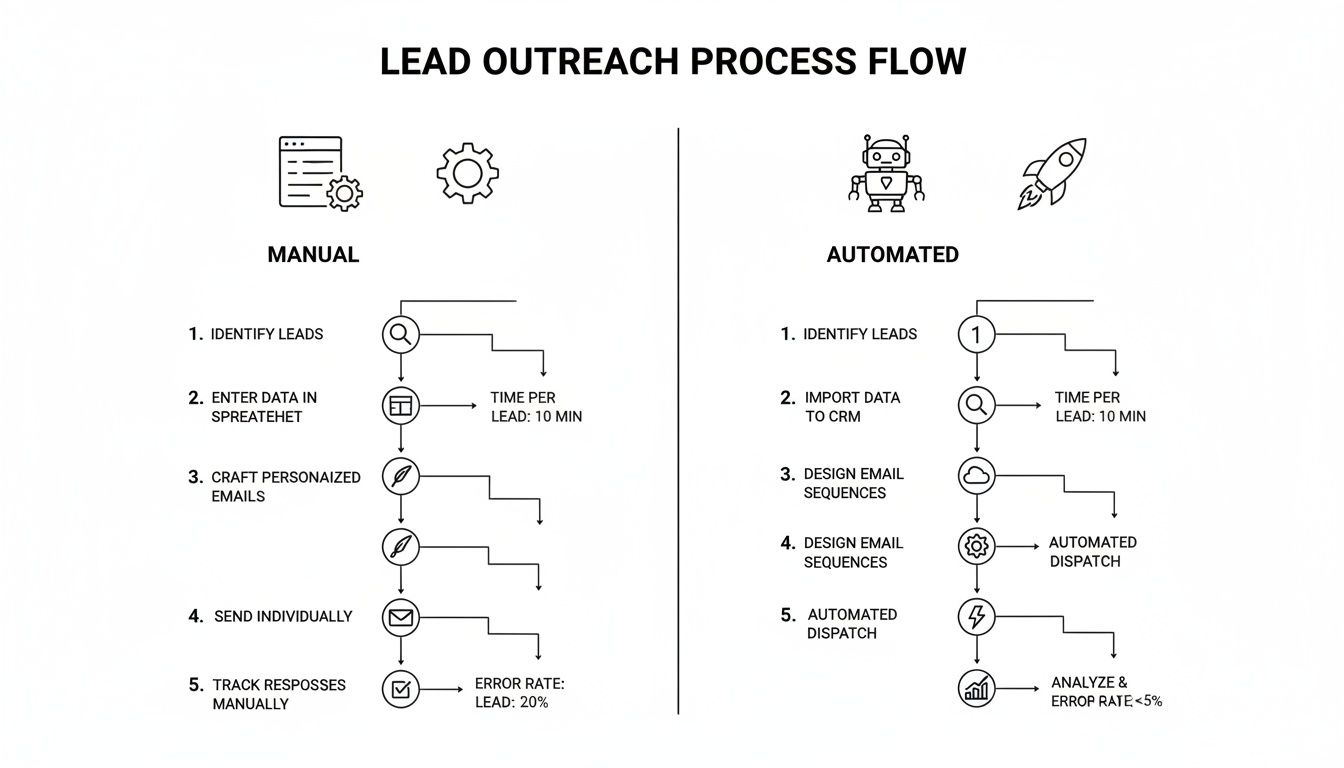
Think about it. The old world of prospecting is a rep staring at a giant list, wasting hours just figuring out who's worth a call. That old-school manual grind still eats up 40% of a sales rep's week—that's 16 hours out of a 40-hour week just gone. By contrast, teams that move to AI-driven platforms are cutting their lead follow-up time by a staggering 60%. This shift is real, and you can dig into more findings about AI's impact on sales prospecting to see just how big it is.
To make this crystal clear, let's break down the practical differences between these two approaches. The table below shows how an integrated engine and a collection of point solutions stack up in the real world.
AI Prospecting Tools: Integrated Engines vs. Point Solutions
| Feature | Integrated Task Engine (e.g., MarketBetter.ai) | Standalone Point Solutions (e.g., separate AI writer + dialer) |
|---|---|---|
| Workflow Efficiency | High. Reps stay in the CRM, knocking out AI-generated tasks with a single click. No wasted motion. | Low. Constant tabbing between the CRM, AI writer, and dialer creates friction and kills productivity. |
| CRM Integration | Deep and Native. Every call, email, and task is logged to the right record automatically. Your data stays pristine. | Shallow or API-based. Relies on reps to manually log data or uses clunky connectors that often break, creating data gaps. |
| Data Accuracy | Very High. With everything logged automatically, the CRM becomes a reliable source of truth for your pipeline. | Inconsistent. Manual logging is a recipe for human error, missed activities, and reports you just can't trust. |
| User Adoption | High. The tool lives where your reps live—the CRM. It becomes a natural part of their daily flow. | Low to Moderate. Reps hate adding "yet another tool" to their stack, especially one that makes their job harder. |
As you can see, the debate isn't just about features. It's about workflow, data integrity, and whether your reps will actually use the tool you give them.
Why a Unified System Wins
The killer advantage of an integrated engine is that it creates a closed-loop system. An intent signal is picked up, a prioritized task pops up in the CRM, the rep hits "go" using the built-in tools, and the result is logged instantly. This creates a powerful feedback loop that doesn't just make reps faster—it makes the AI smarter over time.
For RevOps and sales leaders, this is the whole game. A unified system doesn't just boost rep productivity; it gives you the clean, reliable activity data you need to actually forecast, coach, and make smart strategic bets.
At the end of the day, you bring in AI for sales prospecting to remove friction, not create more of it. Point solutions might seem like a quick fix for a single problem, but their true cost is paid in the thousands of hours your team loses switching between windows. An integrated engine treats prospecting as one fluid motion, giving your team the speed and focus they need to build a pipeline that actually closes.
Your Step-By-Step AI Implementation Plan
Putting AI for sales prospecting into motion isn't about flipping a switch. It’s about a thoughtful rollout that empowers your team, not overwhelms them. A good launch moves from a clear strategy to measurable results, making sure the tech actually fits into your reps' daily lives instead of blowing them up.
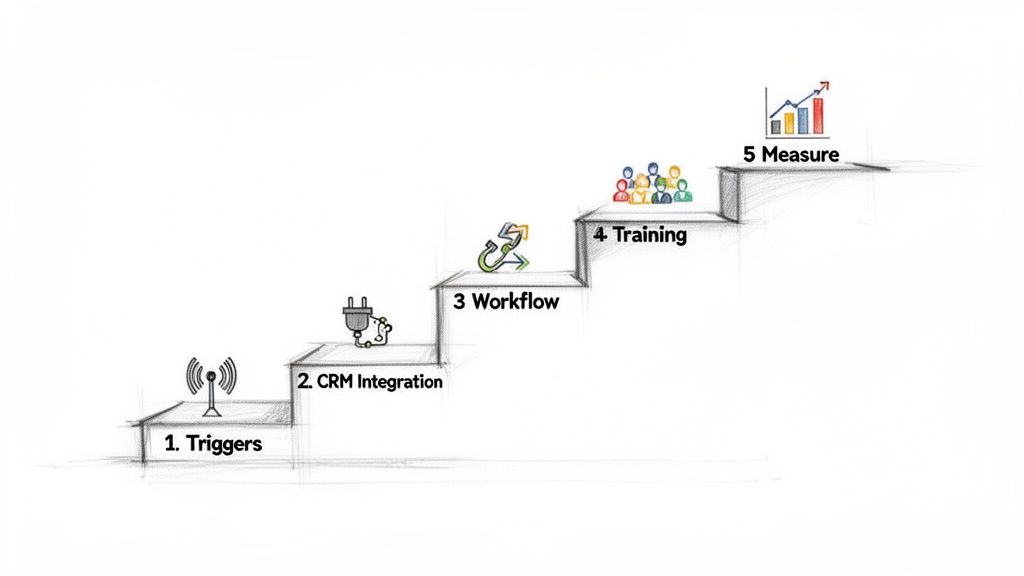
This five-step framework is your roadmap. It’s built to get you from setup to proven ROI by chasing small wins and getting a little better every day.
Step 1: Define Your Prospecting Triggers
Before you touch any software, you have to decide what a "good opportunity" actually looks like. What specific events tell you an account is ready for outreach? This is the bedrock of your entire AI prospecting engine.
Generic signals get you generic outreach. Don't do that. Instead, zero in on triggers that are hyper-relevant to the problem you solve. This clarity is what separates a noisy, distracting AI from one that serves up genuinely prioritized tasks.
Actionable Step: Gather your top three sales reps and a marketing lead. Brainstorm and list the top 10 events that preceded your last five biggest deals. Circle the top three most reliable triggers—these are your starting point.
Your best triggers might look like this:
- Competitor Shake-Ups: A key rival announces a big price hike or a service outage.
- Hiring and Growth: A target account posts jobs for roles that scream for your solution (like a "Director of Supply Chain").
- Tech Stack Changes: An account rips out a competing software from its tech stack.
Step 2: Ensure Deep CRM Integration
Your AI tool cannot be an island. If you want your team to actually use it, it has to live inside the system they already use all day, every day—your CRM. A shallow connection that requires manual data syncing is a recipe for failure.
Deep integration means AI-generated tasks, contact info, and activity logs show up and get updated right inside Salesforce or HubSpot. This isn't just a nice-to-have; it's critical for keeping a single source of truth and killing the friction of jumping between tabs.
The core difference here is workflow disruption vs. workflow acceleration. A non-native tool makes reps juggle tabs, copy-paste info, and manually log calls. A deeply integrated engine makes acting on an insight a one-click action inside the CRM.
Step 3: Configure Your First Automated Workflow
Don't try to boil the ocean. Start with one, high-impact workflow to prove the concept and build some momentum. Pick one of the triggers you defined in Step 1 and build a dead-simple, automated process around it.
For instance, your first workflow could be:
- Trigger: The AI flags a target account that just hired a new VP of Sales (your perfect champion).
- Action: The system automatically creates a "High Priority: New Champion" task in your CRM.
- Execution: That task lands with the account owner, complete with all the context, an AI-drafted email, and a click-to-call button.
This approach delivers an immediate, tangible win. Reps see the value right away, which is the secret to getting the whole team on board. If you're ready to get your hands dirty, guides on how to build a real estate AI agent with N8n and ChatGPT can offer a practical blueprint for creating your own automation.
Step 4: Empower Your Sales Team with Training
The point of training isn't just showing reps which buttons to click. It's about building their confidence by framing the AI as a powerful assistant that makes them better, not a replacement that threatens their job.
Actionable Step: Create a one-page "AI Quick-Start Guide" for your reps. Include: 1) What the AI does (automates research), 2) What it doesn't do (close deals for you), and 3) The top 3 ways it will help them hit their quota faster. Frame it as a tool for winning.
Good training has to focus on the "why" behind the "what." Explain how the AI surfaces better opportunities so they can have smarter conversations and crush their quota faster. Make it clear the AI handles the robotic research, freeing them up to do what humans do best: build relationships, tell good stories, and close deals.
Step 5: Measure What Matters
Finally, you have to track the right numbers to prove this AI investment is actually paying off. Vague goals like "improved efficiency" won't cut it. You need concrete KPIs that tie directly to pipeline and revenue.
Actionable Step: Before launch, establish a baseline for your key metrics. Then, track them weekly for the first 90 days. Present the "Before vs. After" results to your team to build momentum and prove ROI to leadership.
Track these key metrics before and after you go live:
- Activity Volume: How many calls and emails is each rep sending per day?
- Connection Rate: What percentage of calls actually turn into a conversation?
- Pipeline Generated: What's the dollar value of new opportunities coming from AI-surfaced tasks?
- CRM Data Hygiene: Are you seeing fewer manual logging errors and more accurately tracked activities?
Following this plan turns the big idea of AI for sales prospecting into a practical, results-driven reality for your team.
Crafting AI-Powered Outreach That Connects
This is where the rubber meets the road. All the lead scoring and intent signals in the world don't mean a thing if your outreach falls flat. This is the moment AI stops being a research tool and starts driving actual conversations. The real goal is to use it not just to find the right people, but to say the right thing at the right time.
Personalization used to be a pipe dream for outbound sales—it was just too time-intensive to do at scale. Not anymore. A staggering 58% of sales teams now use AI to help write their outreach, and 57% use it for prospect research. That lines up perfectly with the 57% of businesses that ramped up their AI investments in prospecting over the past year. They see it for what it is: a high-return activity. You can get a deeper look at these stats and discover insights on AI in sales and marketing.
This isn't about finding a new template. It's about shifting from generic blasts to context-aware conversations, with AI as the engine that finally makes it possible to do this for every single prospect.
From Robotic to Relevant: AI-Powered Emails
Let's be real: nobody wants an email that sounds like a robot wrote it. The fear of AI-generated messages coming across as cold and impersonal is totally valid, but it’s based on yesterday's tech. Modern AI doesn't just fill in blanks in a template; it synthesizes information to create a compelling, human-sounding starting point for your reps.
The secret sauce is context. A smart AI email tool plugs into the research it’s already done—like a recent funding announcement, a new product launch, or a key executive hire—and weaves that intel directly into the message.
Here’s what that looks like in the real world:
The Generic, Manual Email:
"Hi Sarah, I saw you’re the VP of Operations at Innovate Inc. and wanted to introduce our logistics platform. We help companies like yours streamline their supply chain. Are you free to connect next week?"
It’s polite, sure. But it’s also instantly forgettable. It’s all about the sender and has zero to do with Sarah or what's happening at Innovate Inc. right now.
The Context-Aware, AI-Assisted Email:
"Hi Sarah, I saw the news about Innovate Inc.'s expansion into the EU market—congratulations on the big move. As you navigate the complexities of cross-border logistics, our platform can help automate customs compliance, which is often a major hurdle. Is that a challenge on your radar?"
See the difference? This version is sharp, timely, and focused entirely on the prospect's world. The AI surfaced the "EU expansion" trigger and used it to frame a relevant problem. A rep can take this draft, add a touch of their own personality, and hit send on a message that has a real shot at getting a reply. You can see how this applies to broader campaigns in our guide on using email marketing to generate leads.
AI-Assisted Cold Calls That Actually Build Confidence
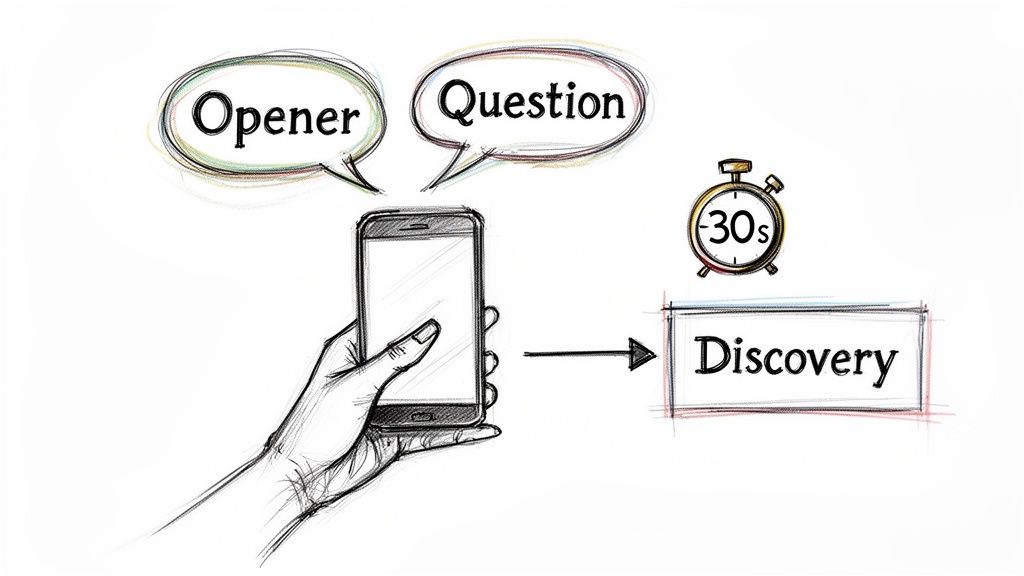
The same idea applies to cold calls. A great call isn't about rigidly reading a script; it’s about having a flexible, informed conversation. This is where AI gives reps a massive boost in both confidence and effectiveness.
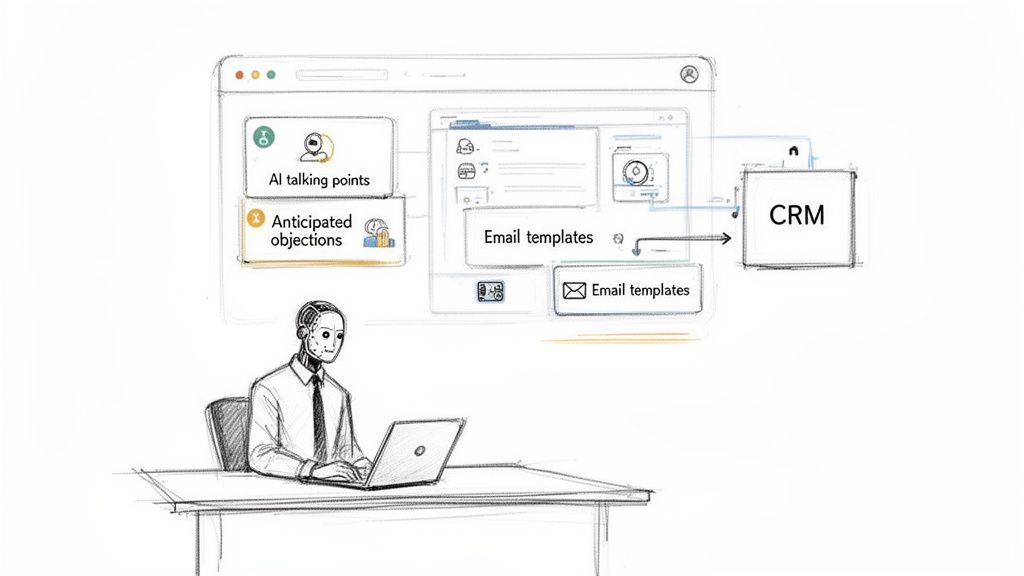
Instead of a rep scrambling to find talking points a few seconds before dialing, an AI tool can generate a concise "call prep" brief right inside their CRM.
For RevOps leaders, this is a game-changer for consistency. AI ensures every rep—from the seasoned pro to the new hire—is armed with the same high-quality intelligence before every single dial.
This AI-generated brief can include things like:
- Key Talking Points: A few bullets connecting your solution to the prospect’s recent company news.
- Common Objection Handling: Smart suggestions for handling pushback, based on what's worked in similar calls.
- Relevant Questions: Open-ended questions designed to uncover pain points related to the buying signals you've detected.
Think of it like an expert sales coach whispering in your rep’s ear. It doesn't tell them exactly what to say word-for-word. It gives them the strategic ammo they need to navigate the conversation with authority. This level of preparation turns a dreaded cold call into a strategic discussion, proving that AI doesn't make interactions less human—it makes reps more prepared, and therefore, more human.
Measuring Success and Avoiding Common Pitfalls
An AI platform is just another shiny object if it doesn't deliver results. When you bring AI for sales prospecting into your stack, you need a dead-simple way to measure its ROI and get ahead of the usual roadblocks. Vague goals won't cut it. You have to track the business-critical numbers that prove the tech is actually driving growth.
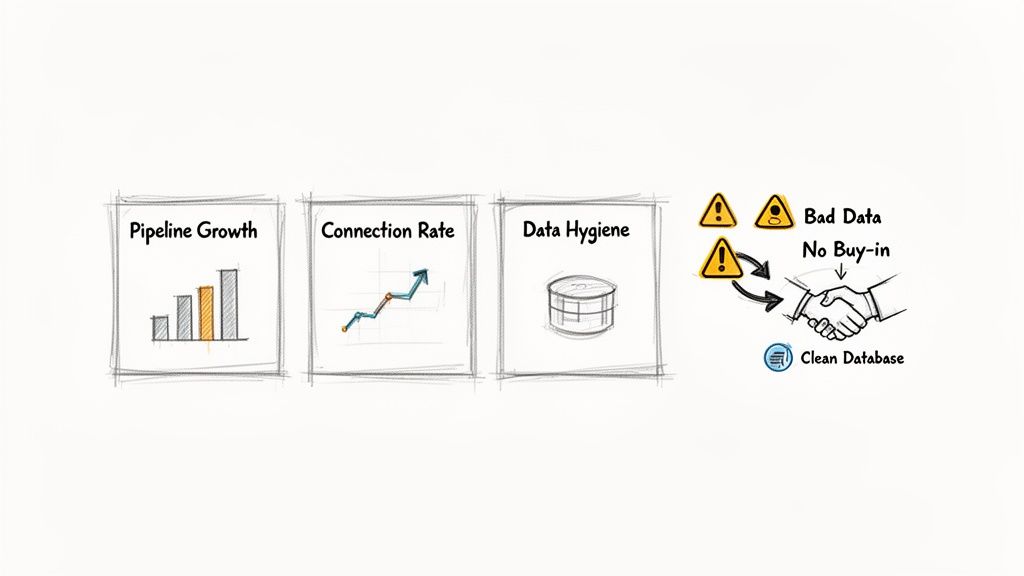
This means shifting your focus from vanity metrics to the numbers that directly feed your pipeline. Instead of just celebrating a higher email volume, successful teams track the outcomes that really matter.
- SDR Activity vs. Burnout: Is your team making more quality calls and sending smarter emails without burning the midnight oil on manual prep?
- Connection and Conversion Rates: Are more conversations turning into booked meetings because reps have better, AI-surfaced insights at their fingertips?
- CRM Data Hygiene: Is activity logging finally happening automatically and without errors, giving you a pipeline view you can actually trust?
These metrics give you a clear before-and-after picture, showing exactly how AI is moving the needle on both efficiency and effectiveness.
Navigating Common Implementation Hurdles
But here's the reality check: even the slickest tool will fail if the rollout is botched. There are a few classic pitfalls that can kill your AI initiative before it even gets off the ground. Knowing what they are—and having a plan—is the key to making this work long-term.
The biggest hurdle, hands down, is poor data hygiene. An AI is only as smart as the data it eats. If your CRM is a graveyard of duplicate records, old contacts, and half-filled fields, your AI's recommendations will be useless. That just leads to wasted effort and seriously frustrated reps.
The rule is simple: garbage in, garbage out. The teams that crush it with AI are the ones who commit to disciplined data management first. This isn't a one-time cleanup; it's a constant habit.
To sidestep these issues, you need a proactive game plan. The table below breaks down the common problems and the practical solutions.
| Common Pitfall | Actionable Solution |
|---|---|
| Lack of Team Buy-In | Don't position AI as a replacement; frame it as an assistant that kills grunt work. Run a pilot with a small crew of champions to build early success stories and prove its value to the rest of the team. |
| Poor CRM Integration | Pick a tool with deep, native integration into your CRM, whether it's Salesforce or HubSpot. The goal is a seamless workflow where reps never have to leave their home base to act on AI-driven tasks. |
| Ignoring Data Quality | Get regular data audits and automated deduplication processes on the calendar. Set up clear data governance policies so every new piece of information that enters the CRM is clean and consistent from day one. |
By measuring the right things and tackling these roadblocks head-on, you can make sure your investment in AI for sales prospecting delivers a powerful, lasting impact on your revenue engine.
Got Questions About AI Prospecting?
Lots of sales leaders are kicking the tires on AI for sales prospecting, but they’ve got real, practical questions about how this stuff works on the ground. Let's cut through the noise and get straight to the answers.
Is AI Going to Replace My Sales Reps?
Nope. Think of AI as a world-class research assistant, not a replacement. The real win here is automating the soul-crushing grunt work that eats up to 40% of a rep’s day—endless digging, manual data entry, you know the drill.
This frees up your team to do what humans do best. AI preps the brief; your rep closes the deal. They get to focus on building actual relationships, navigating tricky objections, and solving customer problems in ways a machine never could.
How Does This Actually Plug into Our CRM?
This is a big one. The best AI prospecting tools don’t just sit next to your CRM; they live inside it. We’re talking deep, native integrations with platforms like Salesforce and HubSpot. Forget clunky tools that force your team to toggle between a dozen tabs and manually sync data. That’s a recipe for failure.
A native integration means AI-powered tasks and insights show up right where your team already works. No more copy-pasting. It keeps your CRM the clean, single source of truth for everything sales-related.
Can AI-Written Emails Actually Sound Human?
Early AI-generated text was painfully robotic, we’ve all seen it. But modern tools are in a different league because they’re driven by context, not just templates. They analyze company data, buyer personas, and recent trigger events to draft emails that are relevant and timely.
The goal isn't to hit "send" on a fully automated email. It’s about acceleration. The AI gives your rep a solid, 80% complete draft to work with. They add their own unique voice and personality, then send a highly personalized message in a fraction of the time.
Ready to see how a native AI task engine can light up your team's pipeline? marketbetter.ai embeds AI-powered emails and a one-click dialer directly into your Salesforce or HubSpot workflow, turning buyer signals into immediate, actionable tasks. See how it works at https://www.marketbetter.ai.

