
7 posts tagged with "pipeline"

View All Tags

The Cost of Inaction in Sales: How to Build Real Urgency and Close More Deals

Β· 11 min read
MarketBetter Team
Content Team, marketbetter.ai

Your biggest competitor isn't the other vendor on the shortlist. It's the status quo.

Every quarter, billions of dollars in pipeline evaporate β€” not because a rival swooped in with a better demo, but because someone on the buying committee said, "Let's revisit this next quarter," and nobody on the selling side had a compelling answer for why that was a terrible idea.

If you've been in B2B sales for more than a cycle, you've felt this. The deal that went dark after a "great" demo. The champion who stopped returning calls. The CFO who said the budget "shifted." These are all symptoms of the same disease: you never made the cost of doing nothing concrete enough to act on.

Here's the uncomfortable truth most sales training skips: finding pain isn't enough. Every AE on the planet can uncover a problem. The ones who consistently close above quota are the ones who can put a dollar figure on what happens if that problem persists for another 30, 60, or 90 days.

This is the discipline of building the cost of inaction β€” and it's the single most underleveraged skill in modern B2B sales.

Why "Do Nothing" Keeps Winning​

Let's start with the psychology. Nobel laureate Daniel Kahneman showed us that humans feel losses roughly twice as intensely as equivalent gains. But here's the catch: that only works when the loss is visible. If your buyer can't see what they're losing by waiting, the status quo feels safe. Comfortable. Free.

It isn't free. It just looks that way.

Consider a mid-market SaaS company with 15 SDRs. Their current prospecting stack takes each rep about 90 minutes a day just to build lists, research accounts, and figure out who to call. That's 22.5 hours per day across the team β€” roughly three full-time employees' worth of labor β€” spent on manual research instead of conversations.

Every week that passes without fixing that? Another 112 hours of selling time burned. Another $45,000 in fully loaded rep cost allocated to Googling LinkedIn profiles instead of booking meetings.

But in the deal, nobody said that number out loud. The AE showed a slick demo of their AI-powered prospecting tool, quoted a price, and asked if there were "any questions." The VP of Sales nodded politely and said she'd "circle back after Q2 planning."

That deal is dead, and the AE doesn't even know why.

The Five-Step Framework for Quantifying Inaction​

There's a structured way to do this. It's not manipulative β€” it's clarifying. You're helping your buyer see what they already know but haven't quantified. As Chris Orlob puts it, the best closers make the invisible costs visible.

Here's the framework, expanded with examples from real B2B selling scenarios:

Step 1: Find the Metric That's Bleeding​

Every business problem maps to a number. Your job in discovery is to find the specific metric that's suffering right now β€” not theoretically, not "could be better," but actively deteriorating.

The question that unlocks this: "What metric is suffering as a result of that problem?"

This isn't a soft question. It's surgical. It forces the buyer to stop talking in generalities ("Yeah, our outbound could be better") and start talking in specifics ("Our reply rates dropped from 8% to 3% over the last two quarters").

Good metrics to hunt for:

  • Revenue leaked per month (deals lost, pipeline that went dark, churned accounts)
  • Time wasted per week (hours spent on manual work that could be automated)
  • Customer churn per quarter (and the revenue attached to those logos)
  • Cost per lead or cost per meeting (and how it's trending)
  • Ramp time for new hires (weeks from start date to first closed deal)

The key is specificity. "We're losing deals" is a feeling. "We lost 14 deals worth $820K last quarter to no-decision" is a number you can work with.

Step 2: Reverse-Engineer the Cost of Waiting​

Once you have the metric, run the clock forward. What does another month of this problem cost?

This is where most AEs bail out. They hear the pain, they nod sympathetically, and they pivot to the demo. Don't. Stay in the math.

Example β€” Martech Stack Consolidation:

A marketing ops leader tells you they're running 11 different tools for email, enrichment, intent, and analytics. They spend $8,200/month across subscriptions, plus their ops team burns 20 hours/week on integrations and data cleanup.

The cost of waiting one quarter:

  • $24,600 in redundant SaaS spend
  • 260 hours of ops labor (~$19,500 at fully loaded cost)
  • Unknown data quality degradation affecting campaign targeting

That's $44,100 in hard costs per quarter β€” before you even quantify the downstream impact of bad data on pipeline quality.

Now compare that to the price of your platform. Suddenly, the "budget isn't there" objection looks absurd. The budget is already being spent β€” just on the wrong things.

Example β€” SDR Team Without Intent Signals:

An SDR leader has 8 reps cold-calling from static lists. Their connect rate is 4%, and their meeting-to-opportunity conversion is 22%. Each rep makes 60 dials a day.

Without intent data prioritizing who's actually in-market, roughly 96% of those dials are wasted on accounts with zero buying intent. That's 460 wasted dials per day across the team. At an average of 3 minutes per attempt (including research, dial, and voicemail), that's 23 hours of daily labor producing nothing.

Per month: 460 hours of wasted SDR time. At $35/hour fully loaded, that's $16,100/month lighting itself on fire. And that's just the direct cost β€” it doesn't account for the demoralization of reps who spend all day getting voicemail, or the pipeline they would have generated if they'd been calling buyers who were actively researching their category.

Step 3: Do the Math Out Loud​

This is the tactical move that separates average sellers from elite ones. Don't send the math in a follow-up email. Do it live, in the call, with the buyer.

"So let me make sure I understand. You've got 8 reps making 60 dials a day, and about 96% of those are going to accounts that aren't in-market. That's roughly 460 wasted dials daily. At 3 minutes each, that's 23 hours a day β€” nearly 500 hours a month β€” of your team's time going to voicemail. At your fully loaded cost, that's north of $16,000 a month. Over a quarter, that's almost $50,000. Does that math track?"

Two things happen when you do this:

  1. The buyer validates or corrects you. Either way, they're now co-authoring the business case. It's not your number anymore β€” it's their number.
  2. The cost becomes real. Abstract pain ("outbound isn't working great") becomes a concrete, undeniable dollar figure that they'll carry into every internal conversation about budget and priority.

Step 4: Show the Compound Cost​

A one-month cost is easy to rationalize away. "We'll deal with it next quarter." But costs compound, and showing that compounding effect is what creates genuine urgency.

The 90-day lens:

  • Month 1: $16,100 in wasted SDR labor
  • Month 2: $16,100 more, plus the pipeline deficit from Month 1 starts showing up as a revenue gap
  • Month 3: $16,100 more, plus two months of compounded pipeline deficit, plus the top-performing rep who just got recruited by a competitor because she was tired of calling dead lists

By Day 90, you're not just $48,300 down in wasted labor. You're staring at a pipeline gap that will take two quarters to recover from, and you're short one A-player who will cost $30K to replace and 4 months to ramp.

That's the real cost of "let's revisit next quarter."

This works because it mirrors how costs actually behave in business. Problems don't pause politely while the buying committee debates. They accelerate. Showing the acceleration curve is what turns a "nice to have" into a "we need to move on this."

Step 5: Connect Cost to Power​

Once you've built the cost of inaction, you have something more valuable than a compelling slide: you have a story that your champion can tell the CFO, the CEO, or whoever controls the budget.

The question "What metric is suffering?" doesn't just give you ammunition β€” it opens doors to the economic buyer. When your champion walks into the executive meeting and says, "We're burning $50K per quarter on wasted SDR time and it's compounding into a pipeline gap that threatens next year's number," that's a conversation the C-suite has to engage with.

Compare that to the champion who walks in and says, "The sales team found a cool tool for outbound. Can we get $40K in budget?" One of these gets approved. One gets tabled.

The AI Advantage: Making Invisible Costs Visible at Scale​

Here's where the game has fundamentally changed in the last 18 months.

The framework above has always worked β€” smart sellers have been quantifying inaction for decades. But there was always a gap: you could only quantify the costs you could see. And in B2B sales, most of the cost of inaction is invisible.

How many buyers visited your website this week and left without a trace? How many accounts in your TAM are actively researching your category right now β€” reading competitor reviews, searching for solutions β€” while your reps cold-call accounts that won't buy for another 18 months?

That's the new cost of inaction: the signals you're not seeing and the deals your competitors are closing because they saw them first.

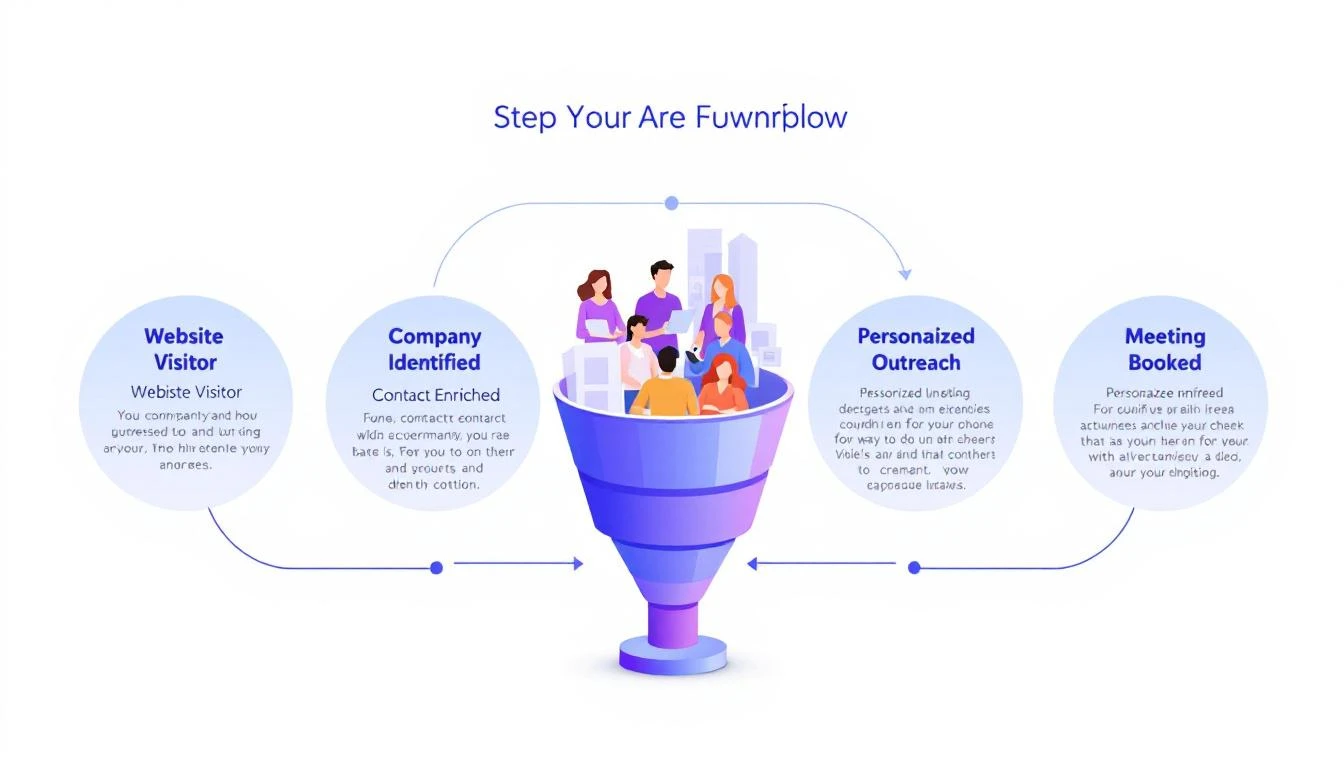
This is the problem MarketBetter was built to solve. When your platform identifies the actual companies and people visiting your site, surfaces real-time intent signals showing who's in-market, and delivers a daily playbook that tells each rep exactly who to call and why β€” you're not just making your outbound more efficient. You're eliminating an entire category of invisible cost.

Think about it through the cost-of-inaction lens:

  • Without visitor identification: 85-95% of your website traffic is anonymous. If you're getting 5,000 monthly visitors and converting 2%, that's 4,900 potential buyers you know nothing about. Even if only 10% are ICP-fit, that's 490 warm accounts your competitors might be reaching first.
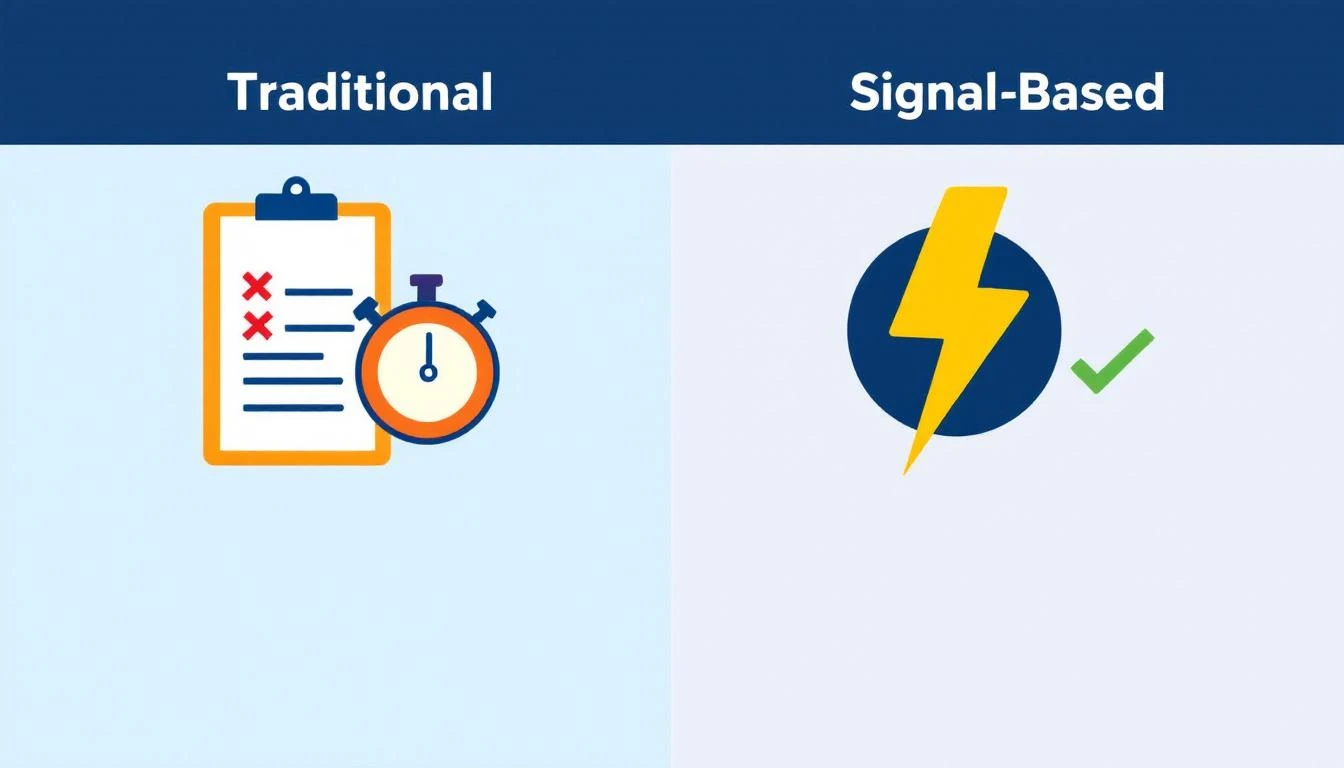
  • Without intent signals: Your reps are calling accounts at random, hoping to catch someone in a buying cycle. The math we ran earlier β€” 96% of dials wasted β€” isn't hypothetical. It's the default for any team working without signal-driven prioritization.
  • Without a daily playbook: Even reps who have access to intent data spend 60-90 minutes a day figuring out what to do with it. The operational tax of turning raw signals into a prioritized call list is its own hidden cost.

Stack those up over a quarter and you're looking at six figures of wasted motion, missed pipeline, and deals that went to whoever showed up first with a relevant message.

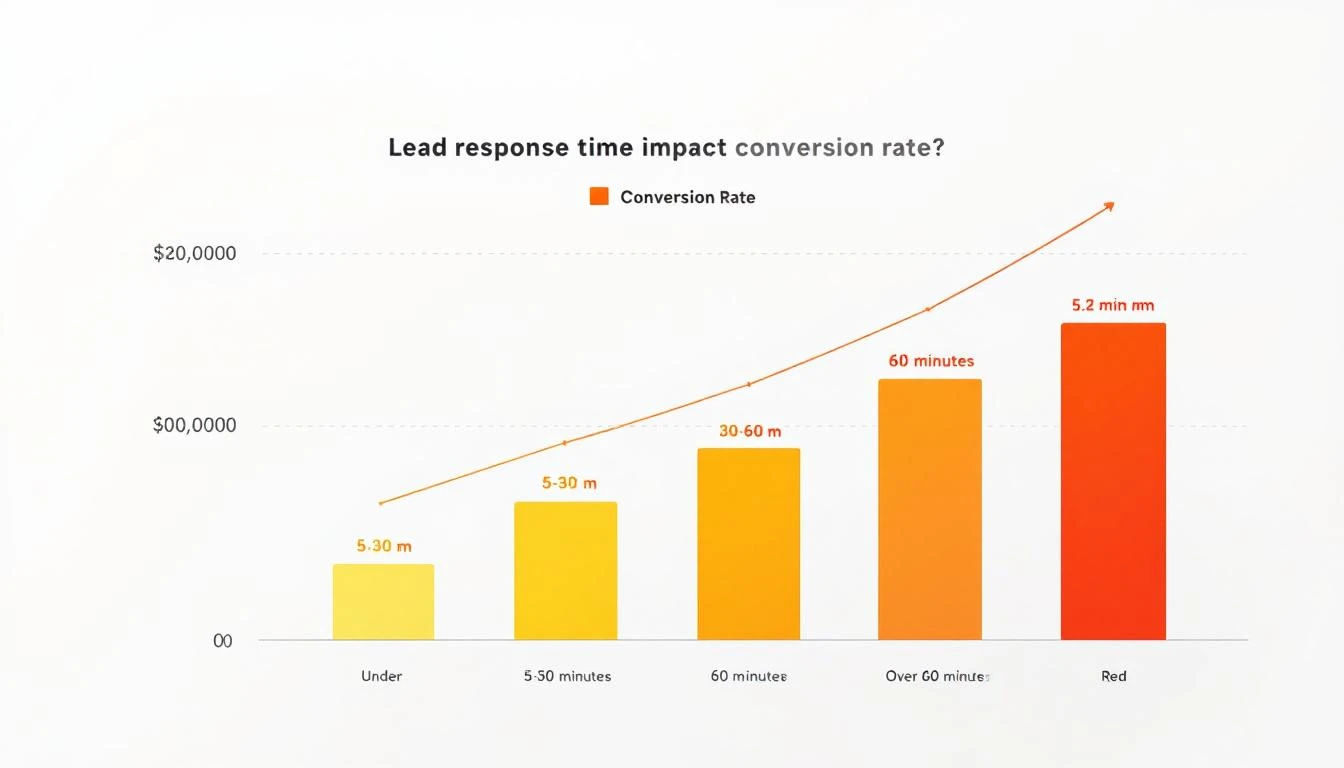
Your competitors are already responding to buyer signals you're missing. That's not a scare tactic β€” it's arithmetic. If a buyer is on your website at 10 AM and your competitor reaches out by 10:15 because their visitor ID flagged the account, you've lost the first-mover advantage before your rep finishes their morning coffee.

Putting It Into Practice​

Here's a challenge for this week: take your three most important open deals and run the cost-of-inaction exercise on each one.

  1. Identify the bleeding metric. If you don't know it, you haven't done deep enough discovery. Go back and ask.
  2. Quantify one month of inaction. What does it cost the buyer β€” in dollars, hours, or missed opportunities β€” to wait 30 more days?
  3. Project the compound cost to 90 days. Include second-order effects: the pipeline gap, the rep attrition risk, the competitive ground lost.
  4. Do the math live on your next call. Say it out loud. Let the buyer validate the numbers.
  5. Arm your champion. Give them the story, the numbers, and the 90-day projection. Make it impossible for the executive team to rationalize delay.

The deals you lose to "no decision" aren't lost because the buyer didn't feel pain. They're lost because no one translated that pain into a number that made waiting feel more expensive than buying.

That translation β€” from vague discomfort to quantified urgency β€” is the skill that separates closers from demo jockeys. And in a world where AI can now surface the signals that make the invisible costs visible, there's never been a better time to master it.


Ready to see what your invisible costs look like? MarketBetter shows you exactly who's on your site, what they care about, and how to reach them β€” before your competitors do. Start your free trial β†’

How K-12 Education IoT Companies Scale Their SDR Team with AI-Powered Territory Signals [2026]

Β· 12 min read
sunder
Founder, marketbetter.ai

Selling IoT connectivity to school districts is a patience game.

Budget cycles run on fiscal years. Decisions involve superintendents, IT directors, procurement offices, and sometimes school boards. A single deal can take 6-12 months from first contact to signed PO. And your buyer persona β€” the district technology coordinator who manages connectivity for 40 schools β€” doesn't respond to cold LinkedIn DMs.

Now imagine managing this across 1,400+ school district customers spread nationwide, with a three-person SDR team covering geographic territories. Every territory looks different. Every state has different E-Rate funding cycles. Every district has different procurement rules.

This is the reality one K-12 education IoT connectivity company faced β€” and how they transformed their go-to-market by replacing guesswork with AI-powered signals.

How Utility and Energy Monitoring Companies Build 3x More Pipeline with AI-Powered Visitor Intelligence [2026]

Β· 9 min read
sunder
Founder, marketbetter.ai

If you sell energy monitoring, utility analytics, or building performance software, you already know the challenge: your buyers don't fill out forms.

Facility managers, energy consultants, and sustainability officers visit your website to compare solutions. They read your case studies. They check your pricing page. Then they leave β€” and your sales team never knows they existed.

For most utility tech vendors, 95% of website traffic is invisible. That's not a rounding error. That's your pipeline walking out the door.

This is the story of how a utility and energy monitoring SaaS company β€” small team, tight budget, HubSpot CRM β€” turned anonymous website visitors into their primary pipeline source using AI-powered signal intelligence.

How Law Schools Use AI Chatbots to Convert More Prospective Students into Enrolled JDs

Β· 12 min read
MarketBetter Team
Content Team, marketbetter.ai

Law School AI Chatbot Enrollment Pipeline

Law school admissions offices are in crisis mode. Applications are surging β€” the Law School Admission Council reported double-digit application increases in recent cycles β€” but admissions staff hasn't grown to match. The result? Prospective students submit inquiries and wait days (or weeks) for responses. They visit the website at 11 PM on a Tuesday, read about the JD program, have questions about financial aid or clinic opportunities, and find... a contact form. By the time someone replies on Thursday, they've already scheduled visits at two competing schools.

In higher education, speed-to-response isn't a sales metric. It's an enrollment metric. And most law schools are losing candidates they've already attracted simply because they can't respond fast enough.

This is where AI chatbots are quietly transforming admissions β€” not as gimmicks, but as genuine operational infrastructure that handles the 80% of inquiries that follow predictable patterns, freeing admissions counselors to focus on the 20% that require human judgment.

How HR Benefits Technology Companies Can Build Territory-Based SDR Pipelines with AI-Powered Signals

Β· 11 min read
MarketBetter Team
Content Team, marketbetter.ai

HR Benefits Technology Territory-Based SDR Pipeline

The HR benefits technology space is booming. Employers are scrambling to modernize how they distribute, manage, and communicate employee benefits β€” and the vendors serving them are growing fast. But growth creates a specific problem: how do you scale your sales development operation when your market segments are complex and your SDR team is still small?

This is the exact challenge facing benefits distribution platforms right now. Companies in this space typically sell to HR directors, benefits administrators, and brokers β€” but the buying motion varies wildly depending on company size, industry vertical, and geographic region. A 50-person startup evaluating benefits software has completely different needs than a 5,000-person manufacturing company with unionized workers across six states.

For SDR teams in HR tech, the result is chaos: reps waste time on accounts that don't fit, messaging falls flat because it's too generic, and pipeline stalls because nobody owns the right territory.

Signal-based selling changes the equation entirely.

How to Turn Website Visitors Into Pipeline in 24 Hours: A Step-by-Step Workflow [2026]

Β· 12 min read
MarketBetter Team
Content Team, marketbetter.ai

5-step workflow: Website Visitor to Meeting Booked

Here's a stat that should make every sales leader uncomfortable: 90% of website visitor identification data sits unused in dashboards. Companies pay $500–$2,000 per month for visitor ID tools, identify hundreds of companies visiting their site, and then... do nothing with it.

The problem isn't identification. The technology for website visitor identification works. Companies show up. Names get matched. Firmographic data populates.

The problem is what happens next.

Your sales team sees a notification that "Company X visited your pricing page." Great. Now what? Who at Company X should they contact? What should they say? How do they personalize outreach when they know nothing about the visitor's specific pain?

Most teams either ignore the data entirely or blast generic "I noticed you visited our website" emails that get deleted on sight.

This guide walks you through a repeatable 5-step workflow that takes you from anonymous website traffic to a booked meeting β€” consistently, in under 24 hours.

Why Most Visitor ID Programs Fail​

Before we fix the workflow, let's understand why it breaks.

The typical visitor ID program looks like this:

  1. Install a pixel on your website
  2. Wait for data to populate a dashboard
  3. Check the dashboard (maybe once a day, maybe once a week)
  4. See a list of companies β€” some recognizable, most not
  5. Feel overwhelmed by the volume and close the tab

The gap between "identified" and "contacted" is where pipeline goes to die. According to research from Opensend, IP-to-company matching delivers 70–80% accuracy for B2B identification. That means the identification layer works. But identification without action is just expensive analytics.

Three structural problems kill most visitor ID programs:

1. No prioritization framework. Not every visitor is equal. Someone who spent 12 minutes on your pricing page and came back twice is a completely different signal than a bot crawler hitting your homepage for 3 seconds. Without scoring, every lead looks the same.

2. No enrichment workflow. Visitor ID gives you the company. You need the person. That means enrichment β€” finding the right contacts, their roles, their email addresses, their LinkedIn profiles. Doing this manually for 50+ identified companies per day isn't realistic.

3. No speed. The data that speed-to-lead research has proven for years applies here: 78% of buyers choose the vendor that responds first. If you're checking your visitor dashboard on Monday morning and reaching out Tuesday afternoon, your competitor who automated the response already booked the meeting.

Traditional vs. Signal-Based Approaches

The 5-Step Visitor-to-Pipeline Workflow​

Here's the workflow that actually converts. Each step builds on the previous one, and the entire process should take less than 24 hours from first visit to first outreach.

Step 1: Identify and Filter (Automated β€” 0 Minutes)​

Your visitor identification tool captures company-level data: company name, industry, size, pages visited, time on site, and session frequency.

But raw visitor data is noise. You need a filter.

Set up qualification criteria before you start outreach:

SignalWeightWhy It Matters
Visited pricing pageHighActive buying signal
Returned 2+ times in 7 daysHighPersistent interest
Spent 5+ minutes on siteMediumEngaged, not bouncing
Company size matches ICP (50–500 employees)HighRight fit
Viewed product/feature pagesMediumEvaluating capabilities
Homepage only, single visitLowCould be anything
Blog post only, single visitLowContent consumer, not buyer

The rule: Only pass visitors that hit at least two "High" signals or one "High" plus two "Medium" signals to the enrichment step. Everything else goes into a nurture bucket.

This filter alone eliminates 60–70% of noise and lets your team focus on the visitors who are actually evaluating solutions.

If you're using a platform with a daily SDR playbook, this filtering happens automatically. The playbook surfaces the visitors worth contacting, ranked by intent strength, so your reps don't waste time sorting through raw lists.

Step 2: Enrich to Contact Level (5–10 Minutes per Account)​

Company-level identification is necessary but insufficient. You need names.

The enrichment workflow:

  1. Identify the buying committee. For a B2B SaaS sale, this typically includes:

    • The end user (SDR Manager, Demand Gen Manager)
    • The economic buyer (VP Sales, VP Marketing, CRO)
    • The technical evaluator (RevOps, Sales Ops)
  2. Find 2–3 contacts per identified company. Don't email one person and hope for the best. Multi-thread from the start.

  3. Gather enrichment data for each contact:

    • Work email (verified, not guessed)
    • LinkedIn profile URL
    • Current role and tenure
    • Recent activity (job change, promotion, company news)

The best lead enrichment tools can do this in seconds. Manual research on LinkedIn Sales Navigator takes 5–10 minutes per account. At scale, you need automation β€” researching 20 accounts manually every day burns 2+ hours that your SDR should spend on actual conversations.

Pro tip: Prioritize contacts who recently changed jobs. Job change signals are one of the strongest buying indicators β€” someone new in a role is 5x more likely to purchase new tools in their first 90 days. If your visitor ID catches a company where the VP Sales just started 2 months ago, that's a red-hot lead.

Step 3: Build Hyper-Personalized Context (10 Minutes per Account)​

This is where most teams fail. They skip this step entirely and send generic outreach. Don't.

Here's the context you need to build for each qualified, enriched account:

From your visitor data:

  • What specific pages did they visit? (This tells you their pain)
  • How long did they spend? (This tells you their urgency)
  • Did they return multiple times? (This tells you they're evaluating)
  • What content did they engage with? (This tells you their knowledge level)

From enrichment data:

  • What does this person's LinkedIn say about their priorities?
  • Has their company raised funding, made acquisitions, or announced growth?
  • Are they hiring for roles that indicate the problem you solve?

Combine into a "context brief":

"Sarah, VP Sales at Acme Corp (150 employees, SaaS). Visited pricing page + visitor ID feature page 3 times in 5 days. Company just raised Series B. Currently hiring 4 SDRs. Sarah joined 3 months ago from Gong."

That brief takes 10 minutes to build. But it gives your SDR everything they need to write outreach that feels personal β€” because it is personal.

This is fundamentally different from the "I noticed your company visited our website" approach. You're not leading with surveillance. You're leading with relevance.

Step 4: Execute Multi-Channel Outreach (15–20 Minutes per Account)​

Single-channel outreach is dead. Email-only response rates hover around 1–2% for cold outreach. But research from SalesHive shows that multi-channel sequences β€” layering email, phone, and LinkedIn β€” can drive up to 287% more engagement and 300% more conversions compared to email alone.

Here's a 5-touch sequence framework for visitor-sourced leads:

Day 1 (within 4 hours of identification):

  • LinkedIn: Connect with a personalized note referencing their role, not your product
  • Email #1: Reference the specific problem your visitor data suggests, share a relevant insight

Day 2:

  • Phone call: Direct dial. Reference the email. Keep it to 30 seconds β€” the goal is a conversation, not a pitch

Day 4:

  • Email #2: Share a customer story from a similar company/industry. Include a specific metric

Day 7:

  • LinkedIn: Engage with their content (comment, like). Send a follow-up message referencing something they posted

Day 10:

  • Email #3: "Break-up" email. Direct ask: "Is this a priority for your team right now, or should I check back in Q3?"

Critical rules:

  • Never mention you saw them on your website. It feels invasive. Instead, reference the problem their behavior suggests
  • Lead with value, not features. "Companies your size typically lose 35% of leads to slow response time" beats "We have an AI chatbot"
  • Personalize every touch. If your email could be sent to 100 people without changing a word, it's not personalized enough
  • Email deliverability matters more than email volume. A 95% delivery rate beats a 70% delivery rate with 3x the sends

For teams running this at scale, multi-channel orchestration platforms automate the timing and channel switching. The SDR's job shifts from "manage the sequence" to "have the conversation when someone responds."

Lead Response Time Impact on Conversion Rates

Step 5: Measure, Learn, Iterate (Weekly β€” 30 Minutes)​

The workflow doesn't end when outreach goes out. You need a feedback loop.

Track these metrics weekly:

MetricBenchmarkWhat It Tells You
Visitors identified β†’ outreach sent>80%Is the workflow running?
Outreach sent within 24 hours>90%Is speed-to-lead fast enough?
Email reply rate>5%Is personalization working?
Meeting booked rate (from visitor leads)>3%Is the full funnel converting?
Visitor-sourced pipeline as % of total>25%Is this channel material?

For more on the metrics that matter, see our complete SDR metrics and KPIs guide.

Weekly iteration questions:

  1. Which page-visit patterns most often lead to meetings? Double down on driving traffic there
  2. Which outreach templates get the highest reply rates? Replicate the structure
  3. Which companies visit but don't convert? Analyze why β€” wrong ICP? Wrong messaging? Wrong timing?
  4. What's the average time from first visit to meeting booked? Target under 72 hours

Real Numbers: What This Workflow Actually Produces​

Let's run the math on a realistic scenario.

Assumptions:

  • 200 unique companies identified per month (common for B2B SaaS with 10K+ monthly visitors)
  • 30% pass the qualification filter from Step 1 = 60 qualified visitors
  • Each enriched to 2.5 contacts = 150 contacts in outreach
  • Multi-channel sequence gets 8% reply rate = 12 conversations
  • 25% of conversations convert to meetings = 3 meetings per month

Three meetings per month from a channel that didn't exist before. At a $30K ACV with a 25% close rate, that's $22,500 in new annual revenue per month β€” from website traffic you were already getting.

Scale the inputs (more traffic, better content driving ideal visitors to high-intent pages) and the math compounds. Companies running this workflow consistently report visitor-sourced pipeline becoming 15–30% of total pipeline within 6 months.

Compare this to the industry average: SDRs book 15 meetings per month across all channels. Adding 3 high-quality, warm meetings from visitor data is a 20% lift β€” from prospects who already showed buying intent by visiting your site.

The Two Approaches: DIY Stack vs. All-in-One​

You can build this workflow two ways.

The DIY stack approach:

  • Visitor ID: Leadfeeder, RB2B, or Clearbit Reveal ($200–$1,000/mo)
  • Enrichment: Apollo, ZoomInfo, or Cognism ($500–$2,500/mo)
  • Sequencing: Outreach, SalesLoft, or Instantly ($100–$500/mo per seat)
  • CRM: HubSpot or Salesforce ($50–$300/mo per seat)
  • LinkedIn: Sales Navigator ($100/mo per seat)
  • Total: $1,000–$5,000/mo + significant integration and workflow management time

The DIY approach works, but you're stitching together 5 tools, managing data flow between them, and relying on your SDR to manually connect signals to actions. The real cost of a B2B sales tech stack often exceeds what teams budget.

The all-in-one approach: Platforms like MarketBetter consolidate visitor identification, enrichment, outreach, and a daily SDR playbook into one workspace. The visitor shows up, gets scored, contacts get enriched, and a prioritized task with personalization context lands in the SDR's daily playbook β€” automatically.

The difference isn't just cost. It's time-to-action. In the DIY stack, the handoff between identification and outreach takes hours or days. In a consolidated platform, it takes minutes.

For teams evaluating options, our best AI SDR tools guide and website visitor tracking software comparison break down the options in detail.

Common Mistakes (and How to Avoid Them)​

Mistake 1: Treating every visitor equally. Fix: Implement the scoring framework from Step 1. Your pricing page visitor and your blog reader are not the same lead.

Mistake 2: Leading with "I saw you on our website." Fix: Never reference the visit directly. Lead with the problem your data suggests they have. "Companies scaling their SDR team often struggle with..." is better than "I noticed your team was on our site."

Mistake 3: Single-threaded outreach. Fix: Always contact 2–3 people per company. If the VP ignores you, the Director might not. Multi-threading increases deal velocity by 25-40% across industries.

Mistake 4: Waiting too long. Fix: First outreach within 4 hours of identification. The speed-to-lead data is unambiguous β€” response in the first 5 minutes is 21x more effective than responding after 30 minutes.

Mistake 5: No feedback loop. Fix: Review metrics weekly. If reply rates drop below 3%, your personalization needs work. If meetings drop off, your qualification criteria are too loose.

The Bottom Line​

Website visitor identification isn't a strategy. It's an ingredient. The strategy is the workflow that turns that ingredient into pipeline.

The 5-step workflow β€” Identify β†’ Enrich β†’ Contextualize β†’ Execute β†’ Iterate β€” gives you a repeatable process for converting anonymous interest into booked meetings. The teams that do this well don't just have better tools. They have better systems.

Most of your competitors have visitor ID installed. Almost none of them have a systematic workflow for acting on the data. That's your advantage β€” if you actually build the workflow.

Ready to see how MarketBetter automates this entire workflow? Book a demo and see your visitor data turned into a prioritized SDR playbook β€” automatically.

The ABM Strategy That Hit 75% of Monthly Meeting Quota in One Day

Β· 15 min read
MarketBetter Team
Content Team, marketbetter.ai

Every ABM team has had this moment.

You've done the work. You've built the account list. You've run the campaigns. Your dashboards are glowing green β€” engagement scores are up, accounts are "warming," and the data says your target list is moving through the funnel.

Then you walk into the sales standup and hear: "So... where are the meetings?"

That's the gap. And it's where most ABM programs quietly die β€” not from bad strategy, but from optimizing for the wrong outcome.

One enterprise ABM leader at a $3B+ company figured this out the hard way. And the moment they changed what they were optimizing for, everything clicked.

"The moment everything got easier was when I stopped optimizing for 'warm accounts' and started optimizing for meetings. If you can get meetings, pipe takes care of itself."

This isn't theory. One prioritization sprint using this approach helped an SDR team hit 75% of their monthly meeting quota in a single day.

Here's exactly how it works.


The Problem: "Warm Accounts" Don't Pay the Bills​

Most ABM programs are built around a version of the same pitch to sales: "We've identified accounts showing intent. These accounts are warm. Go work them."

Sounds reasonable. But here's what actually happens:

  1. Marketing hands over a list of "warm" accounts based on engagement scores, intent data, or some weighted model
  2. Sales looks at the list and shrugs β€” "Great, but who do I call? What do I say? Why should they take my meeting?"
  3. The list sits in a spreadsheet while reps go back to working their own pipeline
  4. Marketing wonders why sales isn't "following up" on perfectly good accounts

The fundamental disconnect: salespeople don't care about warm accounts. They care about meetings. That's the unit of value in their world. Not an engagement score. Not an intent signal. A meeting on the calendar.

"If you optimize for pipe, it takes too long. If you can get meetings, they'll turn into pipe eventually. Sales will figure it out."

When this ABM leader stopped measuring success by "accounts showing engagement" and started measuring by "meetings booked," everything changed β€” not just the metrics, but how the entire GTM team operated.


The Three-Step ABM Machine​

The framework that emerged is deceptively simple. Three steps, executed with discipline every single week.

Step 1: Universe of Accounts, All Scored and Tiered by ICP Fit​

Before you can prioritize, you need to know your universe.

This starts with the classic funnel narrowing:

  • TAM (Total Addressable Market): Every company that could buy your product
  • SAM (Serviceable Addressable Market): The subset you can actually reach and serve
  • ICP Accounts: The companies that look like your best customers β€” right industry, right size, right tech stack, right buying patterns

Every account in your CRM should be scored and tiered by how closely they match your ICP. This isn't a one-time exercise. It's a living model that gets updated as you learn what "good" actually looks like from your closed-won deals.

Why this matters for meetings: You can't prioritize who's most likely to book if you haven't already established who's worth booking with. The ICP tier is your foundation β€” it tells you which meetings are worth chasing and which ones are just activity for activity's sake.

Most teams have this step done (or think they do). The real magic happens in Steps 2 and 3.

Step 2: Weekly Prioritization of People Most Likely to Book a Meeting​

This is where the framework gets sharp.

Every week, the ABM team runs a prioritization sprint. Not on accounts β€” on people. Specific humans at specific companies who are showing signals that they're likely to take a meeting right now.

The signal stack has two layers:

Contact-level signals (signals about the person):

  • Intent data engagement β€” Are they personally researching your category or related topics?
  • Web visitor identification β€” Have they visited your site? Which pages? How many times?
  • Hiring manager activity β€” Are they hiring for roles that suggest they need your solution?
  • Job changer signals β€” Did they recently move to a new company? (Champions in new seats are gold.)
  • Email engagement β€” Are they opening and clicking your emails? Replying?

Account-level signals (signals about the company):

  • Review site intent β€” Is the company actively evaluating solutions on G2, TrustRadius, etc.?
  • News and trigger events β€” Funding rounds, leadership changes, expansion announcements, regulatory shifts
  • Engagement scores β€” Overall account-level interaction with your brand across channels
  • Digital projects and initiatives β€” Are they launching projects that create a need for what you sell?

The output of this weekly sprint isn't a warm account list. It's what we call the MLTBM list β€” "Most Likely to Book a Meeting." A ranked set of 15–20 specific contacts per rep, each with concise "reasons to reach out now" and AI-driven outbound cadences matched to their specific behavior and account context.

This is the key shift. You're not telling sales "this account is warm." You're telling them "this person, at this company, is showing these specific behaviors, and here's the play to get them on the phone."

Step 3: Surround Sound Micro Campaigns​

Once you know who to target and why, you hit them from every angle.

"Surround sound" means the contact sees your brand across multiple channels in a compressed timeframe β€” not with generic brand awareness, but with specific, relevant messaging tied to the exact signal they're showing.

Here's what that looks like in practice:

  • Someone researching your category on review sites? β†’ Email with a comparison guide + LinkedIn connection + retargeting ads featuring customer proof points
  • A champion who just changed jobs? β†’ Congratulatory LinkedIn message + personalized email referencing their previous experience with your solution + phone call from their aligned rep
  • A hiring manager posting roles that suggest they need your product? β†’ Email about how your solution reduces the need for that hire + LinkedIn content about the business case + direct mail if warranted
  • A contact who visited your pricing page twice this week? β†’ Immediate phone call + email with an ROI calculator + chatbot engagement on next visit

The key word is micro. These aren't broad campaigns blasting the same message to 500 accounts. They're tight, 1-to-few plays targeting 10–20 contacts per sprint with highly specific messaging.

The channels: email, LinkedIn, phone, social, direct mail, ads, chatbot β€” whatever combination makes sense for the signal. The point is that when the contact is ready to engage, your brand is already everywhere they look.


Why This Works: The Meeting Math​

Let's break down why optimizing for meetings is fundamentally different from optimizing for warm accounts.

The warm account approach:

  1. Score accounts β†’ 2. Declare them "warm" β†’ 3. Hand to sales β†’ 4. Hope for meetings β†’ 5. Eventually, maybe, pipeline

The meeting-first approach:

  1. Score and tier accounts β†’ 2. Identify specific people showing booking signals β†’ 3. Run surround sound plays β†’ 4. Book meetings β†’ 5. Pipeline follows naturally

The difference isn't just semantic. It changes:

  • What you measure: Meeting conversion rate per signal type, not "account engagement score"
  • How you talk to sales: "Here are 15 people who are likely to book this week and why" vs. "Here are 50 warm accounts"
  • What campaigns you build: Specific micro-plays per signal vs. broad nurture tracks
  • How fast you iterate: Weekly sprints vs. quarterly campaign reviews

And the results speak for themselves. That 75%-of-monthly-quota-in-one-day stat wasn't a fluke. It was the natural outcome of giving SDRs a pre-prioritized list of people who were already showing signals that they wanted to talk.

"The old way was 'the accounts say we're warm now.' But salespeople don't care about warm accounts. They want meetings. The moment I shifted to giving them meetings instead of warm accounts, everything got easier."


The Signal Stack: Building Your "Most Likely to Book" List​

Let's go deeper on how to actually build this signal stack, because this is where execution separates the top ABM programs from everyone else.

Layer 1: Contact Signals (The Person)​

Signal TypeWhat It Tells YouMeeting Likelihood
Web visitor (pricing/demo pages)Active evaluationπŸ”΄ Very High
Job changer (champion at new company)New budget, known advocateπŸ”΄ Very High
Email reply or click-throughDirect engagement🟠 High
Intent data (category research)Early-stage evaluation🟑 Medium-High
Hiring for relevant rolesBuilding the team = building the need🟑 Medium
Social engagement (likes, comments)Awareness, not yet active🟒 Medium-Low

Layer 2: Account Signals (The Company)​

Signal TypeWhat It Tells YouMeeting Likelihood
Review site activity (G2, etc.)Actively comparing solutionsπŸ”΄ Very High
Funding/expansion newsBudget unlocked🟠 High
Engagement score spikeMulti-threaded interest🟠 High
Digital project announcementsCreates a trigger need🟑 Medium-High
Leadership changeNew priorities, new budget🟑 Medium
Industry regulation changeCompliance-driven urgency🟑 Medium

The combination is what matters. A contact showing intent data signals at an account with a spiking engagement score is exponentially more likely to book than either signal alone.

Your weekly sprint should stack-rank contacts by combined signal strength β€” the people at the best-fit accounts showing the most buying behavior right now.


Signal Alpha: The Niche Signals That Only Matter to You​

Here's where the best ABM machines separate themselves from everyone else.

Most signals β€” intent data, job changes, funding rounds β€” are available to every competitor in your space. They're valuable, but they're not unique. Everyone is tracking the same triggers and hitting the same contacts at the same time.

Signal Alpha is the unique advantage you get from niche signals β€” the one or two signals that translate directly to intent for your business alone, because only you understand why they matter.

Think about it:

  • If you sell observability software, your best customers are companies with spikes in "tech stack complexity." A job posting for a Snowflake Engineer signals the company is investing in data infrastructure, which means their stack is getting more complex, which means they need your product. That hiring signal is meaningless to 99% of vendors β€” but it's gold for you.

  • If you sell EHS compliance software, a job posting mentioning "ISO 14001" or "OSHA reporting" at a manufacturing company means they're investing in safety infrastructure. Run ads and outreach talking about how you consolidate compliance across frameworks. Nobody else is tracking that signal.

  • If you sell cloud fax to healthcare systems, a hospital posting for a "HIPAA Compliance Officer" or announcing an Epic migration signals they're modernizing infrastructure. That's your moment.

  • If you sell sales intelligence, companies with a recent increase in the number of ads running across channels might signal they're scaling GTM β€” and struggling with targeting. That's a signal only you care about.

The formula: Find the niche signal β†’ build messaging specifically against it β†’ run outbound + ads to contacts showing that signal.

These niche signals won't appear in any intent data vendor's dashboard. You have to figure them out yourself, based on deep understanding of your best customers' buying journeys. But when you find them, they're devastating β€” because your competitors aren't tracking them, your messaging is hyper-relevant, and your timing is perfect.

How to find your Signal Alpha:

  1. Interview your 5 best customers: "What was happening at your company when you decided to buy?"
  2. Look for patterns β€” was there a hiring wave? A new project? A compliance deadline? A tech migration?
  3. Figure out where that signal shows up publicly (job boards, news, press releases, LinkedIn)
  4. Build tracking for it and add it to your MLTBM prioritization model
  5. Test outbound against it for 2-4 weeks and measure meeting conversion

The best ABM teams aren't just tracking the obvious signals. They're finding the weird, specific, nobody-else-cares-about-this signals that perfectly predict buying intent for their unique product. That's Signal Alpha.


From Weekly to Daily: Accelerating the Playbook​

The enterprise ABM leader who pioneered this framework ran it on a weekly cadence. Weekly prioritization sprints. Weekly campaign launches. Weekly measurement.

But here's the thing about signals: they decay fast. The contact who hit your pricing page on Monday is a hot lead on Tuesday and a cold one by Friday. The job changer who started their new role this morning is most reachable today, not next week.

The logical evolution of this framework is a daily MLTBM playbook β€” the same "most likely to book a meeting" logic, but refreshed every single day, with your Signal Alpha signals baked in.

Imagine this:

Every morning, your SDR team opens a dashboard that shows them exactly who to call, email, and connect with on LinkedIn today β€” ranked by signal strength, with the specific signals listed next to each contact. No research required. No guessing. Just execute.

That's what the daily version of this framework looks like:

  • Web visitor identification feeds you the contact signals in real-time β€” who visited, which pages, how many times
  • Intent data integrations surface contacts actively researching your category
  • The daily playbook is the weekly "most likely to book" list, but regenerated every 24 hours with fresh signal data
  • Multi-channel execution (email + phone + social) is the surround sound campaign, orchestrated from a single platform

This is exactly the approach signal-based selling was built around β€” narrowing your total addressable market to a daily set of prioritized contacts based on live buying signals. And it's the same philosophy behind the ABM frameworks that actually work in practice.

How MarketBetter Makes This Operational​

This three-step ABM machine β€” ICP-tiered accounts, signal-based prioritization, surround sound execution β€” is powerful as a framework. But running it manually is brutal. The weekly sprint alone can eat 4–6 hours of an ABM leader's time, and by the time you've finished prioritizing, the freshest signals are already stale.

MarketBetter was purpose-built to operationalize this exact playbook:

  • Visitor identification captures web visitor signals automatically β€” you know exactly who's hitting your site and which pages they care about
  • The Daily Playbook is your "most likely to book" list, regenerated every day with stacked contact and account signals, so your team always knows who to prioritize
  • Email automation and the smart dialer let your reps execute surround sound campaigns across email and phone from a single screen β€” no tab-switching, no manual logging
  • AI chatbot engages returning visitors in real-time, converting "pricing page visit" signals into live conversations before the contact bounces

Instead of a weekly manual sprint, MarketBetter runs the signal stack continuously and serves up the prioritized output to your reps every morning. The framework stays the same. The execution becomes instant.


Putting It Into Practice: Your First Week​

If you want to test this approach before committing to any tooling, here's a manual version you can run starting Monday:

Day 1 (Monday): Build Your Signal Stack

  • Pull your ICP-tiered account list from your CRM
  • Layer in any intent data you have access to
  • Check your website analytics for visitor signals from target accounts
  • Scan LinkedIn for job changers and new hires at target accounts
  • Review email engagement data from the past 30 days

Day 2 (Tuesday): Run Your First Prioritization Sprint

  • Stack-rank contacts by combined signal strength
  • Select your top 15–20 "most likely to book" contacts
  • For each contact, document the specific signal(s) driving prioritization
  • Share the list with your SDR team β€” not as "warm accounts," but as "here's who to call and why"

Days 3–5 (Wednesday–Friday): Execute Surround Sound

  • Each prioritized contact gets touched across at least 3 channels
  • Messaging is tied to the specific signal (not generic outreach)
  • Track meetings booked, not just activities completed

End of Week: Measure and Iterate

  • How many meetings did the prioritized list generate?
  • Which signal types converted best?
  • What channels drove the most responses?
  • Feed learnings back into next week's sprint

You'll likely see results in the first sprint. The ABM leader who built this system saw it immediately:

"We ran the first prioritization sprint and handed the list to the SDR team. They hit 75% of their monthly meeting quota that day. That's when I knew we were onto something."


Free Tool

Try our Lookalike Company Finder β€” find companies similar to your best customers in seconds. No signup required.

The Bottom Line​

The best ABM programs in the world aren't optimizing for "warm accounts." They're optimizing for meetings.

The framework is three steps:

  1. Build your universe β€” every account scored and tiered by ICP fit
  2. Prioritize people, not accounts β€” weekly (or daily) sprints to identify who's most likely to book, based on stacked contact and account signals
  3. Execute surround sound β€” micro campaigns across every channel, driven by specific signals, compressed into tight windows

The mindset shift is simple but profound: stop telling sales that accounts are warm. Start getting them meetings.

If you can get meetings, pipeline takes care of itself. Sales will figure it out.


Ready to turn your signal stack into a daily meeting machine? See how MarketBetter operationalizes this exact playbook β†’