KPI Lead Generation The Definitive Guide to a Predictable Sales Pipeline
Key Performance Indicators (KPIs) are your revenue engine's dashboard. They're the specific, vital signs you track to see if your lead generation efforts are actually working—turning curious prospects into real, paying customers. It’s about more than just counting leads; it’s about measuring the quality and efficiency of your entire funnel. This is how you build a predictable growth machine.
Moving Beyond Volume With KPI Lead Generation
For too long, marketing and sales have been stuck on a hamster wheel, chasing an ever-growing pile of leads. The old thinking was simple: more leads equals more revenue. But this volume-first approach, while it feels productive, creates chaos. Sales reps drown in low-quality contacts, and good prospects slip through the cracks. It's like trying to navigate a ship by counting the waves instead of using a compass.
A modern kpi lead generation strategy changes the game completely. You stop asking "how many?" and start asking "how effective?" Instead of just stuffing the top of the funnel, you use precise metrics to measure what happens at every single stage, from first touch to closed deal. It turns guesswork into a clear, predictable process.
Before we dive deep, let's get a quick lay of the land. These are the seven core metrics that every growth-focused team needs to have on lock. Think of this as your high-level cheat sheet.
The 7 Essential Lead Generation KPIs at a Glance
| KPI | What It Measures | Why It Matters for Growth |
|---|---|---|
| MQLs & SQLs | The number of leads that meet marketing's criteria and are then accepted by sales. | Tracks the health of your funnel's handoff point and ensures marketing delivers quality. |
| Conversion Rate | The percentage of leads that complete a desired action (e.g., MQL to SQL, demo to close). | Pinpoints where your process is strong and where prospects are dropping off. |
| Cost Per Lead (CPL) | The total cost of a marketing campaign divided by the number of leads generated. | Measures the raw efficiency of your lead acquisition channels. |
| Customer Acquisition Cost (CAC) | The total sales and marketing cost to acquire a new customer. | The ultimate bottom-line metric for sustainable growth. If this is too high, you're losing money. |
| Customer Lifetime Value (LTV) | The total revenue a business can expect from a single customer account. | Informs how much you can afford to spend on CAC and identifies your most valuable customer segments. |
| LTV:CAC Ratio | The ratio of lifetime value to customer acquisition cost. | A critical indicator of long-term profitability. A healthy ratio (often 3:1 or higher) is key. |
| Pipeline Velocity | The speed at which leads move through your sales pipeline to become revenue. | Shows how quickly you're turning opportunities into cash and highlights bottlenecks. |
Now, let's unpack what these numbers really mean for your team and how to put them to work.
The Problem With a Volume-Only Approach
Relying only on lead count creates massive friction between your teams and hides deep, costly problems. This old-school method almost always leads to:
- Wasted Sales Effort: Your reps burn valuable time chasing leads that were never going to buy. It’s a fast track to burnout and frustration.
- Misaligned Marketing Spend: The marketing team keeps pouring budget into channels that look great on paper (big lead numbers!) but deliver almost zero actual revenue.
- Zero Visibility: Leadership has no real clue about the pipeline's health, making it nearly impossible to forecast accurately.
This disconnect is a painfully common story. The average organization generates 1,877 leads per month. But with lead-to-MQL (Marketing Qualified Lead) rates hovering between 5%-15%, it's obvious most of that volume is just noise. You can dig into why a focused demand generation strategy is the only way to win in this environment.
Why a KPI-Driven Framework Wins
Adopting a KPI-focused mindset is like upgrading from a basic car dashboard with just a speedometer to a high-performance system showing engine health, fuel efficiency, and GPS navigation. It gives you the visibility you need to build a revenue machine that can scale. It empowers your team to make smart decisions based on hard data, not just gut feelings.
By measuring metrics like MQL-to-SQL conversion rates, Customer Acquisition Cost (CAC), and pipeline velocity, you gain a clear understanding of what’s working and what isn’t. This clarity separates high-growth teams from stagnant ones, enabling you to optimize your processes for maximum impact.
Decoding Your Sales Funnel From MQLs to Opportunities
If you want to master lead generation, you have to speak the language of your sales funnel. Every single lead that comes your way is on a journey, and tracking how they move through it is like reading a map that points straight to revenue. The first step? Learning to tell the curious window-shoppers from the serious buyers.
Think of a Lead as anyone who’s raised their hand, even slightly, by giving you their contact info. They’re on your radar, but that’s all you know. It’s a wide net, catching everyone from a newsletter subscriber to someone who downloaded a whitepaper.
The first real filter is turning them into a Marketing Qualified Lead (MQL). This is someone your marketing team has flagged as being more likely to buy, based on what they’ve done or who they are.
An MQL is like a window shopper who keeps coming back to the same store to look at the same item. They haven't asked for help, but their repeat visits are a dead giveaway that they’re more than just a casual browser.
This is where your strategy, your metrics, and your optimization efforts have to snap together. If they don't, you're just guessing.
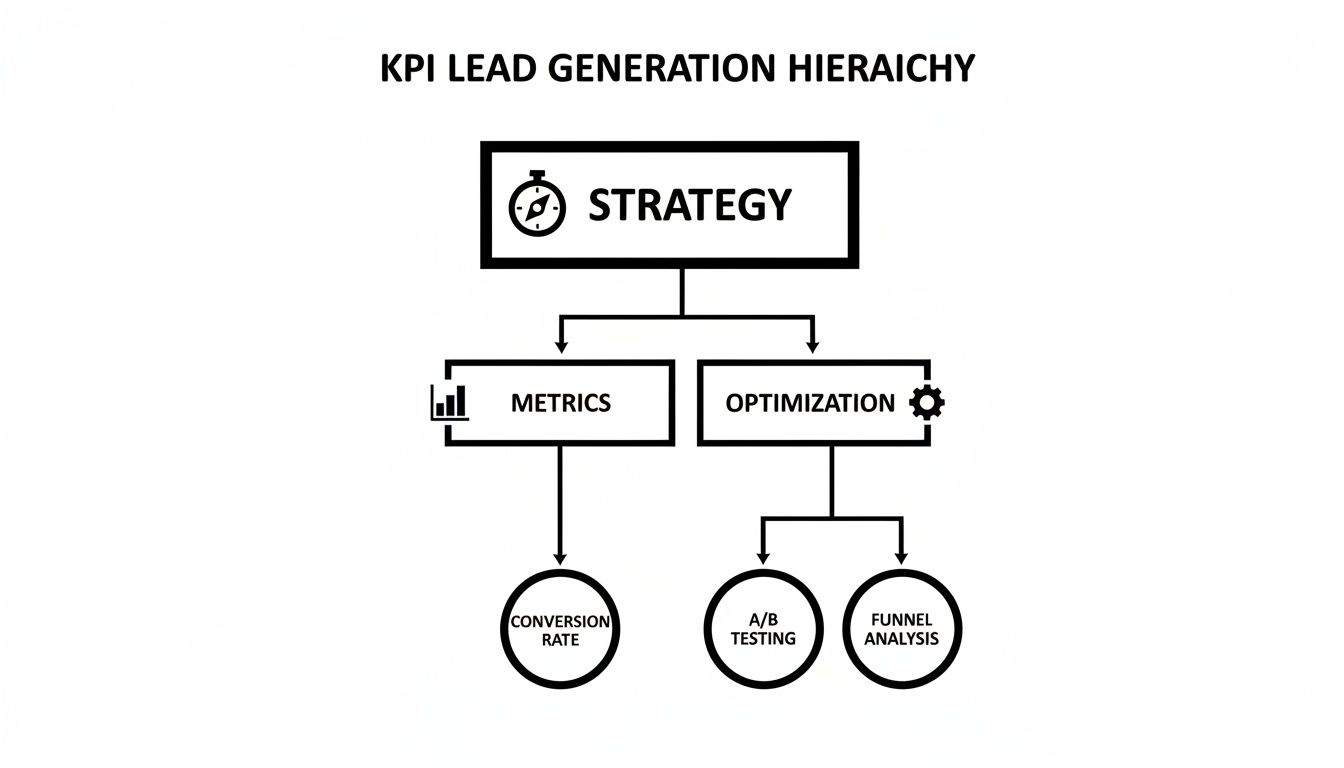
This hierarchy makes it plain: a solid strategy tells you which metrics to watch. Those metrics, in turn, show you what to optimize. One piece can't function without the others.
The Critical Handoff from MQL to SQL
The next stop is the Sales Qualified Lead (SQL). This is a big one. An SQL is an MQL that the sales team has looked at and officially accepted as a real prospect worth their time. Sales has confirmed the lead has a genuine need, the budget to solve it, and the authority to pull the trigger.
Back to our store analogy, an SQL is the customer who walks right up to an associate and says, "I'd like to try this on." Their intent is crystal clear. This handoff from MQL to SQL is precisely where things fall apart for a lot of companies, creating a nasty rift between marketing and sales.
The fix is a clear Service Level Agreement (SLA) that lays out the rules of engagement. This gets everyone on the same page.
- Actionable Tip: Host a joint workshop between marketing and sales leaders. Have sales bring examples of 5 fantastic leads and 5 terrible ones from the past month. Use this comparison to collaboratively define the exact criteria for an MQL.
- Establish Handoff Protocol: How, and when, do MQLs get passed to sales? Is it an automated trigger in your CRM, or does someone manually assign it?
- Set Follow-Up Expectations: How fast does a sales rep have to contact a new SQL? Speed is everything here; you have to strike while the iron is hot.
A tight process is essential for understanding what’s really happening with your prospects. We dig into this much deeper in our guide to B2B customer journey mapping.
Calculating Your Funnel Conversion Rates
Once you have these stages locked down, you can finally measure how well your funnel is actually working. These simple formulas tell you exactly where you’re leaking leads and where you're crushing it.
- Lead-to-MQL Rate: (Total MQLs / Total Leads) x 100
- MQL-to-SQL Rate: (Total SQLs / Total MQLs) x 100
- SQL-to-Opportunity Rate: (Total Opportunities / Total SQLs) x 100
Let’s say you brought in 1,000 leads last month, and 100 of them became MQLs. Your Lead-to-MQL rate is a clean 10%. If sales accepted 20 of those MQLs as SQLs, your MQL-to-SQL rate is 20%. Suddenly, you have hard numbers to work with.
Setting Realistic Benchmarks
So, what’s a “good” number? While it varies, a healthy MQL-to-SQL conversion rate often lands somewhere between 10% and 30%. But here’s the kicker: the source of that lead changes everything.
For B2B teams, some channels just plain work better than others.
LinkedIn, for example, is a monster for B2B lead gen, proving to be 277% more effective than other social platforms. A staggering 40% of B2B marketers point to it as their top source for high-quality leads. While a lead from organic search closes at a respectable 14.6%, the laser-focused nature of LinkedIn often yields better results—its Lead Gen Forms, for instance, average a 13% conversion rate.
The real goal isn't to hit some universal benchmark. It’s to establish your own baseline. Track these conversion rates for every single channel. Find out what truly moves the needle for your business, and then just focus on making it a little bit better, month after month.
Measuring the True Cost and Value of Your Leads
Once you move past the alphabet soup of MQLs and SQLs, you get to the metrics that really matter in the boardroom: cost and value. Tracking conversions is fundamental, but understanding the actual financial health of your lead generation engine is what separates the businesses that scale from those that just spin their wheels.
This is where you draw a straight line from marketing and sales activity right to the bottom line.
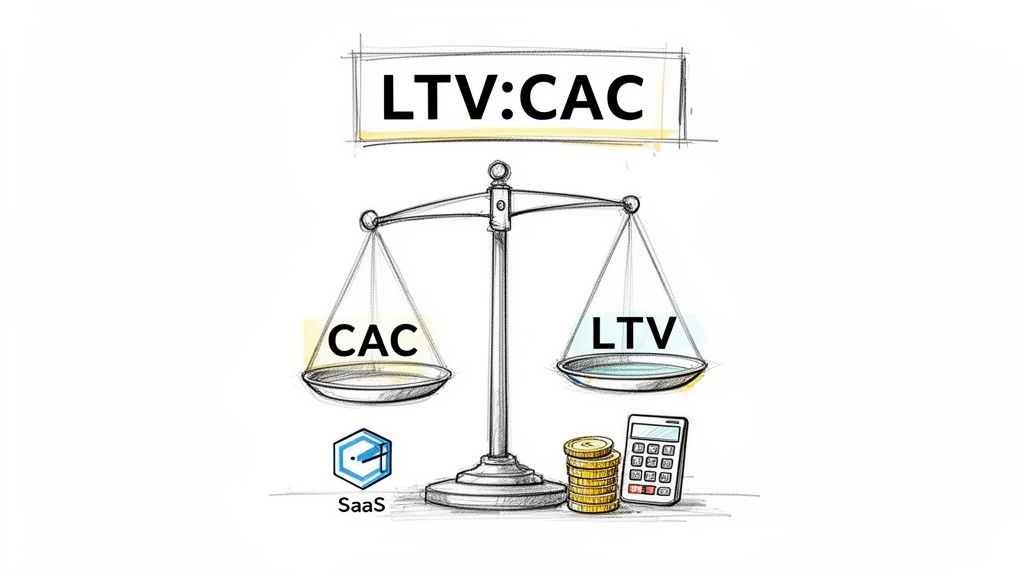
Two of the most powerful KPIs in your entire arsenal are Customer Acquisition Cost (CAC) and Customer Lifetime Value (LTV). Think of them as two sides of a scale. One side measures what you spend to get a customer, and the other measures what that customer is worth to you over time. Sustainable growth is all about keeping that scale balanced in your favor.
Calculating Customer Acquisition Cost
Your CAC is simply the total cost of your sales and marketing efforts divided by the number of new customers you brought in over a specific period. It’s the price tag for winning a new deal.
Let's say your SaaS company spent $50,000 on sales and marketing last quarter. That number should include everything—ad spend, content creation, trade shows, sales salaries, commissions, the works. In that same quarter, you closed 50 new customers.
- Formula: Total Sales & Marketing Spend / Number of New Customers = CAC
- Example: $50,000 / 50 Customers = $1,000 CAC
So, on average, it cost you $1,000 to bring each new customer in the door. Is that good? Bad? Honestly, by itself, that number is meaningless. You can't know until you measure the other side of the equation. Digging deeper into metrics like Cost Per Action (CPA) is also key. To get a better handle on this, check out this guide on Adwords Target CPA and Google Ads Cost Per Action.
Understanding Customer Lifetime Value
Customer Lifetime Value (LTV) flips the script. It predicts the total revenue you can expect from a single customer over the entire time they do business with you. It forces you to think beyond the first sale and focus on long-term profitability.
Sticking with our SaaS example, let's say your average customer pays $250 per month and sticks around for about 36 months.
- Formula: Average Monthly Revenue Per Customer x Customer Lifespan = LTV
- Example: $250/month x 36 months = $9,000 LTV
Now that $1,000 CAC is starting to look pretty great, isn't it? You're spending $1,000 to acquire a customer who will generate $9,000 in revenue. That's a fantastic return. You can play around with these numbers for your own business with our customer acquisition cost calculator.
The LTV:CAC Ratio: A Business Health Check
The real magic happens when you put these two KPIs together in the LTV:CAC ratio. This single number is one of the most powerful indicators of your business model's health and scalability.
For our SaaS company, the ratio is $9,000:$1,000, which simplifies to a rock-solid 9:1. A healthy benchmark for most SaaS businesses is generally considered to be 3:1 or higher. A ratio below that might mean you’re spending too much to grow. A very high ratio like 9:1, believe it or not, could mean you're underinvesting in marketing and leaving money on the table.
How Attribution Models Skew Your CAC
Heads up: the way you assign credit for a lead directly impacts your CAC calculation. Different attribution models will spit out very different numbers, so picking the right one is critical for making smart budget decisions.
| Attribution Model | How It Works | Impact on CAC & Actionable Advice |
|---|---|---|
| First-Touch | Gives 100% credit to the very first marketing interaction a lead had. | Favors top-of-funnel channels like blogs. Action: Use this model if your primary goal is brand awareness and filling the top of your funnel. |
| Last-Touch | Gives 100% credit to the final touchpoint right before the conversion. | Favors bottom-of-funnel channels like demo request pages. Action: Use this if you need to optimize for immediate conversions and prove direct ROI. |
| Multi-Touch | Spreads credit across multiple touchpoints in the buyer's journey (e.g., Linear, U-Shaped). | Gives a more balanced, realistic view. Action: Implement this model once you have a mature marketing operation to understand the full customer journey. |
Choosing an attribution model isn’t just a technical task; it's a strategic decision that dictates where your money goes. A first-touch model might tell you to pour cash into SEO, while a last-touch model screams for more paid search ads.
Tracking kpi lead generation ROI reveals that direct sales is the top metric for 28.6% of companies, with a healthy benchmark demanding a 3:1 ROI or better. While B2C often gets higher lead volume, B2B teams can see incredible ROI from channels like affiliate marketing (46%), paid ads (43%), and email (34%). This is exactly why you have to track revenue per lead source—it tells you where to invest for profitable growth, not just busywork.
How to Build Your High-Performance Lead Generation Dashboard
Knowing your KPIs is one thing. Visualizing them in a way that actually forces action is something else entirely. A well-designed dashboard isn't just a collection of charts—it's the command center that turns raw data into a clear story about your pipeline's health.
This is what moves your kpi lead generation strategy from a theoretical exercise into a practical, daily tool for your entire revenue team. The goal is to create a single source of truth that aligns everyone, from the C-suite down to the individual sales rep. A great dashboard tears down data silos and gives managers the visibility they need to coach effectively.
But here’s the biggest mistake I see teams make: building a one-size-fits-all dashboard.
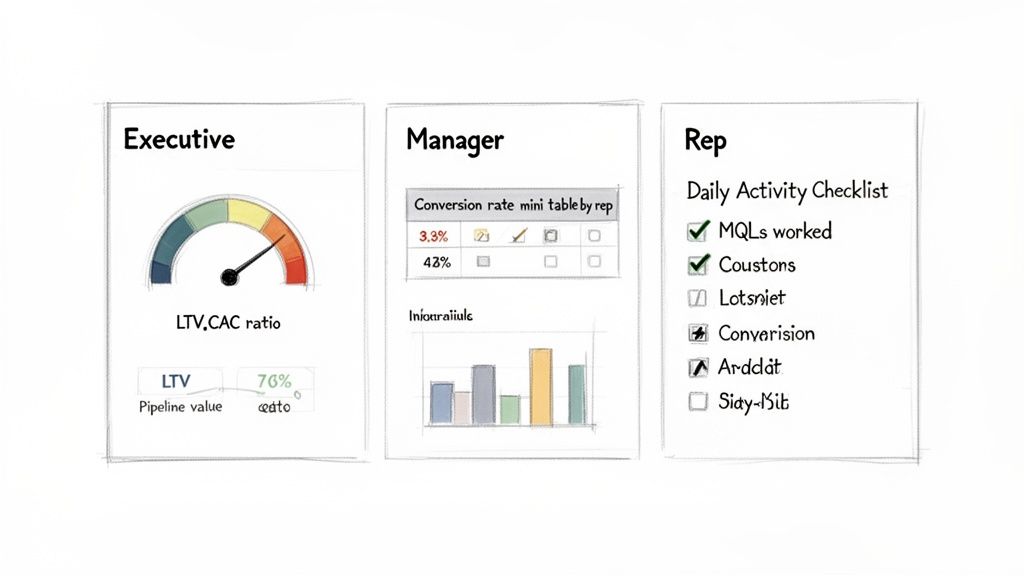
A VP of Sales and a Sales Development Representative (SDR) care about wildly different metrics. A powerful dashboard is tailored to the audience, showing each person exactly what they need to see to win in their role.
The Executive View: High-Level Strategy
For VPs of Sales and other execs, the dashboard needs to tell a story about business health and long-term strategy. They need the 30,000-foot view, not a granular look at daily dials. Their focus is on outcomes and profitability.
Key reports for an executive dashboard should include:
- Pipeline Value by Stage: This shows the total potential revenue sitting in each part of the sales funnel. It's the bedrock of accurate forecasting.
- LTV:CAC Ratio Over Time: This is the ultimate health check. Are we acquiring customers profitably, and is that trend getting better?
- Customer Acquisition Cost by Channel: This answers a critical question: "Where should we invest our next marketing dollar for the best return?"
- Sales Cycle Length: This tracks how long it takes to close a deal, instantly highlighting efficiency gains or ugly bottlenecks in the process.
The Manager View: Team Performance and Coaching
An SDR or BDR Manager needs a dashboard that’s all about team performance and coaching opportunities. Their job is to manage the engine, not just look at the destination. They have to spot trends, identify top performers, and see who needs help before the month is a wash.
A manager's dashboard should be built around:
- MQL to SQL Conversion Rate by Rep: This is arguably the single most important metric for an SDR leader. It shows which reps are most effective at qualifying leads and is a direct measure of whether they trust the leads marketing is sending.
- Meetings Booked and Attended per Rep: This tracks the primary output of the SDR team. A big gap between booked and attended meetings can signal a need for better follow-up or confirmation processes.
- Activity Volume vs. Outcomes: Are the reps making the most calls also booking the most meetings? If not, it's a flashing red light for a coaching session on quality over quantity.
This comparative view is crucial. It separates the busy reps from the effective ones, allowing managers to clone the successful behaviors of their top performers across the rest of the team.
This dashboard from Salesforce provides a clear example of how to visualize multiple KPIs, from lead sources to closed business, in a single view.
This kind of visualization allows leaders to instantly compare performance across different segments and pinpoint which channels are driving the most valuable leads.
The Individual Rep View: Daily Execution
Finally, the individual sales rep needs a dashboard that tells them one thing: "What should I do right now?" Their view should be hyper-focused on daily execution and personal performance against their quota. It’s less about long-term trends and all about immediate action.
An individual rep’s dashboard must include:
- Daily Activities Completed (Calls & Emails): A simple scorecard tracking their progress against daily activity goals.
- New MQLs Worked: This shows them the fresh leads that need their immediate attention.
- Meetings Booked this Week/Month: A clear progress bar showing exactly how close they are to hitting quota.
- Connect Rate & Conversation Rate: These are efficiency metrics that help them self-diagnose. If their connect rate is low, they might need to adjust their call times or the quality of their data.
By building these three distinct views, you create a system where everyone is looking at the right data for their role. This alignment turns your dashboard from a simple reporting tool into a strategic asset that drives performance at every level of the organization.
Actionable Strategies to Improve Your KPIs
Knowing your numbers is one thing. Actually making them move is where the real work begins. This is how you stop staring at dashboards and start pulling the levers that build a predictable revenue engine.
A low MQL-to-SQL conversion rate is one of the most common—and frustrating—bottlenecks. This number is a gut check on how well your sales and marketing teams are aligned. When it’s low, it means sales reps are rejecting leads, which wastes time, burns cash, and creates a ton of friction between the two teams.
The fix isn't just about telling everyone to "work harder." It's about getting smarter with lead quality and prioritization. This means tightening up your MQL scoring, but more importantly, it means acting on intent data. When a prospect hits your pricing page or a key contact at a target account starts engaging with a competitor’s content, those are alarm bells. They tell you exactly who to call right now.
Refining Your Inbound and Outbound Motion
Great lead follow-up isn't just about being fast; it's about being relevant and making things easy for the buyer. A clunky, confusing website will kill your conversion rates before a lead even gets to your team. Making sure your site is a smooth, intuitive experience is the first step in capturing high-quality leads. For a deeper dive, check out these 7 Ways To Improve Website Usability And Accessibility.
But once you capture those leads, the real race starts. The biggest challenge for most SDR teams is simply managing the chaos of signals and tasks. A traditional, manual workflow is a recipe for missed opportunities and rep burnout.
A typical SDR starts their day staring at a messy CRM, trying to guess which of the 100+ tasks matters most. They spend an hour digging up research on an account, another 30 minutes crafting a generic email, then jump to another tool to make calls—often forgetting to log the activity. That fragmented process absolutely kills momentum.
This is where a modern, AI-powered task engine changes the entire game. Instead of relying on guesswork, the system turns those buyer signals directly into prioritized tasks for your team.
Manual vs. AI-Powered SDR Workflows: A KPI Comparison
The difference between a manual workflow and an AI-powered one is night and day. It directly impacts core metrics like Connect Rate and Meetings Booked. The old way forces reps to be researchers, data entry clerks, and part-time writers. The new way lets them actually sell.
The table below breaks down the real-world impact of shifting from a traditional, chaotic workflow to one driven by a smart task engine. You're not just asking reps to work harder; you're giving them a system that makes every single action more effective.
Manual vs AI-Powered SDR Workflows: A KPI Comparison
This table illustrates the direct impact of adopting an AI-driven task engine on core SDR performance metrics, comparing a traditional workflow with one optimized for efficiency and execution.
| KPI | Manual SDR Workflow (The Old Way) | AI-Powered Workflow (The MarketBetter Way) |
|---|---|---|
| Daily Activities Per Rep | Low and inconsistent; reps get bogged down by research and data entry. | High and consistent; reps focus entirely on executing calls and sending emails. |
| Connect Rate | Lower; calls are often poorly timed and lack immediate, relevant context. | Higher; calls are prioritized based on real-time buying signals from the prospect. |
| Meetings Booked | Unpredictable; success relies heavily on individual rep intuition and manual effort. | Predictable and scalable; driven by a systematic, data-informed process. |
| CRM Data Hygiene | Poor; reps often forget to log calls and outcomes, leading to bad data and worse reporting. | Excellent; all activities are logged automatically, ensuring a clean and reliable CRM. |
An AI-driven platform like marketbetter.ai transforms this entire process. It acts as an SDR's co-pilot, turning buyer signals into a prioritized task list. Reps never have to guess what to do next because the system tells them, providing all the context they need in one place.
- Prioritized Tasks: Instead of a random to-do list, reps get a clear "next best action" based on account fit and recent buyer activity.
- Context-Aware Emails: The AI generates relevant, personalized emails based on the prospect’s persona and recent signals, cutting prep time from hours to seconds.
- Integrated Dialer: Reps can click-to-dial directly from their task list in Salesforce or HubSpot, with every call and outcome logged automatically. No more manual data entry.
By moving to an AI-powered workflow, you systematically remove the bottlenecks that kill your KPIs. Reps spend less time on admin work and more time having meaningful conversations with high-intent prospects—the fastest path to a healthy pipeline.
From Insights to Revenue: Putting Your Lead Gen KPIs to Work
Let's be honest. Mastering kpi lead generation isn't about staring at a spreadsheet until your eyes glaze over. It’s about building a predictable system that turns raw numbers into a real, sustainable revenue engine. The goal is to stop chasing deals reactively and start selling proactively, armed with data that fills your pipeline.
We’ve walked through the whole process, from the foundational metrics all the way to building dashboards that actually tell you what to do next. But the real magic happens when you connect those insights to what your team does every single day. Your most critical numbers—MQL-to-SQL conversion, CAC, LTV, and Pipeline Velocity—aren’t just metrics. They’re the vital signs of your growth strategy, telling you exactly where your process is humming along and, more importantly, where it’s falling apart.
Having a solid measurement framework is mission-critical, but it's only half the battle. The other half is giving your sales team the tools to act on that data without getting bogged down.
Tracking your KPIs is step one. Empowering your team to hit them is the real game. A dashboard can show you a low connect rate, but it can’t pick up the phone and make the next dial for your SDR. True optimization happens when sharp insights are paired with powerful execution.
This is where strategy meets the messy reality of the sales floor. The gap between knowing what to do and actually doing it is where most teams stumble. A chaotic workflow, packed with manual research and endless CRM data entry, is the sworn enemy of a high-performing sales team. It burns out your best reps and lets your hottest leads go cold.
Discover how an AI-powered SDR task engine can turn your data into more conversations and a healthier pipeline. MarketBetter.ai closes the gap between insight and execution, ensuring your team not only knows which leads to contact but has the tools to do it faster and more effectively than ever before. This is how you stop just measuring your pipeline and start actively building it.
Try our AI Lead Generator — find verified LinkedIn leads for any company instantly. No signup required.
Got Questions About Lead Gen KPIs? Let's Get Practical.
Even with the best strategy laid out, the real world always throws a few curveballs. When the rubber meets the road, practical questions pop up. Here are straight, no-fluff answers to some of the most common ones we hear about managing kpi lead generation.
What’s a “Good” MQL to SQL Conversion Rate?
Everyone wants a magic number here, but the honest answer is: it depends. A solid benchmark to aim for is somewhere between 10% and 30%. But that range is massive for a reason.
Think about it. A lead who fills out a "Request a Demo" form is practically raising their hand to talk to sales. Their conversion rate is going to be sky-high. Compare that to someone who downloaded a top-of-funnel eBook. They're just kicking the tires. Lumping them together and judging them by the same number is a recipe for bad decisions.
The smarter move is to benchmark your channels against each other. If your organic search leads are converting to SQLs at 25%, but your paid social leads are stuck at 8%, that’s a real, actionable insight. You've just learned where your highest-quality leads are coming from.
Chasing an arbitrary industry number is a waste of time. The real goal is to get a baseline for your own funnel, figure out which channels are pulling their weight, and find ways to make incremental gains every single month. That's how you build a predictable growth engine.
For an SDR Manager, What’s the One KPI That Matters Most?
If an SDR Manager has to pick one metric to obsess over, it has to be "Meetings Booked" or "Sales Accepted Opportunities." That's the scoreboard. It's the tangible output of their team's hustle and the clearest signal they're actually contributing to the sales pipeline.
But you can't manage the scoreboard directly. Great managers live in the leading indicators—the daily activities they can actually coach and influence to change the final outcome.
These are the levers they can pull:
- Activities per Rep: Is the team putting in the raw effort? Are they making enough calls and sending enough emails to even have a shot?
- Connect Rate: When they dial, is anyone actually picking up? A low connect rate might signal a problem with the data, the call times, or the phone numbers themselves.
- Conversation-to-Meeting Rate: This is the big one. When they get someone on the phone, are they skilled enough to turn that conversation into a booked meeting? This is where coaching on messaging and objection handling pays dividends.
A drop in Meetings Booked is a lagging indicator; the damage is already done. But a drop in the Connect Rate? That's a leading indicator. It's the flashing red light on the dashboard that gives a manager time to dive in and fix the problem before the team misses its number.
Tracking KPIs is the first step. The next is giving your team the tools to actually hit them. See how marketbetter.ai turns your data into more conversations and a much healthier pipeline.