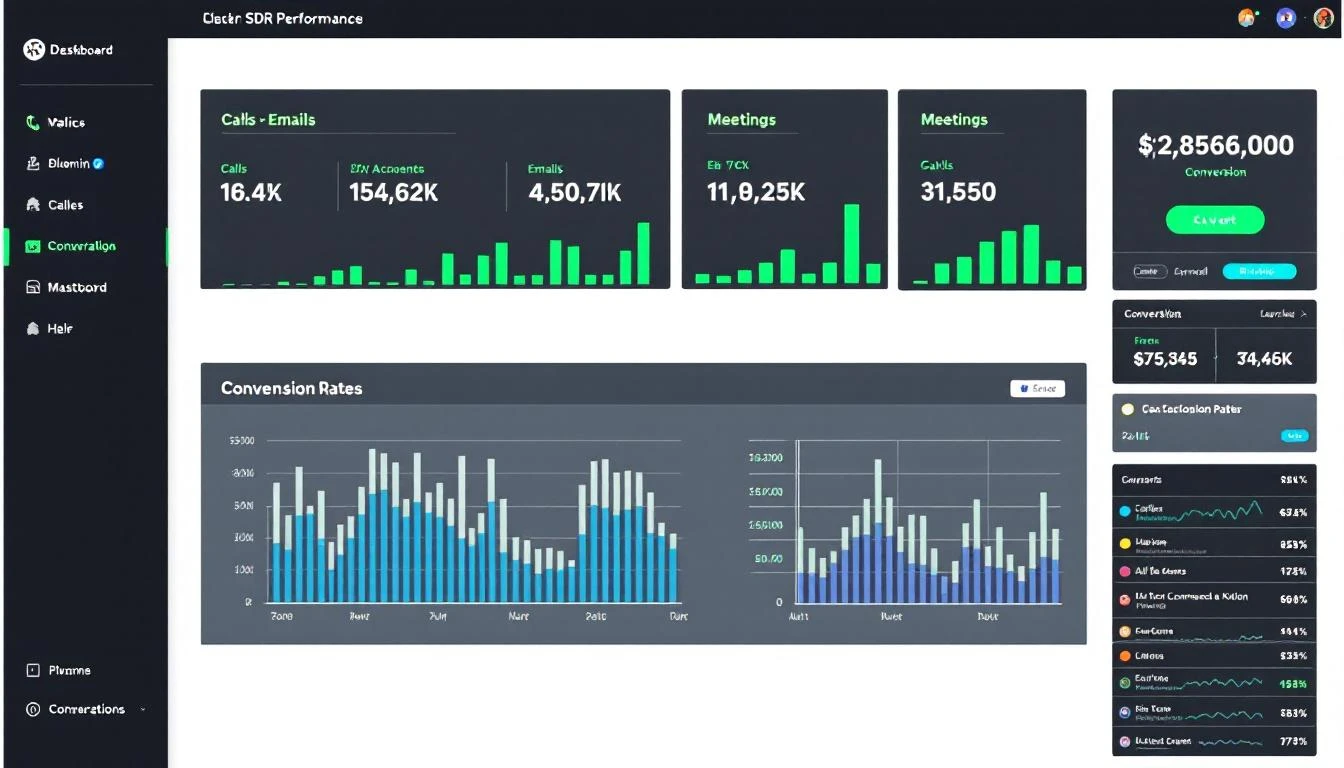
AI-Powered SDR Performance Benchmarking with Codex [2026]

"How do I know if my SDRs are actually performing well?"
Every sales leader asks this question. And most answer it with vibes instead of data.
You compare reps against each other (which creates toxic competition). You look at quota attainment (which ignores activity quality). You check dashboards that show what happened but not why.
What if you could automatically benchmark every rep against:
- Their own historical performance
- Team averages
- Industry standards
- Top performer patterns
That's what we're building today using GPT-5.3 Codex.
Why Traditional Benchmarking Fails
Most SDR benchmarking is broken because it measures the wrong things:
Problem 1: Vanity metrics Tracking "emails sent" rewards volume over quality. A rep sending 200 garbage emails looks better than one sending 50 personalized messages that book meetings.
Problem 2: Outcome bias Some reps get better territories or warmer leads. Comparing raw meeting counts ignores the inputs.
Problem 3: Lag indicators only By the time quota attainment shows a problem, it's too late. You need leading indicators.
Problem 4: Manual analysis RevOps pulls reports quarterly, builds a deck, presents to leadership. By then the data is stale.
The AI Benchmarking Framework
Here's how to build a real-time, AI-powered benchmarking system:
Metrics That Actually Matter
Activity Quality Metrics:
| Metric | What It Measures | Why It Matters |
|---|---|---|
| Response Rate | % of outreach getting replies | Shows message resonance |
| Positive Response Rate | % of replies that are interested | Filters out "unsubscribe" replies |
| Personalization Score | AI-assessed email customization | Predicts engagement |
| Sequence Completion | % of prospects going through full sequence | Shows follow-up discipline |
Efficiency Metrics:
| Metric | What It Measures | Why It Matters |
|---|---|---|
| Activities per Meeting | How many touches to book | Efficiency indicator |
| Time to First Meeting | Days from lead assignment to demo | Speed metric |
| Connect Rate | % of calls that reach a person | Dialing effectiveness |
| Talk Time Ratio | Time talking vs listening on calls | Conversation quality |
Conversion Metrics:
| Metric | What It Measures | Why It Matters |
|---|---|---|
| MQL to SQL Rate | % of leads that become opportunities | Quality of qualification |
| Meeting Show Rate | % of booked meetings that happen | Qualifying strength |
| Pipeline Generated | Dollar value created | Ultimate output |
Building the Benchmarking System
Step 1: Data Collection with Codex
First, use Codex to build a data extraction pipeline:
codex "Create a Node.js script that:
1. Pulls activity data from HubSpot for all sales users
2. Categorizes activities by type (email, call, meeting, LinkedIn)
3. Calculates daily/weekly/monthly aggregates per rep
4. Stores results in a PostgreSQL database

Include error handling and rate limiting for the HubSpot API."
Codex's mid-turn steering is perfect here—you can refine the output as it generates:
"Actually, also include email open rates and click rates from the engagement data."
Step 2: Benchmark Calculation
Now create the benchmarking logic:
// benchmarks.js - Generated and refined with Codex

const calculateBenchmarks = async (repId, timeframe = '30d') => {
  const repData = await getRepMetrics(repId, timeframe);
  const teamData = await getTeamMetrics(timeframe);
  const historicalData = await getRepHistorical(repId, '90d');

  return {
    rep: repId,
    period: timeframe,

    // Compare to team
    vsTeam: {
      emailResponseRate: {
        rep: repData.emailResponseRate,
        teamAvg: teamData.avgEmailResponseRate,
        percentile: calculatePercentile(repData.emailResponseRate, teamData.allEmailResponseRates),
        delta: ((repData.emailResponseRate - teamData.avgEmailResponseRate) / teamData.avgEmailResponseRate * 100).toFixed(1)
      },
      meetingsBooked: {
        rep: repData.meetingsBooked,
        teamAvg: teamData.avgMeetingsBooked,
        percentile: calculatePercentile(repData.meetingsBooked, teamData.allMeetingsBooked),
        delta: ((repData.meetingsBooked - teamData.avgMeetingsBooked) / teamData.avgMeetingsBooked * 100).toFixed(1)
      },
      activitiesPerMeeting: {
        rep: repData.activitiesPerMeeting,
        teamAvg: teamData.avgActivitiesPerMeeting,
        // Lower is better here
        percentile: 100 - calculatePercentile(repData.activitiesPerMeeting, teamData.allActivitiesPerMeeting),
        delta: ((teamData.avgActivitiesPerMeeting - repData.activitiesPerMeeting) / teamData.avgActivitiesPerMeeting * 100).toFixed(1)
      }
    },

    // Compare to self
    vsSelf: {
      emailResponseRate: {
        current: repData.emailResponseRate,
        previous: historicalData.avgEmailResponseRate,
        trend: repData.emailResponseRate > historicalData.avgEmailResponseRate ? 'improving' : 'declining'
      },
      meetingsBooked: {
        current: repData.meetingsBooked,
        previous: historicalData.avgMeetingsBooked,
        trend: repData.meetingsBooked > historicalData.avgMeetingsBooked ? 'improving' : 'declining'
      }
    },

    // Industry benchmarks (from Bridge Group, Gartner, etc.)
    vsIndustry: {
      emailResponseRate: {
        rep: repData.emailResponseRate,
        industryAvg: 0.023, // 2.3% is typical B2B cold email
        status: repData.emailResponseRate > 0.023 ? 'above' : 'below'
      },
      connectRate: {
        rep: repData.connectRate,
        industryAvg: 0.028, // 2.8% typical cold call connect
        status: repData.connectRate > 0.028 ? 'above' : 'below'
      },
      meetingsPerMonth: {
        rep: repData.meetingsBooked,
        industryAvg: 12, // Typical SDR quota
        status: repData.meetingsBooked >= 12 ? 'on pace' : 'below pace'
      }
    }
  };
};
Step 3: Pattern Analysis
This is where AI really shines—identifying what top performers do differently:
// pattern-analysis.js

const analyzeTopPerformers = async () => {
  const topReps = await getRepsAbovePercentile(90);
  const patterns = {};

  // Time patterns
  patterns.emailTiming = analyzeEmailSendTimes(topReps);
  // Result: "Top performers send emails Tuesday-Thursday, 7-9am local time"

  // Sequence patterns
  patterns.sequenceLength = analyzeSequenceLengths(topReps);
  // Result: "Top performers use 7-touch sequences, not 12"

  // Content patterns
  patterns.subjectLines = await analyzeSubjectLines(topReps);
  // Result: "Top performers use questions and specific pain points"

  // Call patterns
  patterns.callBehavior = analyzeCallMetrics(topReps);
  // Result: "Top performers have 2:1 listen-to-talk ratio"

  return patterns;
};
Step 4: Automated Insights
Don't just show data—generate recommendations:
// insights.js - AI-generated analysis

const generateRepInsights = async (repId) => {
  const benchmarks = await calculateBenchmarks(repId);
  const patterns = await analyzeTopPerformers();
  const repBehavior = await getRepBehaviorData(repId);

  const prompt = `
    Analyze this SDR's performance and provide 3 specific, actionable recommendations.

    Rep Benchmarks: ${JSON.stringify(benchmarks)}
    Top Performer Patterns: ${JSON.stringify(patterns)}
    Rep Behavior Data: ${JSON.stringify(repBehavior)}

    Format as:
    1. [Specific Issue]: [Concrete Action]

    Be direct. No fluff.
  `;

  const insights = await claude.complete(prompt);
  return insights;
};
Example output:
Insights for Marcus Chen - Feb 2026
Email timing is off: You send most emails at 2pm when open rates are 12%. Top performers send 7-9am when rates hit 28%. Action: Reschedule email sends in your sequence settings.
Sequence too long: Your 12-step sequence has 4% completion. Team average 7-step sequence has 34% completion. Prospects ghost after step 6. Action: Condense to 7 touches, make final touch a breakup email.
Call talk ratio inverted: You talk 68% of calls. Top performers listen 65% of calls. Prospects who talk more are 2x more likely to book. Action: Ask more open-ended questions, especially about current process.
Deploying to Slack
Make this actionable by pushing to where reps already work:
// Weekly benchmark report - OpenClaw cron

const weeklyBenchmarkReport = async () => {
  for (const rep of salesTeam) {
    const benchmarks = await calculateBenchmarks(rep.id, '7d');
    const insights = await generateRepInsights(rep.id);

    await slack.postMessage({
      channel: rep.slackDm,
      blocks: [
        {
          type: "header",
          text: { type: "plain_text", text: "📊 Your Weekly Performance" }
        },
        {
          type: "section",
          text: {
            type: "mrkdwn",
            text: `*Response Rate:* ${benchmarks.vsTeam.emailResponseRate.rep}% (Team avg: ${benchmarks.vsTeam.emailResponseRate.teamAvg}%)\n*Meetings:* ${benchmarks.vsTeam.meetingsBooked.rep} (${benchmarks.vsTeam.meetingsBooked.delta}% vs team)\n*Efficiency:* ${benchmarks.vsTeam.activitiesPerMeeting.rep} activities per meeting`
          }
        },
        {
          type: "section",
          text: {
            type: "mrkdwn",
            text: `*🎯 This Week's Focus:*\n${insights}`
          }
        }
      ]
    });
  }
};
Manager Dashboard
Leadership needs aggregate views:
// manager-view.js

const generateManagerDashboard = async (managerId) => {
  const team = await getTeamByManager(managerId);

  const dashboard = {
    teamHealth: {
      onPace: team.filter(r => r.pipelineGenerated >= r.quota * 0.9).length,
      atRisk: team.filter(r => r.pipelineGenerated < r.quota * 0.7).length,
      total: team.length
    },

    topPerformers: team
      .sort((a, b) => b.percentileRank - a.percentileRank)
      .slice(0, 3)
      .map(r => ({ name: r.name, highlight: r.topMetric })),

    needsAttention: team
      .filter(r => r.trend === 'declining' || r.percentileRank < 25)
      .map(r => ({
        name: r.name,
        issue: r.biggestGap,
        recommendation: r.topInsight
      })),

    teamPatterns: {
      bestDay: findBestPerformingDay(team),
      worstDay: findWorstPerformingDay(team),
      commonBlocker: findCommonIssue(team)
    }
  };

  return dashboard;
};
Real Impact Numbers
Teams using AI-powered benchmarking see:
| Metric | Before | After | Change |
|---|---|---|---|
| Time spent on performance reviews | 4 hrs/week | 30 min/week | -87% |
| Reps hitting quota | 48% | 67% | +40% |
| Underperformance detection time | 45 days | 7 days | -84% |
| Coaching session effectiveness | "okay" | Targeted | Qualitative |
Getting Started
Here's your implementation plan:
Week 1: Data Foundation
- Audit what activity data you have in your CRM
- Use Codex to build extraction scripts
- Set up a simple database for metrics
Week 2: Benchmark Logic
- Implement team comparison calculations
- Add industry benchmarks from reports
- Build self-comparison (vs historical)
Week 3: AI Analysis
- Connect Claude for insight generation
- Analyze top performer patterns
- Create recommendation engine
Week 4: Distribution
- Build Slack notifications
- Create manager dashboards
- Train team on using insights
Try our AI Lead Generator — find verified LinkedIn leads for any company instantly. No signup required.
What's Next?
Once benchmarking is running, you can:
- Predict quota attainment — Use leading indicators to forecast before month-end
- Auto-assign coaching — Route struggling reps to training automatically
- Territory optimization — Rebalance based on performance capacity
- Hiring profiles — Model what makes reps successful to improve recruiting
The goal isn't surveillance—it's helping every rep become a top performer.
Ready to stop guessing and start measuring? Book a demo to see how MarketBetter combines AI-powered insights with SDR workflow automation.
Related reading: