AI-Powered Customer Churn Prediction with Claude Code [2026]
Customer churn is the silent killer of SaaS businesses. By the time a customer formally announces they're leaving, the decision was made weeks or months earlier.
What if you could predict churn before it happens—and intervene while there's still time?
This guide shows you how to build an AI-powered churn prediction system using Claude Code that monitors customer health signals, identifies at-risk accounts, and triggers proactive outreach before customers walk out the door.
Why Traditional Churn Indicators Fail
Most companies rely on lagging indicators for churn:
- NPS surveys — Customers who've already decided to leave give low scores
- Support ticket volume — By the time tickets spike, frustration is entrenched
- Usage metrics — Monthly logins don't capture engagement quality
- Renewal conversations — Too late to change minds
The problem? These signals arrive after the damage is done. You're reacting to churn, not preventing it.
The Leading Indicator Advantage
AI-powered churn prediction flips the script by analyzing leading indicators:
| Lagging Indicator | Leading Indicator |
|---|---|
| Low NPS score | Decreased feature adoption rate |
| Cancellation request | Reduced login frequency trend |
| Support escalation | Fewer power users active |
| Contract non-renewal | Declining API call volume |
| "We're evaluating alternatives" | Champion job change detected |
Claude Code's 200K context window lets you analyze months of customer behavior patterns simultaneously—something impossible with simpler tools.
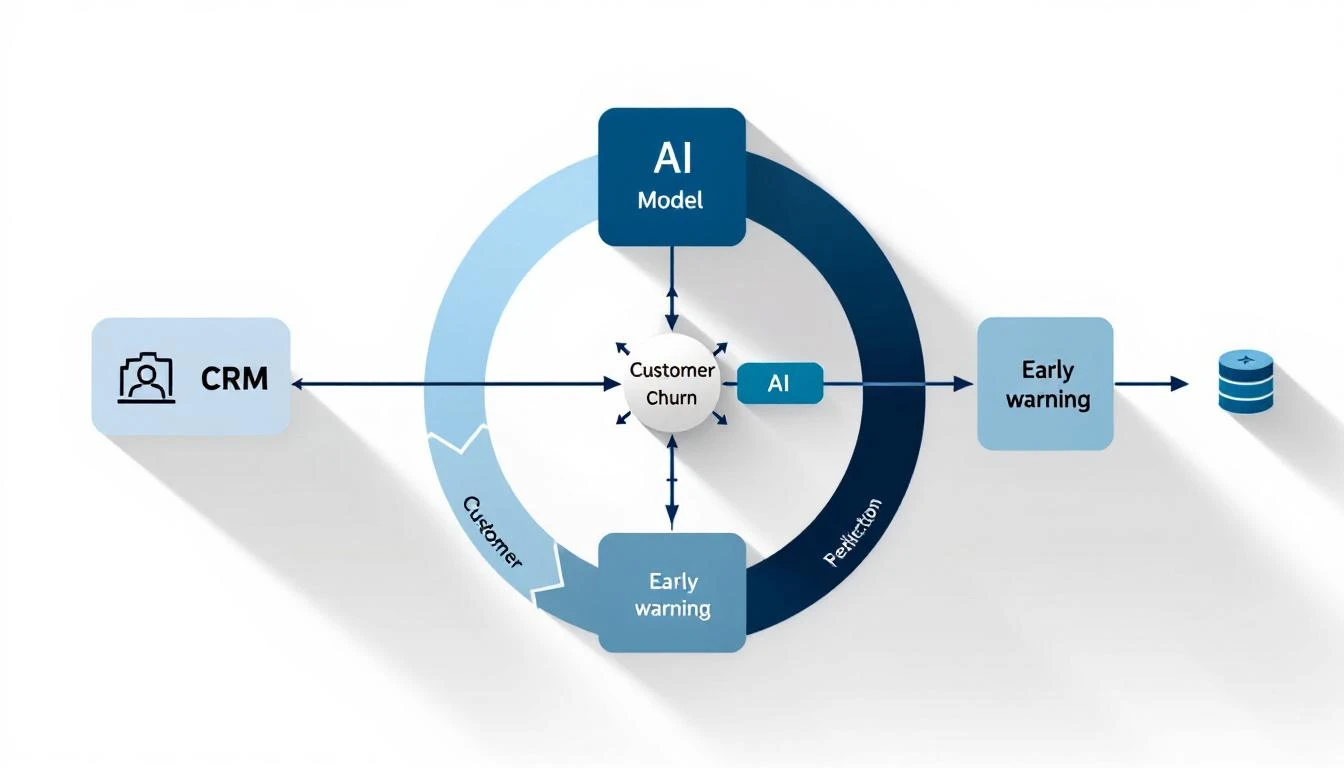
The Churn Prediction Architecture
Here's what we're building:
- Data Collection Layer — Pull signals from CRM, product analytics, and support
- Claude Code Analysis — Process patterns and assign risk scores
- Alert System — Notify CSMs about at-risk accounts with context
- Action Triggers — Auto-queue intervention workflows
Let's build each component.
Step 1: Define Your Churn Signals
Before writing code, identify the signals that predict churn in your business. Here's a framework:
Product Engagement Signals
- Login frequency (trending down?)
- Feature adoption breadth (using fewer features?)
- Key feature usage (stopped using sticky features?)
- Time-in-app (shorter sessions?)
- Power user count (champions leaving?)
Relationship Signals
- Executive sponsor changes
- Champion job changes (LinkedIn monitoring)
- Support ticket sentiment (increasingly negative?)
- Response time to your emails (slower?)
- Meeting no-shows (increasing?)
Business Signals
- Company funding/layoffs news
- Competitive mentions in calls
- Pricing discussions initiated
- Contract terms questions
- "Evaluation" language in emails
Implementation Priority
Score each signal by predictive power and data availability:
| Signal | Predictive Power | Data Available | Priority |
|---|---|---|---|
| Champion job change | Very High | 1 | |
| Feature adoption drop | High | Product analytics | 1 |
| Login frequency decline | Medium-High | Product | 2 |
| Support sentiment | Medium | Zendesk | 2 |
| Email response lag | Medium | CRM | 3 |
Step 2: Build the Data Aggregation Layer
Create a script that pulls customer health data from your systems:
// customer-health-collector.js
const healthSignals = {
  async collectForAccount(accountId) {
    const [crm, product, support, linkedin] = await Promise.all([
      this.getCRMData(accountId),
      this.getProductMetrics(accountId),
      this.getSupportHistory(accountId),
      this.getChampionStatus(accountId)
    ]);

    return {
      accountId,
      collectedAt: new Date().toISOString(),
      signals: {
        engagement: product,
        relationship: crm,
        support: support,
        champions: linkedin
      }
    };
  },

  async getProductMetrics(accountId) {
    // Return: logins, feature usage, API calls, active users
    // Compare current period vs previous period
    return {
      loginTrend: -15, // % change
      featureAdoption: 72, // % of features used
      powerUsers: 3, // count
      apiVolume: 45000 // calls this month
    };
  }
};
The key insight: Claude needs trending data, not point-in-time snapshots. A customer with 50 logins this month isn't at risk—unless they had 100 logins last month.
Step 3: The Claude Code Churn Analysis Prompt
Here's where the magic happens. This prompt turns raw signals into actionable risk assessments:
You are analyzing customer health data to predict churn risk.

ACCOUNT DATA:
{customerHealthData}

HISTORICAL PATTERNS (from churned accounts):
- 73% of churned accounts showed >20% login decline in final 60 days
- 81% had champion job changes within 90 days of churn
- 68% reduced feature adoption by >30% before canceling
- Average time from first warning signal to churn: 47 days

ANALYSIS FRAMEWORK:

1. RISK SCORE (0-100):
   - 0-25: Healthy
   - 26-50: Monitor
   - 51-75: At Risk
   - 76-100: Critical

2. For each signal, assess:
   - Current value vs baseline
   - Trend direction and velocity
   - Correlation with historical churn patterns

3. OUTPUT FORMAT:
{
  "riskScore": number,
  "riskLevel": "healthy|monitor|at-risk|critical",
  "primaryRiskFactors": [
    {
      "signal": "string",
      "severity": "low|medium|high|critical",
      "evidence": "string",
      "suggestedAction": "string"
    }
  ],
  "recommendedInterventions": [
    {
      "action": "string",
      "urgency": "immediate|this-week|this-month",
      "owner": "CSM|Executive|Support",
      "talking_points": ["string"]
    }
  ],
  "healthSummary": "2-3 sentence executive summary"
}
Step 4: Build the Analysis Pipeline
Connect your data collection to Claude Code analysis:
// churn-analyzer.js
const Anthropic = require("@anthropic-ai/sdk");

const analyzeChurnRisk = async (accountId) => {
  const healthData = await healthSignals.collectForAccount(accountId);

  const client = new Anthropic();
  const response = await client.messages.create({
    model: "claude-sonnet-4-20250514",
    max_tokens: 2000,
    messages: [
      {
        role: "user",
        content: CHURN_ANALYSIS_PROMPT.replace(
          "{customerHealthData}",
          JSON.stringify(healthData, null, 2)
        )
      }
    ]
  });

  const analysis = JSON.parse(response.content[0].text);

  // Store analysis for trending
  await db.saveChurnAnalysis(accountId, analysis);

  // Trigger alerts if needed
  if (analysis.riskScore > 50) {
    await alertCSM(accountId, analysis);
  }

  return analysis;
};
Step 5: Set Up Alert Workflows
When Claude identifies an at-risk account, trigger immediate action:
// alert-workflows.js
const alertCSM = async (accountId, analysis) => {
  const account = await crm.getAccount(accountId);
  const csm = await crm.getAccountOwner(accountId);

  // Slack alert to CSM
  await slack.send(csm.slackId, {
    text: `⚠️ Churn Risk Alert: ${account.name}`,
    blocks: [
      {
        type: "section",
        text: {
          type: "mrkdwn",
          text: `*${account.name}* risk score increased to *${analysis.riskScore}/100*`
        }
      },
      {
        type: "section",
        text: {
          type: "mrkdwn",
          text: `*Top Risk Factors:*\n${analysis.primaryRiskFactors
            .map(f => `• ${f.signal}: ${f.evidence}`)
            .join('\n')}`
        }
      },
      {
        type: "section",
        text: {
          type: "mrkdwn",
          text: `*Recommended Action:*\n${analysis.recommendedInterventions[0].action}`
        }
      }
    ]
  });

  // Create task in CRM
  await crm.createTask({
    accountId,
    ownerId: csm.id,
    subject: `Churn Risk: ${account.name} (Score: ${analysis.riskScore})`,
    description: analysis.healthSummary,
    dueDate: analysis.recommendedInterventions[0].urgency === 'immediate'
      ? 'today'
      : 'this_week',
    priority: analysis.riskScore > 75 ? 'high' : 'medium'
  });
};
Step 6: Automate Daily Monitoring��
Run churn analysis across your entire book of business:
// daily-churn-scan.js
const scanAllAccounts = async () => {
  const accounts = await crm.getActiveAccounts();
  const results = [];

  for (const account of accounts) {
    const analysis = await analyzeChurnRisk(account.id);
    results.push({ account: account.name, ...analysis });
  }

  // Generate executive summary
  const atRisk = results.filter(r => r.riskScore > 50);
  const critical = results.filter(r => r.riskScore > 75);

  await slack.send('#customer-success', {
    text: `📊 Daily Churn Report`,
    blocks: [
      {
        type: "section",
        text: {
          type: "mrkdwn",
          text: `*Daily Customer Health Summary*\n` +
            `• Total accounts analyzed: ${results.length}\n` +
            `• At-risk accounts: ${atRisk.length}\n` +
            `• Critical accounts: ${critical.length}`
        }
      },
      critical.length > 0 && {
        type: "section",
        text: {
          type: "mrkdwn",
          text: `*🚨 Critical Accounts:*\n${critical
            .map(c => `• ${c.account} (${c.riskScore}/100)`)
            .join('\n')}`
        }
      }
    ].filter(Boolean)
  });

  return results;
};
The ROI of AI Churn Prediction
Let's do the math:
Before AI churn prediction:
- 100 accounts, 8% annual churn = 8 lost customers
- Average ACV: $50,000
- Annual churn cost: $400,000
After AI churn prediction:
- Same 100 accounts
- Predict 80% of churn (historical accuracy)
- Save 50% of predicted churns through intervention
- New churn: 8 - (8 × 0.8 × 0.5) = 4.8 customers
- Churn cost: $240,000
- Annual savings: $160,000
And that's conservative. Top companies using AI churn prediction report 30-50% reductions in churn rate.
Advanced: Champion Monitoring with LinkedIn
The single best predictor of churn? Your champion leaving the company.
Here's how to automate champion monitoring:
// champion-monitor.js
const monitorChampions = async () => {
  const champions = await crm.getChampions(); // Contacts tagged as champions

  for (const champion of champions) {
    const linkedinProfile = await linkedin.getProfile(champion.linkedinUrl);
    const currentCompany = linkedinProfile.experience[0]?.company;

    if (currentCompany !== champion.account.name) {
      // Champion has left!
      await alertChampionChange({
        champion,
        previousCompany: champion.account.name,
        newCompany: currentCompany,
        analysis: await analyzeImpact(champion)
      });
    }
  }
};
When a champion leaves, Claude can analyze the impact:
- Was this the executive sponsor?
- Who else do we know at the account?
- What's the typical churn timeline after champion departure?
- What intervention has worked historically?
Connecting to MarketBetter
MarketBetter's daily SDR playbook applies the same predictive intelligence to pipeline—telling your team exactly who to contact and what to say.
For customer success teams, the playbook surfaces:
- At-risk accounts requiring immediate attention
- Expansion opportunities based on usage patterns
- Optimal timing for QBRs and check-ins
- Talking points based on recent product usage
The difference between reactive and proactive customer success is the difference between fighting churn and preventing it.
See how MarketBetter's AI-powered playbook works →
Try our Lookalike Company Finder — find companies similar to your best customers in seconds. No signup required.
Implementation Checklist
Ready to build your own churn prediction system?
- Map your churn signals (product, relationship, business)
- Set up data collection from CRM + product analytics
- Create Claude Code analysis prompts with your historical patterns
- Build alert workflows to CSM team
- Test on known churned accounts to calibrate
- Deploy daily automated scanning
- Add champion monitoring
- Track intervention success rates
The best time to prevent churn was 60 days before the customer decided to leave. The second best time is now—with AI-powered prediction that catches the warning signs you'd otherwise miss.
Building AI agents for GTM? Check out our guides on customer success automation with OpenClaw and training custom AI agents for your sales process.