Your Guide to Actionable Lead Generation KPIs
Lead generation KPIs (Key Performance Indicators) are the specific, measurable numbers that tell you if your marketing and sales efforts are actually working. They go way beyond simple counts. Instead of just tracking activity, they focus on the outcomes that directly grow your business—things like lead quality and how many of those leads turn into actual customers.
Why Lead Generation KPIs Are Your Growth Compass
Trying to run a marketing campaign without tracking KPIs is like driving cross-country without a map. Sure, you're moving, but you have no idea if you're getting any closer to your destination.
It’s easy to get caught up in vanity metrics like just collecting contacts, but the real goal is to generate qualified opportunities that drive revenue. Measuring the right things is what turns marketing from a cost center into a predictable growth engine.
This is more important than ever. The global lead generation industry is on track to hit $295 billion by 2027, growing at a blistering pace of 17% each year. That kind of growth means data-driven strategies are no longer optional—they're essential for staying in the game.
This infographic paints a clear picture of how KPIs form the critical bridge between your day-to-day marketing activities and the revenue you’re trying to generate.
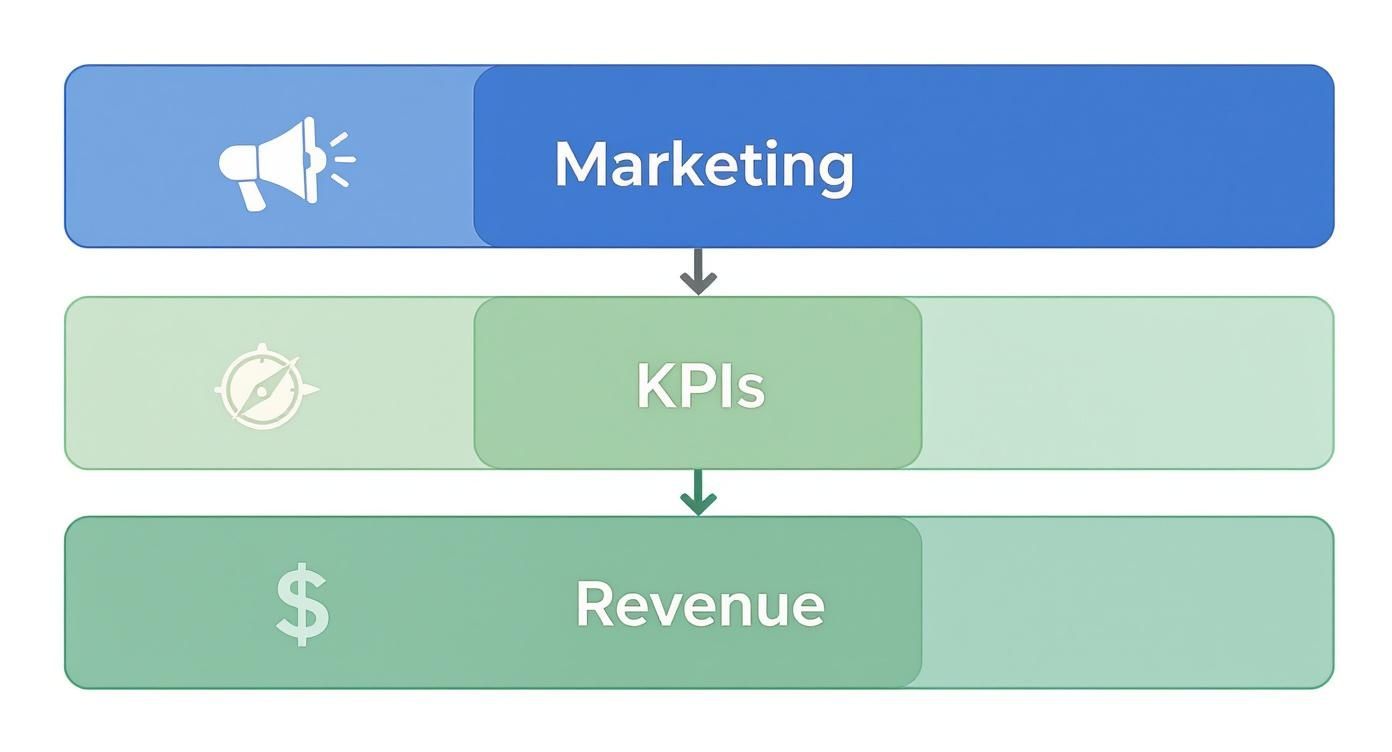
As you can see, great marketing isn't just about making noise. It’s about using the right KPIs to translate that effort into results you can take to the bank.
Moving Beyond Metrics to Meaningful Action
It’s crucial to understand the difference between a simple metric and a true KPI. For instance, website traffic is a metric. The traffic-to-lead conversion rate? That's a KPI. The first one tells you how many people showed up; the second tells you how effective your site is at getting them to raise their hand. Making this distinction is the cornerstone of any solid demand generation strategy.
Actionable Tip: A metric counts activity, but a KPI measures effectiveness. To make a metric actionable, compare it to a business goal. Don't just report "10,000 website visits." Instead, analyze "Our website converted 2% of its 10,000 visitors into leads, hitting our 2% goal."
To really use KPIs as a compass for growth, you need to connect them to proven lead generation best practices. This alignment makes sure your measurement framework is built on strategies that are already known to work.
When you focus on the right indicators, you can:
- Pinpoint Inefficiencies: Immediately see which channels or campaigns are wasting your time and money.
- Optimize Spending: Confidently shift your budget to the activities that deliver the highest impact.
- Improve Sales Alignment: Hand over higher-quality, conversion-ready leads that your sales team will actually love.
Measuring Awareness with Top-of-Funnel KPIs
Your lead generation engine starts at the top of the funnel (ToFu). This is where you cast your net, trying to attract a broad but still relevant audience. Think of these top-of-funnel KPIs as your sonar—they tell you if you're fishing in the right spots and if your bait is actually interesting.
Getting this stage wrong causes huge problems later. If you attract the wrong crowd here, you'll be dealing with unqualified leads all the way down the pipeline. Let's dig into the core metrics that show you how well your initial outreach is working.
Click-Through Rate (CTR)
Click-Through Rate is the first real test of your messaging. It tells you what percentage of people who saw your ad, social post, or email subject line actually bothered to click it. It’s a direct gut-check on how compelling your creative and copy are.
Formula: (Total Clicks / Total Impressions) x 100 = CTR (%)
A high CTR means your message is hitting the mark. A low one means you've got a disconnect. For example, a CTR of 2% is often considered good for search ads, while a 0.5% CTR on a social media ad might signal poor targeting or uninspired creative.
Actionable Tip: If your CTR is low, don't just scrap the campaign. Test different headlines or images. A simple A/B test comparing "Save 20% Today" vs. "Stop Wasting Time on Admin Tasks" can quickly reveal which message resonates with your audience and double your CTR.
Cost Per Lead (CPL)
This one is simple but powerful: Cost Per Lead is the final price tag for acquiring one new contact. It’s the metric that keeps your budget honest, tying your marketing spend directly to a tangible result.
Formula: Total Campaign Cost / Total New Leads = CPL
Actionable Tip: Don't just track your overall CPL. Segment it by channel to find your most efficient sources. If LinkedIn ads generate leads at a CPL of $75 but your organic blog generates them for $20, you have a clear directive: invest more in content creation and SEO to scale your most profitable channel.
The real magic happens when you compare CPL across channels. Let's say your LinkedIn ads bring in leads for $75 a pop, but your organic blog content generates them for just $20. That tells you exactly where to double down. Mastering your CPL is the foundation of a healthy inbound marketing lead generation strategy.
Traffic-to-Lead Ratio
While CTR shows initial interest, the Traffic-to-Lead Ratio tells you what happens after the click. Of all the people who landed on your page, how many actually filled out the form and became a lead? This metric puts your landing page experience under the microscope.
Formula: (Total New Leads / Total Website Visitors) x 100 = Traffic-to-Lead Ratio (%)
Here's where looking at these KPIs together paints the full picture.
- Scenario A (High CTR, Low Conversion): You have a killer CTR (5%) but a terrible Traffic-to-Lead Ratio (1%). Your ad is fantastic at getting people to click, but your landing page is dropping the ball. The problem isn't the ad; it's what happens next. Action: A/B test your landing page headline, form length, or call-to-action button.
- Scenario B (Low CTR, High Conversion): Your CTR is dismal (0.5%), but your Traffic-to-Lead Ratio is amazing (10%). Your ad is clearly missing the mark. But the few people who do click are so motivated they convert instantly. Your landing page is great, but your ad targeting or copy is broken. Action: Refine your ad audience or rewrite your ad copy to better match your high-converting landing page.
By analyzing these metrics together, you stop guessing and start diagnosing. You can see exactly where the leaks are in your funnel and plug them, making sure a steady stream of good prospects keeps flowing in.
Gauging Interest with Middle-of-Funnel KPIs
So you’ve grabbed a lead's attention. Great. Now the real work begins. The middle of the funnel (MoFu) is where that initial curiosity has to become real intent. The KPIs at this stage are your heat map, showing you exactly who’s warming up and who’s going cold.
This is the make-or-break handoff between marketing and sales. Nail it, and your sales team gets a steady stream of promising conversations. Get it wrong, and they’ll burn hours chasing dead ends, leading to wasted money and a seriously frustrated team.

Differentiating MQLs from SQLs
First things first: you need to draw a clear line between a Marketing Qualified Lead (MQL) and a Sales Qualified Lead (SQL). This isn't just fluffy jargon—it's the fundamental agreement that gets your marketing and sales teams rowing in the same direction.
-
MQL (Marketing Qualified Lead): This is someone who's definitely interested but not quite ready to talk to a salesperson. They’ve downloaded your ebook, joined a webinar, or maybe they keep coming back to your pricing page. They fit your ideal customer profile and are engaging with your content.
-
SQL (Sales Qualified Lead): This lead is the real deal. They've been vetted, either by automation or a sales development rep, and they check the important boxes: a clear need, a budget, and the authority to pull the trigger. They've taken a high-intent action, like requesting a demo or a quote.
Think of it like fishing. An MQL is a fish that’s nibbling at your bait. An SQL is the one you've hooked and are ready to reel in. The whole point of MoFu KPIs is to figure out which nibblers are about to bite down hard.
The Power of Lead Scoring
How do you tell the difference between a window shopper and a serious buyer automatically? The answer is Lead Scoring. It's a system that assigns points to leads based on who they are (demographics, company size) and what they do (website visits, email opens, content downloads).
A VP of Marketing at a 500-person tech firm? They’ll get more points than an intern from a tiny agency. Someone who requests a demo gets a massive score bump compared to someone who just reads a blog post.
This isn’t just a nice-to-have; it's a powerful lever for growth. Companies that implement Lead Score Tracking can see conversion rates jump by up to 28%. It’s a data-driven way to automatically surface your hottest prospects, so your sales team always knows who to call first.
Actionable Lead Scoring Model Comparison
You don't need a data science degree to build a lead scoring model. It’s really about comparing different signals of intent and assigning a logical value to each one.
| Action Taken by Lead | Point Value | Rationale |
|---|---|---|
| Visited Pricing Page | +15 | Shows strong buying intent and consideration. |
| Attended a Webinar | +10 | Demonstrates a commitment of time and interest in a solution. |
| Downloaded Ebook | +5 | Indicates interest in a topic but is lower-intent. |
| Opened an Email | +1 | A basic engagement signal, shows the lead is still active. |
Actionable Tip: Set a threshold—let's say 50 points. Once a lead hits that number, automate two actions: flag them as an MQL in your CRM and immediately send a notification to the assigned sales rep. This simple automation bridges the gap between marketing interest and timely sales follow-up, ensuring hot leads never go cold.
Connecting Marketing to Revenue with Bottom-of-Funnel KPIs
This is where the rubber meets the road. If top-of-funnel metrics are about starting conversations, bottom-of-funnel (BoFu) KPIs are about cashing the checks.
These are the numbers your CFO and CEO actually care about. Why? Because they draw a straight line from your marketing campaigns to the company's bank account, proving your work isn't just a cost center—it's a revenue engine. We're moving past clicks and downloads to focus purely on efficiency and profit.
Getting this right lets you confidently answer the most important question: "Which of our marketing activities are making us the most money?"

Customer Acquisition Cost (CAC)
While Cost Per Lead (CPL) tells you what you paid for a handshake, Customer Acquisition Cost (CAC) tells you the total cost of winning a paying customer. It's the real deal.
CAC rolls up all your sales and marketing expenses—salaries, ad spend, software licenses, the whole shebang—and divides it by the number of new customers you closed in a set period.
Formula: Total Sales & Marketing Costs / Number of New Customers = CAC
Think of CAC as the ultimate stress test for your go-to-market strategy. A high CAC can bleed your company dry, even if you’re closing deals left and right. The goal isn't just to lower it, but to lower it without sacrificing the quality of the customers you bring in.
Comparing CAC Across Different Channels
To make CAC truly useful, you have to slice it up by channel. An overall CAC is a good health metric, but channel-specific CAC is where the strategic magic happens.
Imagine your paid search campaigns have a CAC of $1,500, but the customers coming from your organic blog content cost only $400 to acquire. That data isn't just a report card; it's a roadmap. It tells you exactly where to pour your next dollar for the biggest impact.
Actionable Tip: Create a simple table comparing the CAC of each marketing channel against the average deal size from that channel. If Channel A has a $500 CAC but brings in $5,000 deals, while Channel B has a $250 CAC but only brings in $1,000 deals, you can make a strategic decision to invest more in Channel A for higher ROI, despite its higher initial cost.
SQL-to-Customer Conversion Rate
This KPI is all about the handoff between marketing and sales. It measures how many of the leads your sales team accepted as qualified (SQLs) actually signed on the dotted line and became customers.
Formula: (New Customers / Total SQLs) x 100 = SQL-to-Customer Rate (%)
A low number here screams that there's a disconnect. Either marketing is sending over-hyped leads that aren't truly ready to buy, or the sales process has a leak that needs plugging. A common benchmark for B2B is around 20-30%. If yours is at 5%, it’s time for a joint meeting between marketing and sales to review lead qualification criteria.
Customer Lifetime Value (CLV)
Finally, we have Customer Lifetime Value (CLV). This isn't about the first sale; it's about the entire relationship. CLV predicts the total amount of revenue you can expect from a single customer over the entire time they do business with you. It’s the long game.
Formula: (Average Purchase Value x Average Purchase Frequency) x Average Customer Lifespan = CLV
Comparing your CLV to your CAC is the moment of truth for your business model. A healthy, scalable business needs its CLV to be much higher than its CAC. The classic benchmark is a 3:1 ratio.
Actionable Tip: If your CLV:CAC ratio is a dangerous 1:1, you have two levers to pull. You can work to decrease CAC by optimizing your marketing channels, or you can work to increase CLV by launching customer retention programs, upsell campaigns, or loyalty initiatives. Analyzing this ratio tells you whether to focus on acquisition efficiency or customer satisfaction.
Tying all these numbers together requires a solid grasp of where the revenue is actually coming from. To get a clearer picture, it’s worth exploring different multi-touch attribution models to see which touchpoints are doing the heavy lifting. This kind of analysis is what allows you to invest with confidence, knowing every decision is backed by hard financial data.
Building Your Lead Generation KPI Dashboard
Knowing your lead generation KPIs is one thing. Actually tracking them is how you win. A good dashboard turns a mountain of raw data into a handful of smart decisions, giving you a live look at the health of your marketing engine. It gets you out of the spreadsheet weeds and helps you see the story the numbers are telling.
The right tool really just depends on your scale. If you're a startup, a well-organized spreadsheet can be a surprisingly powerful (and free) command center. But once you're scaling, automated platforms like HubSpot or Marketo become non-negotiable for taming the complexity and seeing the entire funnel in one place.
Choosing Your Dashboard Tools
When you're comparing tools, the big differentiators are automation and integration. A simple spreadsheet means someone has to manually punch in the numbers. That's fine for a weekly review, but it’s not going to cut it for daily monitoring.
A dedicated marketing platform, on the other hand, does the heavy lifting for you. It pulls data automatically from all your sources—your website, your CRM, your ad accounts—and gives you a single source of truth.
- Spreadsheets (Google Sheets, Excel): You get total flexibility at zero cost. Best for: Early-stage companies focusing on a few core metrics like CPL and conversion rate. Actionable Use: Create a weekly scorecard where you manually input leads, cost, and customers by channel.
- Marketing Platforms (HubSpot, Marketo): These give you automated, real-time dashboards that connect the dots from first touch to final sale. Best for: Scaling businesses that need to track the full customer journey and complex attribution. Actionable Use: Build a "Funnel Health" dashboard showing MQLs generated this month, SQL-to-Customer rate, and channel-specific CAC.
The screenshot below from a HubSpot dashboard is a perfect example of this. It turns performance data into something you can actually understand at a glance.
This visual approach makes it dead simple to spot trends, like which channels are bringing in the best leads, without having to become a spreadsheet wizard.
Making KPI Reviews Actionable
A dashboard is just a pretty picture if you don't act on what it's showing you. You need a rhythm for reviewing it. I recommend weekly check-ins for small tactical tweaks and monthly meetings for bigger strategic shifts.
During these reviews, don't just read the numbers off the screen. Ask why. Why did CPL suddenly spike? Was it that new ad campaign we launched? Did that blog post go viral and flood the top of our funnel?
This focus on turning insights into action has never been more critical. In 2025, lead generation is still the top priority for 34% of companies. Yet a mind-boggling 80% of those leads never become sales. That’s a huge disconnect. As you can find in these lead generation statistics on DesignRush.com, it highlights a massive need to focus on lead quality, not just quantity—a shift you can only make with consistent KPI analysis.
Your dashboard's job is to flag problems and opportunities. Treat it like a diagnostic tool for your growth engine. It helps you find the bottlenecks, celebrate the wins, and constantly refine your game plan.
Common KPI Mistakes and How to Avoid Them
Tracking your lead generation KPIs is non-negotiable, but let’s be honest—tracking the wrong things is even worse than tracking nothing at all. It’s like sending your team on a wild goose chase for ghosts while real, paying customers walk right out the door.
The biggest trap? Vanity metrics. We all know them. Social media likes, page views, email open rates. They feel good, they look great in a report, but they don't pay the bills. A blog post with 10,000 likes that brings in zero leads is a distraction. The targeted article with only 100 views that lands two high-quality MQLs? That's the real winner.
Mistake 1: Ignoring Context and Segmentation
Another classic pitfall is staring at numbers in a vacuum. Let’s say your overall Cost Per Lead (CPL) is a tidy $50. Sounds great, right? But what happens when you start slicing up that data?
You might find your LinkedIn ads are actually costing you $200 per lead, while your organic search CPL is a lean $15. Without digging into the segments, you'd keep pouring money down the drain, completely clueless that one channel is bleeding you dry while another is a goldmine.
Your top-level numbers tell you what happened. Segmented data tells you why. Always slice your KPIs by channel, campaign, and audience to get the real story behind the numbers.
This tunnel vision often leads to another problem: celebrating top-of-funnel wins without looking at the whole picture. A huge spike in new leads is great, but if none of them ever become Sales-Qualified Leads (SQLs), you've just created a lot of noise. You have to connect the dots from the first click all the way to the final sale.
Actionable Solutions to Common Pitfalls
Building a smart measurement system isn't complicated—it just requires discipline. Here’s how you can steer clear of these common traps:
- Tie Everything to Revenue: For every single KPI you track, ask yourself: "How does this number get us closer to a sale?" If you can't draw a straight line, it’s probably a vanity metric. Action: Replace a "Page Views" goal with a "Traffic-to-Lead Ratio" goal.
- Compare Apples to Apples: Don't just look at your overall CPL. Track the CPL for your Google Ads campaign versus your content marketing efforts. Compare the SQL-to-Customer rate from webinar leads against ebook downloads. Action: Create a monthly "Channel Performance" report that ranks your channels by CPL and CAC to force a data-driven budget conversation.
- Build a Full-Funnel View: Your dashboard should tell a story. Put your Traffic-to-Lead Ratio right next to your MQL-to-SQL Rate and your Customer Acquisition Cost (CAC). Action: Structure your marketing meetings around the funnel stages (ToFu, MoFu, BoFu) to ensure no single stage is analyzed in isolation.
A Few Final Questions About Lead Generation KPIs
You've got the list, the formulas, and the strategy. But a few common questions always pop up when teams start getting serious about measurement. Let's tackle them head-on.
What’s the Real Difference Between a Metric and a KPI?
Think of it like driving. A metric is your speedometer—it tells you how fast you're going right now. It's just a number, a piece of data. Your website traffic is a metric. It just tells you how many people showed up.
A KPI, on the other hand, is your GPS. It tells you if you're actually getting closer to your destination. Your traffic-to-lead ratio is a KPI because it measures how good your website is at turning those visitors into actual leads, directly tying your speed (traffic) to your goal (more business).
The difference is all about focus. Chasing metrics like social media likes can keep you busy but not productive. Focusing on KPIs like SQL-to-customer conversion rate ensures every move you make is aimed squarely at driving revenue.
How Often Should I Actually Look at These Numbers?
This isn't a one-size-fits-all answer. Your review schedule should match the speed of the channel you're managing. A clear comparison helps:
- Fast-Paced Channels (e.g., Paid Ads): Review these weekly. Bids, creative, and CPC can fluctuate rapidly. A weekly check-in lets you shift budget from an underperforming ad set to a winning one before you waste money.
- Long-Term Channels (e.g., SEO, Content): Review these monthly. It takes time for content to rank and for organic trends to become clear. A monthly review helps you spot overarching trends, like which content clusters are driving the most organic leads, without overreacting to daily traffic dips.
Actionable Tip: Schedule two recurring meetings: a 30-minute "Weekly Tactical Huddle" to review ad performance and a 60-minute "Monthly Strategic Review" to analyze full-funnel trends and make bigger decisions on budget and channel focus.
We’re a B2B SaaS Company. Which KPIs Matter Most?
For B2B SaaS, the game is all about long-term value, not just a quick win. While top-of-funnel KPIs are important, the ones that truly define success are at the bottom of the funnel. Here's a comparison of what to prioritize:
- Good to Track: Cost Per Lead (CPL) and number of MQLs. These are early health indicators.
- Critical to Track: Customer Acquisition Cost (CAC), Customer Lifetime Value (CLV), and the CAC to CLV Ratio. These are the bottom-line truths of your business model.
A healthy, sustainable SaaS business should be aiming for a CLV that's at least 3x its CAC. Anything less, and you're likely spending too much to acquire customers who don't stick around long enough to pay you back. If your ratio is 1:1, you have a financial emergency. If it's 5:1, you are likely underinvesting in growth and should spend more aggressively.
Ready to turn your data into decisions? marketbetter.ai uses AI to optimize your campaigns and prove your marketing impact. Stop guessing and start growing by exploring our AI-powered marketing platform.