12 Lead Generation KPIs That Actually Predict Revenue (Not Vanity Metrics) [2026]
Let's be honest. For a long time, the name of the game in marketing was just "more leads." We'd chase a big number, slap it on a slide, and call it a win.
But here’s the problem with that approach: more leads doesn't always mean more business. In fact, it often means more noise, more wasted time for your sales team, and a flatlining revenue chart that makes everyone scratch their head.
This is where we need to get smarter. We have to move past simply counting leads and start measuring what actually matters. That's what Lead Generation Key Performance Indicators (KPIs) are all about. They are the measurable values that tell you how effective you really are at generating new business.
Tracking these metrics is the difference between guessing and knowing. It’s how you make data-driven decisions that build a predictable growth engine for your company.
Why Tracking Leads Alone Is a Trap
Imagine a marketing team proudly announcing they doubled their lead count in a single quarter. High fives all around, right? But then the finance team runs the numbers and discovers revenue hasn’t budged an inch.
Sound familiar? This is the classic pitfall of focusing on quantity over quality.
An avalanche of leads is worthless if they're a bad fit, aren't ready to buy, or cost more to acquire than you'll ever see back in profit. Relying on that single, vanity metric—the raw number of leads—is dangerously misleading. It can make you feel successful while your business is actually standing still.
Moving Beyond the Vanity Metric
To avoid this trap, you need a more sophisticated toolkit. Think of your lead gen KPIs as the dashboard of your car. Just looking at the odometer (your lead count) tells you you're moving, but it's the other gauges that give you the critical context you need to actually get somewhere.
- Your Speedometer: How fast are you bringing in qualified leads?
- Your Fuel Gauge: Is your cost to acquire a customer sustainable, or are you about to run out of gas?
- Your Engine Temp: Is your sales process efficient, or is it overheating with bad-fit prospects?
Without these other data points, you’re basically driving blind. You're burning fuel and hoping you end up at the right destination.
Relying solely on lead volume is like judging a restaurant's success by the number of people who walk through the door, not by how many actually sit down and order a meal. True performance is measured by conversion and profitability, not just foot traffic.
This guide will give you a practical framework to identify, track, and optimize the KPIs that truly matter. We're going to turn your lead generation from a guessing game into a predictable revenue driver. By the end, you'll know exactly how to connect your marketing efforts to bottom-line results, ensuring every dollar you spend is a smart investment in real, sustainable growth.
Understanding Your Foundational KPIs
If you want to get good at lead generation, you have to start with the basics: your foundational, top-of-funnel metrics. These are the core numbers that give you a quick pulse check on your marketing health. Think of them less as a final report card and more as the first few clues in solving your growth puzzle.
It's easy to get lost tracking dozens of different numbers, creating complex reports that hide more than they reveal. The real key is to focus on the vital few that tell the clearest story about how well you're grabbing your audience's initial attention.
This infographic breaks down the hierarchy of the most essential KPIs every marketer should be watching.
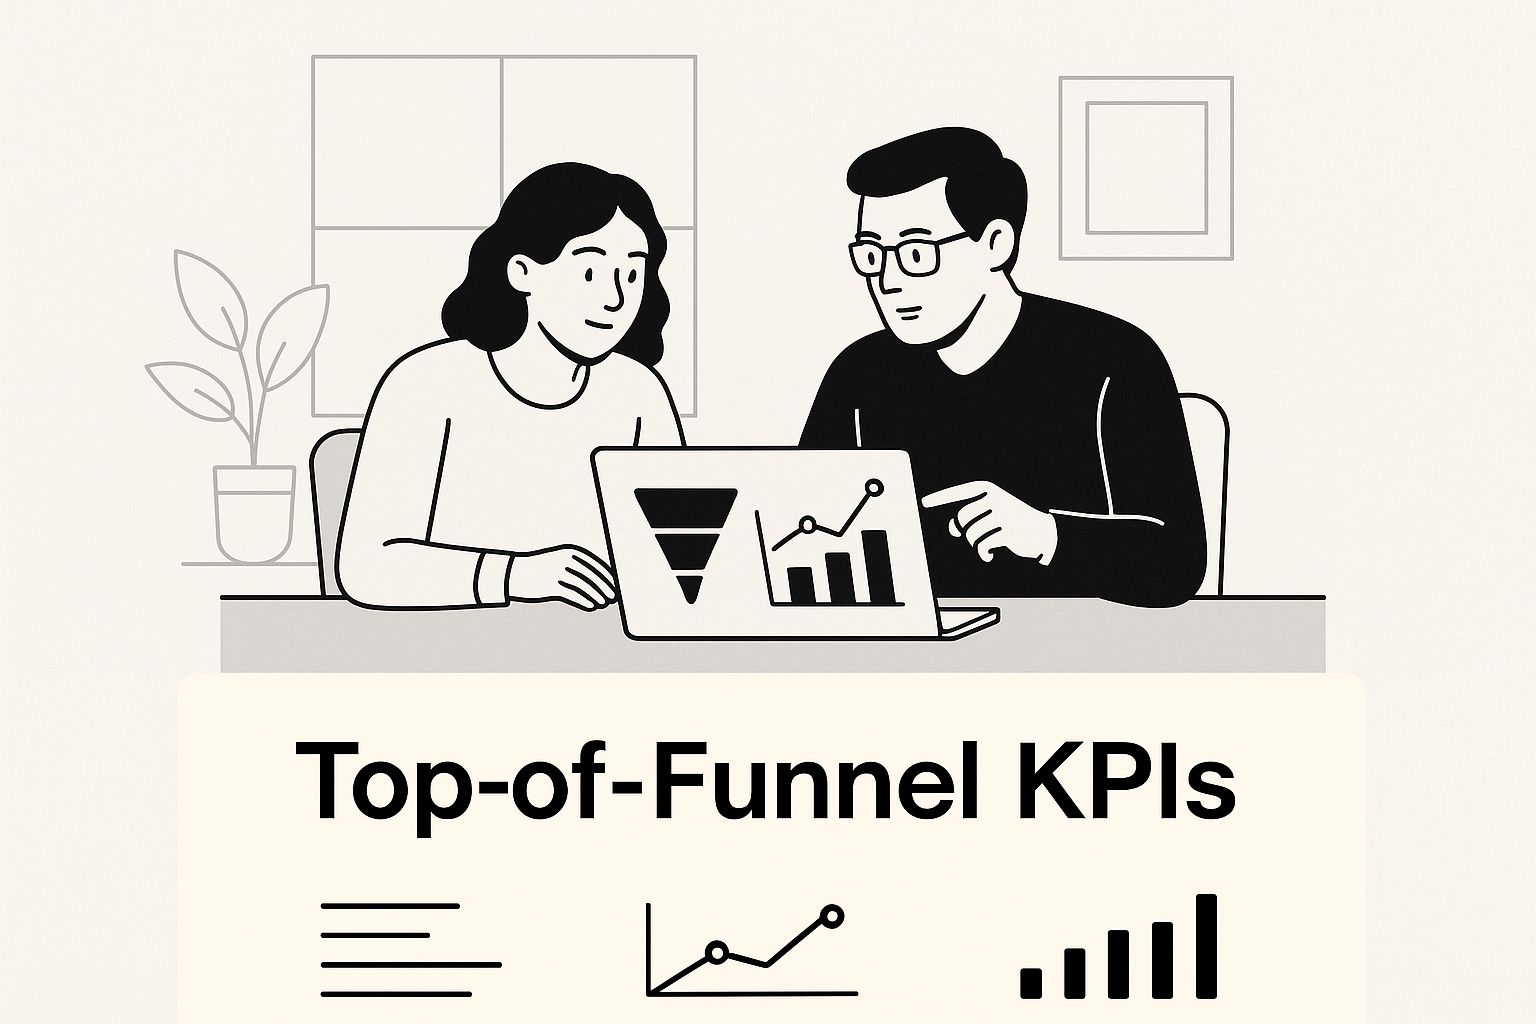
You can see how each metric builds on the last, moving from broad awareness to specific, measurable actions. Let's dig into what each one really tells you.
Number of Leads
This is the most basic KPI you can track: the raw Number of Leads. It’s your starting line.
Imagine you own a retail store. This number is simply counting every single person who walks through the front door. It's a non-negotiable metric because, without any foot traffic, you have zero chance of making a sale. But on its own, it’s just a raw count that tells you nothing about why they came in or if they actually want to buy something.
Actionable Insight: If your lead volume is too low, your immediate action is to broaden your reach. This could mean increasing your ad spend, expanding your keyword targeting, or testing new content formats to attract a larger audience. A sudden spike in leads might look great, but it could just mean you're attracting a crowd of window shoppers with no real intent.
Click-Through Rate (CTR)
Next up is your Click-Through Rate (CTR). If the number of leads is your total foot traffic, then CTR measures the effectiveness of your window display.
It tells you what percentage of people who saw your ad, email, or social media post were intrigued enough to actually click on it. The formula is simple:
(Total Clicks / Total Impressions) x 100 = CTR
Actionable Insight: A low CTR is a clear signal to rework your creative and messaging. Action Step: A/B test your headlines, images, and calls-to-action. For example, compare a benefit-driven headline ("Save 10 Hours a Week") against a curiosity-driven one ("The Secret to Effortless Project Management"). This direct comparison will show you what resonates with your audience. A high CTR, on the other hand, means your "window display" is successfully pulling people inside.
Conversion Rate
Once they're inside your "store," the Conversion Rate tells you what percentage of those visitors took the specific action you wanted them to. This doesn't have to be a final sale. For top-of-funnel marketing, a conversion is often something like:
- Filling out a contact form
- Downloading an ebook
- Subscribing to your newsletter
The calculation is just as straightforward:
(Number of Conversions / Total Visitors) x 100 = Conversion Rate
Actionable Insight: A low conversion rate points to friction on your landing page. Action Step: Analyze your page for issues. Is your form too long? Is the call-to-action button hard to find? Compare a page with a 5-field form against one with a 3-field form. The shorter form will almost always convert better, showing you precisely how much friction your audience will tolerate. A high conversion rate means your page is doing its job.
By looking at these three KPIs together, you get the full story. High CTR but a low conversion rate? Your ad is great, but your landing page needs work. Low CTR but a high conversion rate? Your offer is a winner, but not enough of the right people are seeing it.
These foundational metrics work together to paint a clear picture of your campaign's performance from the very start. Nail these, and you're on your way to building a predictable and profitable marketing engine. For a deeper look at tracking and analyzing your core data, check out these crucial sales performance metrics.
Measuring the Cost and Efficiency of Your Leads
While it's great to know how many leads you're generating, those numbers don't tell the full story. To really understand your marketing's impact, you have to connect your efforts back to the budget. This is where cost-efficiency metrics come in, revealing the actual price tag on your lead gen machine.
These aren't just nice-to-have numbers; they're non-negotiable for proving marketing's value. They change the conversation from "how many leads did we get?" to "how much did we pay for them, and was it worth it?" This financial clarity is what lets you make smart budget decisions and justify every dollar spent.
Cost Per Lead (CPL): The Price of a Prospect
Cost Per Lead (CPL) is one of the most fundamental financial KPIs you can track. It tells you exactly what you paid, on average, to get a single person to raise their hand and show interest. Think of it as the cover charge for getting a potential customer into your club.
The math is simple:
Total Marketing Spend / Total New Leads = CPL
So, if you drop $5,000 on a Google Ads campaign and it brings in 100 new leads, your CPL is a clean $50. That number immediately gives you a baseline for that campaign's performance.
Actionable Insight: Tracking CPL by channel is critical. If your CPL from SEO is $25 but your CPL from paid ads is $75, you have a clear action item: analyze why your paid campaigns are so expensive. Are you targeting the wrong keywords? Is your ad quality score low? This comparison forces you to optimize your spend or shift budget to the more efficient channel. You can learn more about these important lead generation metrics from Abstrakt Marketing Group.
Before diving deep into channel-specific CPL, it helps to see a high-level comparison of what you might expect from different marketing avenues. Each channel has its own economic realities, with unique pros and cons that affect what you'll ultimately pay for a lead.
Comparing CPL Across Different Marketing Channels
| Marketing Channel | Average CPL (B2B) | Pros | Cons |
|---|---|---|---|
| SEO/Content Marketing | $20 - $75 | High-quality, long-term asset, builds authority | Takes time to see results, requires consistent effort |
| Email Marketing | $40 - $60 | Nurtures existing database, cost-effective at scale | List fatigue is real, requires strong content |
| Social Media Ads | $50 - $100 | Precise targeting, great for brand awareness | Can attract lower-intent leads, platform-dependent |
| PPC (e.g., Google Ads) | $50 - $150+ | Captures active intent, highly measurable, fast results | Can be very expensive, requires constant optimization |
| Webinars/Events | $60 - $120 | Highly engaged leads, positions you as an expert | High effort to produce, attendance can be unpredictable |
| LinkedIn Ads | $75 - $200+ | Excellent for B2B targeting, professional context | Often the most expensive channel, ad fatigue is high |
This table makes it clear that there's no single "best" channel. The right choice depends entirely on your budget, your audience, and whether you're playing the long game or need results right now.
Cost Per Acquisition (CPA): The Cost of a Customer
CPL measures the cost of a potential customer, but Cost Per Acquisition (CPA) goes one crucial step further. It measures the average cost to land an actual paying customer. This is the bottom-line metric because it ties your marketing spend directly to closed deals and revenue.
The formula is just as straightforward, but it focuses on the finish line:
Total Marketing Spend / Total New Customers = CPA
If that same $5,000 campaign ultimately produced 10 paying customers, your CPA would be $500. This is the number that answers the most important question of all: how much does it really cost us to win?
CPL vs. CPA: An Actionable Comparison
Knowing the difference between CPL and CPA is what separates tactical marketers from strategic ones. A cheap CPL is a vanity metric if those leads never, ever convert. The real magic happens when you look at both numbers side-by-side to judge your channels.
Let's walk through a real-world scenario:
- Channel A (Google Ads): You spend $2,000 and get 100 leads ($20 CPL). Of those, 2 become customers ($1,000 CPA).
- Channel B (LinkedIn Ads): You spend $2,000 and get 40 leads ($50 CPL). Of those, 5 become customers ($400 CPA).
At first glance, Google Ads looks like the clear winner with a $20 CPL—it's less than half of what LinkedIn costs! But the CPA tells the real story. The leads from LinkedIn, while more expensive up front, were far higher quality and converted at a much better clip. The result? A dramatically lower CPA.
This comparison reveals a powerful truth: Obsessing over a low CPL can trick you into pouring money into channels that generate cheap, junk leads, which ultimately costs you more to land a real customer.
To make this data actionable, your team would shift more budget toward Channel B. By focusing on the channel with the better CPA, you’re putting your resources where they generate the most profitable growth. This is the kind of data-driven decision that turns a marketing team from a cost center into a predictable revenue engine.
How to Measure Lead Quality and Sales Readiness

So far, we’ve been talking about getting attention and figuring out what it costs. But a cheap lead that goes nowhere is just a waste of time and money. A low Cost Per Lead (CPL) is a vanity metric if those leads have zero shot at becoming customers.
This is where we pivot from a numbers game to a quality game. We’re moving into the lead generation key performance indicators that build the bridge between your marketing efforts and your sales team’s success. It’s time to stop asking "how many?" and start asking "how good?"
Let’s be honest: not all leads are created equal. Some are just kicking the tires, while others are pulling out their wallets. Telling the difference between the two is the secret sauce to an efficient sales process and a pipeline that actually delivers.
MQL vs. SQL: What Is the Difference?
To figure out lead quality, you first have to agree on what a "good" lead actually looks like. This brings us to two of the most critical acronyms in the business: Marketing Qualified Lead (MQL) and Sales Qualified Lead (SQL). Getting this right is everything.
A simple comparison helps clarify the distinction:
- An MQL is someone who downloaded a top-of-funnel ebook. They are problem-aware.
- An SQL is someone who requested a personalized demo. They are solution-aware and showing purchase intent.
The MQL is curious; the SQL is serious. Your marketing team's job is to nurture the curious MQLs, while your sales team's job is to close the serious SQLs.
The core difference isn't just their level of interest; it's their readiness for a sales conversation. MQLs are nurtured by marketing, while SQLs are actively pursued by sales.
Nailing this definition demands a tight alignment between marketing and sales. Both teams have to agree on the exact criteria that graduate a lead from MQL to SQL. This shared rulebook stops marketing from just "throwing leads over the wall" that sales will inevitably ignore.
MQL-to-SQL Conversion Rate
Once your definitions are locked in, you can track the single most important handoff metric between your teams: the MQL-to-SQL Conversion Rate. This KPI tells you how well your marketing is setting up real, valuable opportunities for sales.
The math is simple:
(Total SQLs / Total MQLs) x 100 = MQL-to-SQL Conversion Rate
Actionable Insight: A low MQL-to-SQL rate is a red flag signaling a disconnect. Action Step: Hold a joint marketing and sales meeting to review the last 20 leads that sales rejected. Was the lead's company too small? Were they in the wrong industry? This direct feedback loop is the fastest way to refine your MQL criteria and improve lead quality immediately.
For instance, if your marketing team generates 200 MQLs in a month and sales accepts 20 of them as SQLs, your conversion rate is 10%. Watching this number over time is how you find and fix the leaks in your funnel.
Implementing a Simple Lead Scoring System
So, how do you decide which MQLs are ready for prime time in a way that isn't just guesswork? The answer is lead scoring. It’s a system where you assign points to leads based on who they are and what they do, creating a score that signals their sales readiness.
Instead of relying on gut feelings, you build an objective, data-backed process. A higher score means a hotter lead, telling your sales team exactly where to focus their energy.
Here’s a basic framework you can put to work today.
1. Identify Key Behavioral Triggers
These are the actions a person takes that show they're interested.
- Requesting a demo: +25 points (This is a big one)
- Visiting the pricing page: +15 points
- Downloading a case study: +10 points
- Attending a webinar: +10 points
- Opening a marketing email: +2 points
2. Define Important Demographic or Firmographic Data
This is all about who they are and where they work.
- Job title (e.g., Director or VP): +15 points
- Company size (matches your Ideal Customer Profile): +10 points
- Industry (your target vertical): +10 points
By adding up these scores, you can set a clear threshold. For example, any lead who hits 50 points is automatically flagged as an SQL and routed to a salesperson. This ensures your team spends their precious time on the opportunities most likely to close.
If you want to go deeper, you can find a more advanced look at building these systems in our guide to AI lead scoring.
Connecting Your KPIs to Revenue and Growth
At the end of the day, marketing is here for one reason: to grow the business. While metrics like CTR and CPL are great for taking the temperature of a campaign, they don’t speak the language of the C-suite. To prove marketing’s real value, you have to draw a straight, undeniable line from your lead generation key performance indicators to actual revenue.
This is the jump from measuring activities to measuring impact. It's about showing how a click on a social media ad turned into a signed contract in your CRM. When you can do that, you stop being a cost center and become a predictable, powerful growth engine.
Customer Lifetime Value (CLV): The Ultimate Context
The single most powerful metric in this conversation is Customer Lifetime Value (CLV). In simple terms, CLV is the total revenue you can expect to earn from a single customer over the entire time they do business with you. It’s the long-term view that puts all your short-term spending into perspective.
Actionable Insight: Compare your Customer Acquisition Cost (CPA) to your CLV. A healthy business model typically aims for a CLV:CPA ratio of at least 3:1. If your ratio is 1:1, you're losing money with every new customer. Action Step: If your ratio is too low, you have two levers to pull: either find ways to decrease your CPA (by optimizing ad spend) or increase your CLV (by improving customer retention and upselling).
CLV is the KPI that gives you permission to spend more to acquire the right customers. It shifts the focus from finding the cheapest leads to finding the most profitable ones.
This one number reframes your entire strategy. Instead of hunting for the lowest CPL, you start hunting for the highest CLV—a fundamentally smarter, more profitable way to grow.
Lead-to-Close Ratio: Your Sales Efficiency Score
While CLV is your long-term lens, the Lead-to-Close Ratio (sometimes called Lead Conversion Rate) is your snapshot of how efficiently your sales process is working right now. It tells you exactly what percentage of the leads you generate actually become paying customers.
The math is simple:
(Total New Customers / Total Leads) x 100 = Lead-to-Close Ratio
If you generated 200 leads last month and 10 of them signed on the dotted line, your Lead-to-Close Ratio is 5%. This is a crucial health check on your sales effectiveness. A consistently low ratio is a red flag—it might mean you're chasing low-quality leads, or there’s a serious bottleneck somewhere in your sales funnel.
A Tale of Two Channels: A Case Study in Profitability
Let's put this all together with a real-world example. Imagine a B2B SaaS company running lead gen campaigns on two different channels.
- Channel A (Social Media Ads): This channel was a CPL machine, generating leads at a ridiculously low $40 CPL. The marketing team loved it. The problem? These leads had a dismal Lead-to-Close Ratio of just 1% and a CLV of $1,500.
- Channel B (Industry Webinars): The leads from here were way more expensive, costing $150 CPL. This looked inefficient at first glance. But these were high-intent, engaged leads with a Lead-to-Close Ratio of 8% and a massive CLV of $12,000.
If you only looked at CPL, Channel A would win every time. But when you connect the dots to revenue, the story completely flips.
To land one customer from Channel A, they needed 100 leads. That cost them $4,000 (100 leads x $40 CPL) for a $1,500 return. Ouch.
Meanwhile, Channel B only required about 13 leads to get one customer (100 / 8). The acquisition cost was just $1,950 (13 leads x $150 CPL) for a whopping $12,000 return.
By shifting their budget away from the "cheap" CPL channel and toward the high-CLV one, the company supercharged its profitability. This is why it's so important to look past surface-level metrics and understand how to measure marketing ROI to prove your team's true impact on the business.
Building Your Actionable KPI Dashboard
Tracking individual lead generation key performance indicators is a great start, but looking at them one by one is like trying to navigate a city by only looking at a single street sign. You get a piece of the picture, but you have no context. A real KPI dashboard pulls all that data together, transforming scattered metrics into a clear story that actually guides your strategy.
Think about your car's dashboard. You don't get separate, random alerts for low fuel, engine temperature, and tire pressure. You get one central display that gives you the full picture at a glance. That's what a good marketing dashboard does. It lets you make faster, smarter decisions instead of getting lost in a dozen different spreadsheets.
The goal is to create a single source of truth. It kills data silos and gets everyone, from marketing ops to the C-suite, working from the same playbook. It’s about clarity, not clutter.
Choosing the Right KPIs for Your Audience
This is where most teams go wrong. They build a single, monstrous dashboard that tries to show everything to everyone. The result? It's overwhelming, and nobody uses it. The secret is tailoring the view to the person looking at it, because different teams need to see wildly different things.
- For the Marketing Team (The Operational View): This is your tactical command center, updated daily or weekly. It needs the nitty-gritty details: Cost Per Lead (CPL) by channel, landing page conversion rates, and MQL volume. Action Step: If CPL on one channel spikes, the team's immediate action is to pause that ad set and investigate.
- For Leadership (The Strategic View): This is the big-picture view, reviewed monthly or quarterly. Forget the tactical weeds. This dashboard needs to focus on the metrics that tie directly to the bottom line: Customer Acquisition Cost (CPA), Customer Lifetime Value (CLV), and total marketing ROI. Action Step: If the CLV:CPA ratio dips below 3:1, leadership's action is to question the profitability of a channel and decide on budget reallocation for the next quarter.
By creating these distinct views, you give each person exactly what they need to make decisions. The data starts driving real conversations instead of just being numbers on a screen. And as your data game gets more sophisticated, you can layer in advanced tactics like those in our guide to person-level identification to make your dashboards even sharper.
An effective dashboard doesn't just report what happened. It gives you the context to understand why it happened and what to do next. It turns reactive data-checking into proactive strategy.
Checklist for Your First Dashboard
You don't need a data science degree to build your first dashboard. Start simple. Tools like Google Data Studio or even your CRM’s built-in reporting can get you surprisingly far.
Here’s a quick checklist to get you started:
- Define the Goal: What’s the single most important question this dashboard must answer? (e.g., "How efficiently are we acquiring new customers?")
- Identify the Audience: Who is this for? The marketing team? Sales? The CEO?
- Select 5-7 Core KPIs: Pick only the essential metrics that directly answer the main question for that audience. No vanity metrics allowed.
- Connect Your Data Sources: Hook up your analytics, CRM, and ad platforms.
- Visualize the Data: Use clear charts and graphs. A timeline for trends, a pie chart for channel mix—make it tell a story.
- Set a Review Cadence: Put it on the calendar. Schedule regular check-ins to actually discuss the data and decide on next steps.
Try our AI Lead Generator — find verified LinkedIn leads for any company instantly. No signup required.
A Few Common Questions About Lead Gen KPIs
Alright, we've covered the what and the why. But when the rubber meets the road, practical questions always pop up. How many of these things should you actually stare at? And how often? Let's get into the real-world answers.
How Many KPIs Should I Actually Track?
It’s incredibly tempting to measure everything. More data feels safer, right? But this almost always leads to "analysis paralysis," where you're drowning in numbers but have no idea what to do next.
Instead of tracking a dozen-plus metrics, zero in on a core set of 5-7 KPIs that truly connect to your main business goals.
A solid way to start is by picking one or two from each part of your funnel:
- Top-of-Funnel: Click-Through Rate (CTR) or Cost Per Lead (CPL)
- Mid-Funnel: MQL-to-SQL Conversion Rate
- Bottom-of-Funnel: Customer Acquisition Cost (CPA) and Lead-to-Close Ratio
- Big Picture: Customer Lifetime Value (CLV)
This gives you a complete, high-level view of what's happening without bogging your team down in noise.
Don't mistake motion for progress. A cluttered dashboard with 20 metrics is less useful than a focused one with five that actually drive action. The real goal is clarity, not complexity.
How Often Should I Review My KPIs?
The right cadence isn't one-size-fits-all. It completely depends on the metric itself and who's looking at it. Trying to review everything on the same schedule is a recipe for bad decisions.
A practical comparison for review frequency:
- Weekly Review (Marketing Team): Focus on fast-moving, tactical KPIs like CPL, CTR, and Conversion Rates. These are the levers you can pull immediately to optimize live campaigns.
- Monthly Review (Sales & Marketing Leadership): Focus on pipeline velocity KPIs like MQL-to-SQL Conversion Rate and Lead-to-Close Ratio. This cadence allows enough time for leads to move through the funnel and reveals trends.
- Quarterly Review (Executive Team): Focus on strategic, slow-moving KPIs like CPA and CLV. These metrics reflect the overall health and profitability of the business and inform major budget decisions for the next quarter.
Matching the review frequency to the metric’s purpose is key. It stops you from overreacting to daily blips in big-picture numbers while keeping you agile enough to fix the small things that are happening right now.
Ready to stop guessing and start growing? marketbetter.ai uses AI to help you optimize every stage of your funnel, from the first click to the final close. See how our platform can help you turn your KPIs into predictable revenue. Learn more about what marketbetter.ai can do for you.