How to Measure Marketing Effectiveness: The Attribution Framework CMOs Actually Use [2026]
Figuring out if your marketing is actually working means tying what you do every day to real business results, like revenue and new customers. It’s about getting past the fluffy, surface-level numbers to see which strategies are pulling their weight. This is how you optimize your budget and prove your team's value. It all comes down to setting clear goals, picking the right metrics, and using a smart framework to turn data into decisions.
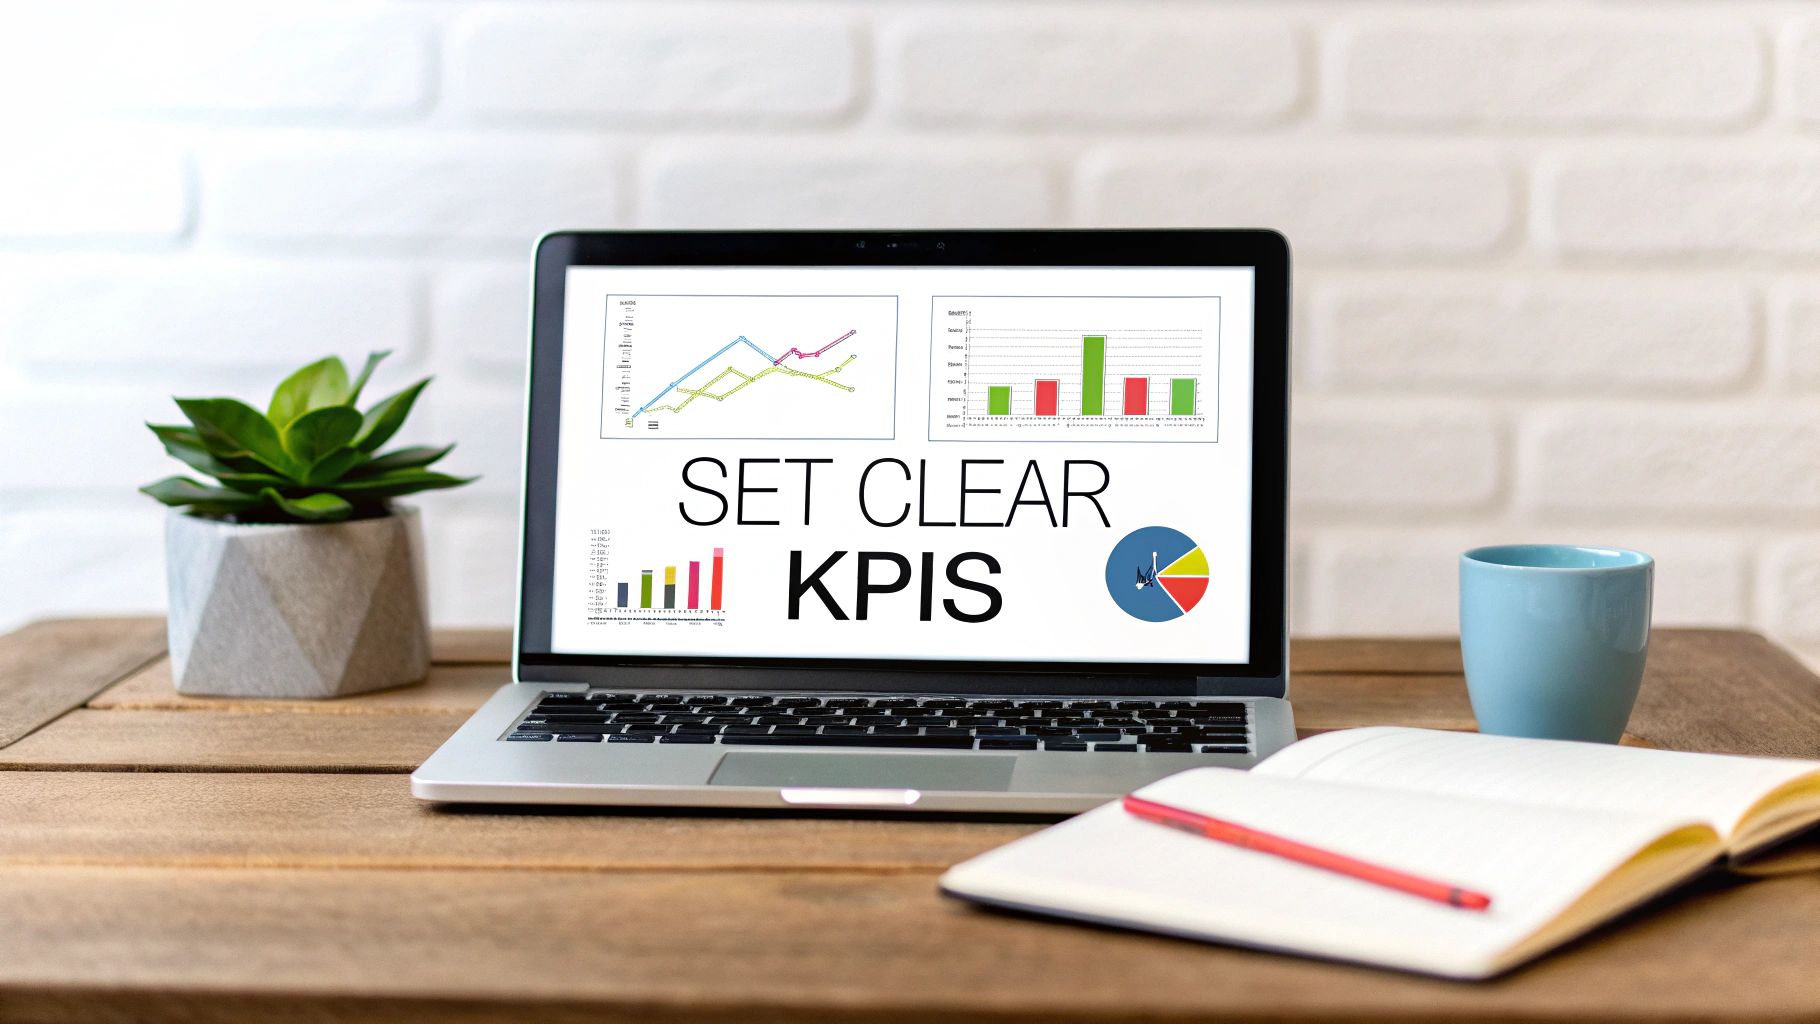
Building Your Marketing Measurement Framework

Before you can measure anything accurately, you need a game plan. Think of a measurement framework as your blueprint—it ensures every single thing you do is intentional and connected to the big-picture business goals. Without one, you’re just collecting random data points that don't tell a story. With one, you're building a system to make better decisions.
The first step? Stop chasing vanity metrics. A post with 10,000 likes that generates zero leads is a failure compared to a targeted article that only brings in 50 qualified leads who actually convert. The actionable insight here is to shift your focus from metrics that feel good (likes) to metrics that drive growth (qualified leads). That’s the difference between activity and impact.
Get Aligned With Stakeholders on What "Success" Means
Your framework is useless if nobody agrees on the definition of success. The metrics that get you excited might not be the same ones your CEO or head of sales cares about. They’re thinking in terms of revenue, customer growth, and market share. Your job is to translate your marketing performance into their language.
Here's an actionable plan to get aligned: schedule a 30-minute meeting with key stakeholders and ask direct questions.
- For your CEO: "What is the single most critical business goal for us this quarter? Is it pure customer acquisition, breaking into a new market, or boosting customer lifetime value?" This helps you anchor your KPIs to top-line business objectives.
- For the Head of Sales: "Can we define exactly what a 'qualified lead' is for your team? What criteria must they meet?" This prevents you from delivering leads that the sales team rejects, ensuring your efforts are valued.
- For the Product Team: "Which features are we pushing right now, and how can marketing help with user adoption and getting feedback?" This aligns your campaigns with the product roadmap.
Having these conversations upfront prevents painful misalignment later. It allows you to build a framework that directly supports company-wide objectives, making it way easier to show how your department is moving the needle.
Pick the Right Metrics for Each Stage of the Funnel
A good measurement framework tells the whole story, from the first time a prospect hears about you all the way to their purchase. This means you need specific KPIs for each stage of the customer journey, not just the final conversion. It’s like a relay race—each stage hands off to the next, and a weak link anywhere in the chain messes up the final result.
A classic mistake is getting obsessed with last-touch attribution, which gives 100% of the credit to the final ad someone clicked. A smart framework recognizes that the blog post they read last month, the social video they watched last week, and the webinar they attended yesterday all played a part.
Let's compare how you'd measure success for different channels at each stage:
- Top-of-Funnel (Awareness): For a LinkedIn brand campaign, you might track Impressions and Share of Voice. A better, more actionable metric is qualified reach—are the right people seeing your content? Compare this to an SEO-driven blog, where you’d measure Organic Traffic and Keyword Rankings for high-intent terms.
- Middle-of-Funnel (Consideration): A webinar’s performance is judged by its Registration Rate and Attendee Engagement. But to make this actionable, track how many attendees ask questions or respond to polls. Compare this to an ebook's success, which is all about its Landing Page Conversion Rate and the Quality of Leads it generates (i.e., how many become MQLs).
- Bottom-of-Funnel (Conversion): For a Google Ads campaign, the most important metric is Cost Per Acquisition (CPA). For a final-push email sequence, compare the Click-Through Rate on "Book a Demo" links to the ultimate Sales Conversion Rate. If CTR is high but conversions are low, the issue is on the landing page, not the email.
By building this kind of balanced scorecard, you avoid the trap of calling a top-of-funnel campaign a "failure" just because it didn't drive sales directly. That wasn't its job. Its job was to fill the pipeline, and your framework should prove it did just that. For a deeper dive into setting up a solid foundation for tracking your efforts, check out this modern guide for impactful marketing. This approach helps you build a clear, defensible story about how every marketing dollar contributes to the bottom line.
Choosing The Right Marketing Metrics And KPIs
Alright, you've got your strategy sketched out. Now comes the hard part: cutting through the noise. It’s incredibly easy to get buried in a mountain of data, staring at charts that go up and to the right without actually telling you if you're growing the business.
Effective measurement isn't about tracking everything. It’s about being ruthless and focusing only on the numbers that signal real business momentum, not just marketing activity. A spike in website traffic is a classic vanity metric. It feels good, but it means nothing if none of those visitors are the right people.
The goal is to connect every single metric you track back to a tangible business outcome. You need to tell a story with your data—a story that ends with marketing’s direct contribution to the bottom line.
Aligning Metrics To The Marketing Funnel
You wouldn't judge a sprinter on their marathon time, right? The same logic applies here. Different stages of the customer journey demand different yardsticks. One of the most common mistakes I see is teams judging an awareness campaign by its direct sales impact. It’s a recipe for killing good campaigns before they have a chance to work.
Think of your funnel metrics as a diagnostic tool. If conversions are tanking, a funnel-based view lets you look upstream. Is the problem weak leads coming from the middle of the funnel? Or is it that you just aren't getting enough eyeballs at the top?
Let's walk through what this looks like in practice, comparing standard metrics to more insightful ones:
-
Awareness Stage (Top of Funnel): Instead of just tracking Impressions (how many times your content was seen), a much sharper metric is Share of Voice (SOV). It answers a better question: "How much of the conversation in our market do we actually own compared to our competitors?" This gives you a competitive benchmark.
-
Consideration Stage (Middle of Funnel): Click-Through Rate (CTR) is a solid indicator that your creative and messaging are hitting the mark. But a more holistic metric is Engagement Rate (likes, shares, comments). It tells you if your content is truly resonating, not just getting a passing click. Actionable insight: high engagement but low CTR means your content is good, but your call-to-action is weak.
-
Conversion Stage (Bottom of Funnel): Conversion Rate is your bread and butter—it’s the percentage of people who take the action you want them to. But the real gut-check metric is Cost Per Acquisition (CPA). It tells you exactly how much you're spending to get one new customer, making it a direct line to campaign efficiency and profitability. Compare the CPA across different channels to decide where to allocate your budget.
To make this even clearer, here's a quick reference table breaking down the essential KPIs for each stage of the journey.
Key Marketing Metrics by Funnel Stage
Tracking the right metrics at each stage gives you a clear, actionable picture of your marketing performance, from initial brand exposure to the final conversion.
| Funnel Stage | Metric/KPI | What It Measures | Example Tool |
|---|---|---|---|
| Awareness | Impressions | Total times content is displayed. | Google Ads |
| Awareness | Share of Voice (SOV) | Your brand's visibility vs. competitors. | Brandwatch |
| Consideration | Click-Through Rate (CTR) | Percentage of impressions that result in a click. | HubSpot |
| Consideration | Engagement Rate | Likes, shares, comments as a % of audience. | Sprout Social |
| Conversion | Conversion Rate | Percentage of users who complete a desired action. | Google Analytics |
| Conversion | Cost Per Acquisition (CPA) | The total cost to acquire a single new customer. | Salesforce |
Using this framework helps you pinpoint weaknesses and double down on what’s working, ensuring your entire marketing engine is firing on all cylinders.
The Business-Level Metrics Executives Actually Care About
While funnel metrics are your day-to-day guide for optimizing campaigns, the C-suite speaks a different language. They're focused on growth, profitability, and the long-term health of the business. To earn their trust (and bigger budgets), you need to translate your marketing efforts into their language.
The most effective marketers don't just report on clicks and leads; they demonstrate how marketing drives the core financial health of the business. This is how you get a seat at the strategic table.
Two numbers matter more than almost any others here: Customer Acquisition Cost (CAC) and Customer Lifetime Value (CLV).
-
Customer Acquisition Cost (CAC): This is the total sales and marketing spend it takes to land a single new customer over a specific time. You calculate it by dividing all your acquisition costs by the number of new customers you brought in. No hiding here—it's the true cost of growth.
-
Customer Lifetime Value (CLV): This is a prediction of the total net profit you'll get from a customer over their entire relationship with you. It’s about their long-term worth, not just their first purchase.
The real power move is comparing these two. The CLV:CAC ratio is your ultimate proof point for sustainable marketing. A healthy ratio, typically 3:1 or higher, is a clear signal that you're acquiring customers who generate far more value than they cost to win. Understanding how to calculate ROI to prove investment value is non-negotiable for justifying your spend.
This isn’t just about reporting, either. It directly shapes your strategy. Actionable step: calculate the CLV for customers acquired from different channels. If you discover that leads from your webinar series have a sky-high CLV compared to those from paid social, you can confidently shift budget away from lower-performing channels and double down on webinars. This is also where AI can give you a massive edge, helping you qualify leads better and focus your team's energy only on high-value prospects. We dive deep into that topic in our guide on how to use AI for better lead scoring.
Navigating Modern Attribution Models
So you’ve got your KPIs locked in. The next question is the one that sparks endless debate in marketing meetings: who gets the credit? A customer might see a Facebook ad, read a couple of blog posts, open an email, and then finally click a Google Ad before they buy. Which one of those channels actually did the work? This is the classic attribution problem, and it’s where a lot of marketers get stuck trying to prove their budget is well-spent.
Attribution modeling is just a fancy term for a set of rules that assign value to the different touchpoints in that messy customer journey. If you get it right, you can confidently measure what’s working. But if you choose the wrong model, you might end up cutting the budget for a channel that’s quietly doing all the heavy lifting at the start of the journey.
Comparing Single-Touch vs. Multi-Touch Models
The simplest models are single-touch, which give 100% of the conversion credit to just one interaction. They're easy to set up but can be dangerously misleading because they only show you a tiny sliver of a much bigger picture. In contrast, multi-touch models distribute credit, offering a more realistic view.
Let's compare the common single-touch models:
- First-Touch Attribution: This model gives all the credit to the very first interaction. It’s useful if your main goal is driving top-of-funnel awareness. The problem? It completely ignores everything that happened afterward to actually nurture that lead and convince them to buy. Actionable Use: Use this model to identify your best "introducer" channels.
- Last-Touch Attribution: This is the default setting in a lot of analytics platforms. It gives all the credit to the final touchpoint right before the conversion. It’s great for figuring out which channels are your best "closers," but it gives zero value to the channels that introduced and educated the customer in the first place. Actionable Use: Use this model to optimize your bottom-of-funnel conversion campaigns.
Relying on these is like giving all the credit for a championship win to the person who scored the final goal, ignoring the assists, the defense, and the coaching. For a more accurate view, you have to look at multi-touch attribution.
Multi-touch models get that modern customer journeys aren't a straight line. They distribute credit across multiple touchpoints, giving you a far more balanced and realistic understanding of what’s actually driving results.
A Deeper Look at Multi-Touch Attribution
Multi-touch models give you a more nuanced view by assigning partial credit to different interactions along the path. Yes, they’re more complex, but the insights they generate are gold for making smart budget decisions.
Here’s a breakdown of the most common multi-touch models and where they shine:
| Attribution Model | How It Works | Best Used When... |
|---|---|---|
| Linear | Gives equal credit to every single touchpoint in the journey. | You want a simple, balanced view and value every interaction equally, which is common for long B2B sales cycles. |
| Time-Decay | Gives more credit to touchpoints that happened closer to the conversion. | The consideration phase is short, and recent interactions are genuinely more influential, like during a flash sale. |
| Position-Based | Gives 40% credit to the first touch, 40% to the last touch, and the remaining 20% is split among the middle touches. | You value both the channel that hooked them and the channel that closed them the most. This is a common and balanced approach for many businesses. |
Picking the right model really depends on your business and how long it takes for a customer to decide. A B2B company with a six-month sales cycle might lean toward a Linear model, while an e-commerce brand could get more value from a Position-Based or Time-Decay model.
Actionable Step: Don't just pick one model and stick with it. In your analytics tool (like GA4), compare the results from 2-3 different models. Does your content marketing look more valuable under a Linear model than a Last-Touch model? This comparison itself is a powerful insight. Of course, this requires solid tracking, which our guide to understanding person-level identification can help you nail down.
The Rise of Marketing Mix Modeling in a Privacy-First World
With privacy rules getting stricter and third-party cookies going away, tracking individual users is getting a lot harder. This is where Marketing Mix Modeling (MMM) is making a comeback. Instead of following individual users, MMM uses statistical analysis on big-picture data—like channel spend, sales revenue, and even external factors like seasonality—to measure the impact of each marketing channel.
This visual lays out the foundational steps for any good measurement strategy, starting with identifying your data sources and ensuring everything is tracked correctly.
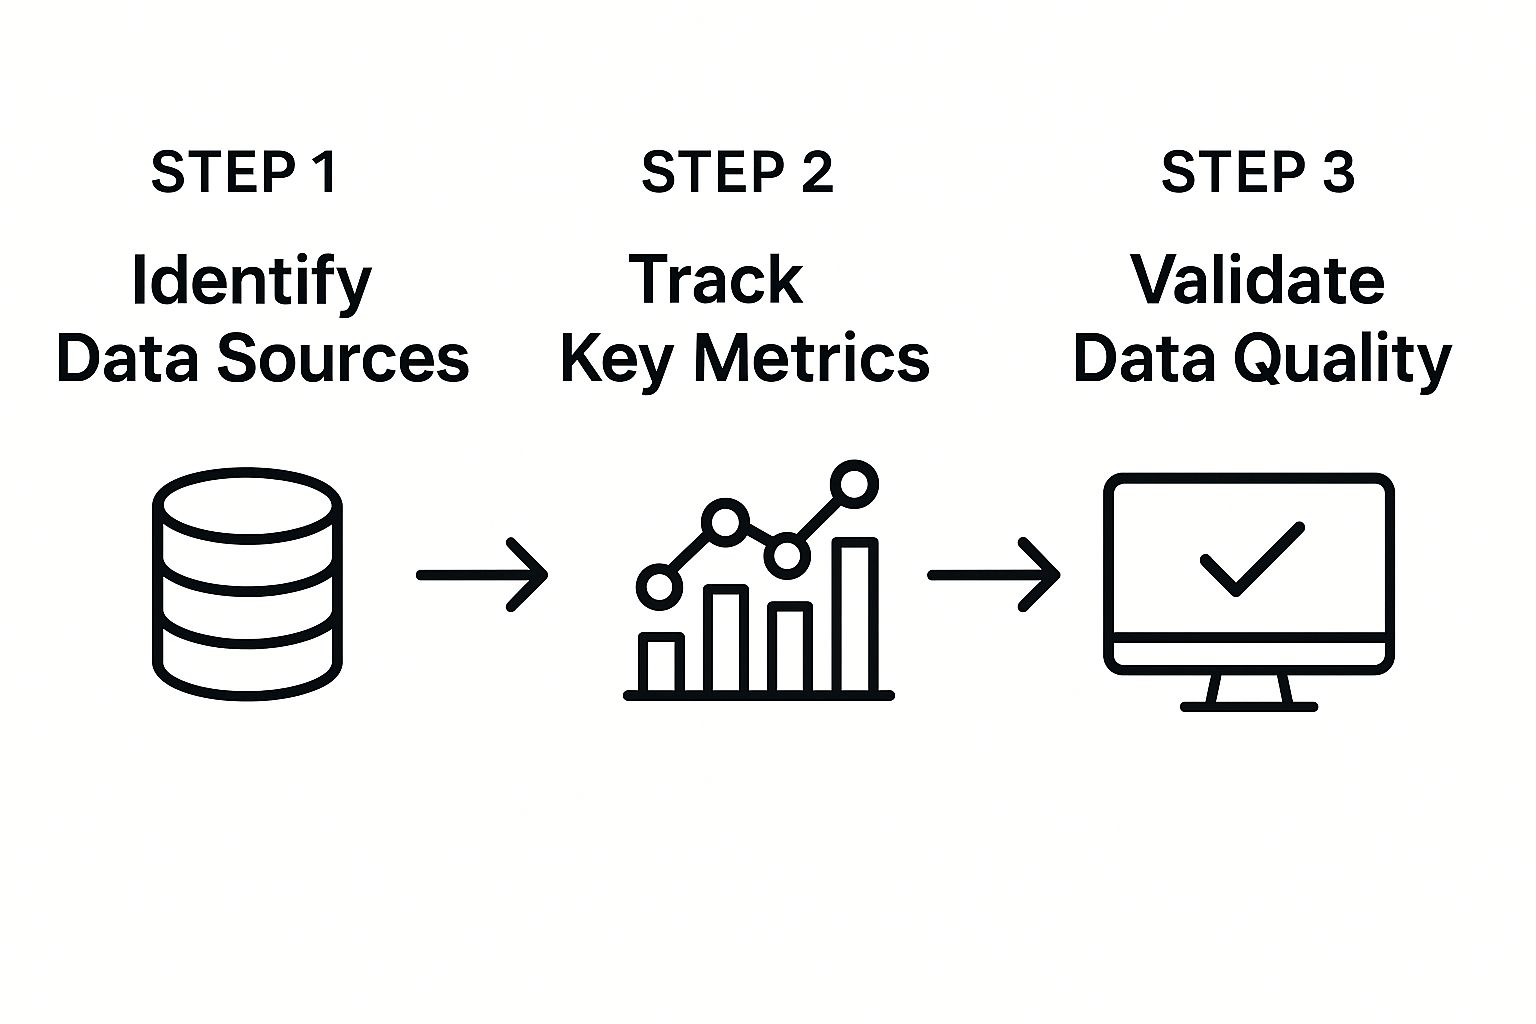
This process is the bedrock for MMM, which needs high-quality, aggregated data to deliver trustworthy insights on channel performance.
MMM became the talk of the town again after privacy updates like Apple's App Tracking Transparency in 2021 made user-level attribution a nightmare. Now, many see it as the 'new gold standard' for measurement. It helps you answer the big questions like, "For every dollar we spend on TV ads, how much incremental revenue do we generate?"—all without needing to track a single cookie.
Using AI to Find Insights That Actually Matter
Let's be honest. Traditional analytics are like a rearview mirror—they tell you exactly what you just passed. That’s useful, but it won’t help you navigate what’s ahead. AI analytics, in comparison, are like a GPS with live traffic data. They don't just show you the map; they predict the traffic jams and suggest faster routes. This is the biggest shift in marketing measurement today: moving from simply reporting on what happened to proactively shaping what happens next.
Forget spending hours in spreadsheets trying to connect the dots. Modern AI tools chew through massive datasets in seconds. They spot the subtle customer behaviors your team would miss, predict which campaigns will actually hit their numbers, and automate the kind of deep analysis that used to take weeks.
This isn't just about efficiency. It's about getting a real, sustainable edge on the competition. The whole game is changing, thanks to a mix of new tech, economic pressures, and privacy rules. According to the Marketing Effectiveness Trends 2025 report by ScanmarQED, AI is now central to everything from personalizing content to forecasting ROI with startling accuracy.
Finding the "Why" Behind the "What"
One of the most valuable things AI does is find connections humans can't easily see. By looking at actual behavior—what people click, how long they stay, which content they consume—AI builds customer segments based on what they do, not just who they are. This goes so much deeper than old-school personas.
An AI tool might surface a segment it calls "high-intent researchers." These aren't just VPs of Marketing from tech companies. These are the specific people who read three of your technical blog posts, watched 75% of a product demo, and visited your pricing page twice this week.
AI isn't just grouping people together. It’s identifying the exact sequence of micro-actions that scream "I'm ready to buy." This lets you stop guessing and start focusing your best efforts on your highest-value prospects with laser precision.
This completely changes how you measure success. You move from asking, "Did our email campaign get a good open rate?" to "Did our email campaign successfully nudge our 'high-intent researchers' into booking a demo?" It shifts the focus from vanity metrics to real business impact.
Platforms like Salesforce use AI to pull all these disparate data points into a single, unified view of the customer, making these kinds of insights accessible. It's about seeing the entire journey, not just isolated touchpoints.
This kind of dashboard isn't just a pretty picture; it’s a command center that shows how AI is connecting every interaction to build an intelligent profile you can act on.
Trading Yesterday's Reports for Tomorrow's Forecasts
This is where things get really interesting. Predictive analytics uses your past performance data to forecast what's likely to happen next. Instead of waiting for a campaign to end to see if you hit your cost-per-acquisition (CPA) goal, a predictive model can tell you what your CPA is likely to be after just a few days of data.
It’s a fundamental shift from reactive to proactive. Let's compare the two approaches:
| Task | The Old Way (Reactive) | The AI Way (Proactive) |
|---|---|---|
| Budget Allocation | Based on what worked last quarter. | Reallocated in real-time to channels predicted to have the highest ROI this week. |
| Lead Scoring | Static points system based on job title and company size. | A dynamic score that changes based on a lead's real-time website behavior. |
| Content Strategy | Writing about topics you think your audience wants. | Creating content on topics AI has identified as having high engagement potential with your target segments. |
This means you can optimize campaigns while they're still running. Actionable Step: If an AI tool predicts a specific ad set is on a path to fail, you can pull the plug and move that budget to a winner before you've wasted thousands of dollars. It’s about making smarter decisions, faster.
Think about an e-commerce company. An AI model could identify customers at a high risk of churning based on their recent purchasing and browsing behavior. That model flags the accounts, triggering a targeted retention campaign with a special offer—before they actually leave. That's a direct line from a marketing action to saving revenue.
A huge part of this is digging into the content they engage with. If you want to get better at that, our guide on leveraging AI for smarter content analysis is a great place to start.
Turning Analysis Into Actionable Campaign Improvements

All the frameworks, KPIs, and attribution models in the world are just theory until you use them to make your marketing better. Measurement is meaningless without action. This is where you close the loop—turning raw numbers into smarter decisions that actually drive growth.
Successfully measuring marketing isn't a one-and-done project. It's a continuous rhythm of reviewing, testing, and refining. You're building a system where data doesn't just sit in a dashboard but actively fuels your next move.
It all comes down to diagnosing what’s working, understanding why, and then systematically improving your strategy based on hard evidence, not just gut feelings.
Establishing a Rhythm for Performance Reviews
To make data-driven decisions a habit, you need to get a consistent review schedule on the calendar. Sporadic check-ins lead to missed opportunities and reactive firefighting. A structured approach ensures you’re always on top of what’s happening.
Here's an actionable cadence you can implement today:
- Weekly Tactical Check-ins: These are quick, 30-minute huddles focused on campaign-level metrics. You’re looking for immediate red flags or quick wins. Is a specific ad’s Cost Per Click (CPC) suddenly spiking? Can we shift budget to a high-performing social post? Keep it fast and actionable.
- Monthly Strategic Reviews: This is a deeper dive into channel performance and how you’re tracking toward quarterly goals. Are we on track to hit our MQL target? How is our SEO traffic growth trending month-over-month? This is where you connect the dots between tactics and strategy.
- Quarterly Business Reviews: Here, you zoom all the way out and connect marketing efforts directly to business outcomes. You'll be presenting your CLV:CAC ratio, overall marketing ROI, and contribution to the sales pipeline to stakeholders. It's about showing real business impact.
This tiered approach keeps everyone aligned without causing data overload. The goal is to make these meetings about insight and action, not just reading numbers off a screen.
Designing Tests That Deliver Clear Answers
The fastest way to improve is to test. But unfocused testing is just as wasteful as not testing at all. To get real answers, you need to be deliberate about what you're trying to learn. The two most common methods are A/B testing and multivariate testing.
A/B testing is your go-to for a clean, simple, and direct comparison between two versions of a single element. You get a clear winner. For example, you might test two different email subject lines to see which one gets a higher open rate.
Multivariate testing, on the other hand, is for when you want to test multiple changes at once to see which combination performs best. You could test two headlines, two images, and two calls-to-action all at the same time on one landing page. This is way more complex and requires a ton of traffic to get statistically significant results, but it can uncover powerful interaction effects between elements you’d never have spotted otherwise.
Don’t just test for the sake of testing. Start with a clear hypothesis. Something like: "I believe that changing the CTA button color from blue to orange will increase the landing page conversion rate because orange creates a stronger visual contrast." This transforms a random guess into a scientific experiment.
Here’s a quick comparison to help you choose the right approach for your needs.
A/B Testing vs. Multivariate Testing Comparison
Deciding between these two really just depends on your goal, how much traffic you have, and how quickly you need an answer.
| Aspect | A/B Testing | Multivariate Testing |
|---|---|---|
| Primary Goal | To determine which of two versions of a single element performs better (e.g., Headline A vs. Headline B). | To determine which combination of multiple elements performs best (e.g., Headline A + Image B + CTA C). |
| Complexity | Simple to set up and analyze. | More complex, as it tests multiple variables and their interactions simultaneously. |
| Traffic Required | Lower. You can get statistically significant results with less traffic since you're only comparing two versions. | Much higher. It needs enough traffic to test every possible combination of elements effectively. |
| Best For | Optimizing specific, high-impact elements like CTAs, subject lines, or hero images for quick wins. | A full redesign or overhaul of a key page, like a pricing page or homepage, where many elements are changing. |
For most teams, starting with a series of simple A/B tests is the most practical way to build momentum and see immediate results. Once you’re in a good rhythm, you can explore more complex multivariate tests on your highest-traffic pages.
Diagnosing Performance and Refining Your Strategy
Once your reports and tests start generating data, the real work begins. This part is all about asking "why" and turning those answers into strategic adjustments.
Imagine your data shows a landing page has a crazy high bounce rate. The diagnosis phase is about figuring out the cause. Is the page loading too slowly? Is the headline misleading compared to the ad copy? Are there way too many form fields?
Use your analytics to formulate an actionable plan. If you suspect the form is too long, your next action is to run an A/B test with a shorter form. If the test proves your hypothesis and conversions increase by 15%, you’ve successfully turned an insight into a tangible improvement.
This is how you foster a culture of continuous, data-informed progress—closing the loop and turning your marketing measurement into a true engine for business growth.
Try our Marketing Plan Generator — generate a complete AI-powered marketing plan in minutes. No signup required.
Your Top Marketing Measurement Questions, Answered
Let's be honest, navigating the world of marketing analytics can feel like trying to drink from a firehose. You’ve got data coming from everywhere. Here are some straightforward answers to the questions I hear most often from marketers trying to connect their work to real results.
How Often Should I Actually Look at My Metrics?
This is a classic. The right answer depends entirely on what you're looking at. Checking your customer lifetime value every morning is a recipe for anxiety, but waiting a month to check on a new ad campaign's CPC is a great way to waste money.
You need to think in tiers. Here’s a simple, actionable schedule that works:
- Daily or Weekly: This is for the fast-twitch metrics. Think Cost Per Click (CPC), ad impressions, social media comments, and shares. These are the numbers that tell you if a live campaign is healthy or needs immediate attention. You're looking for spikes and dips—anything that needs a quick fix.
- Monthly: Now you can zoom out a bit. It's time to review channel performance. How is overall organic traffic growing? What's our Cost Per Lead (CPL) looking like for the month? Are email open rates trending up or down? This is where you spot broader trends and decide where to focus your energy for the next 30 days.
- Quarterly: This is the big picture review. It’s when you report on the metrics that matter to the C-suite: Customer Lifetime Value (CLV), Customer Acquisition Cost (CAC), and total marketing-generated revenue. These high-level numbers inform major strategic decisions and budget allocations.
What's the Best Analytics Stack for a Small Business?
If you're a small business, your goal is to get the most insight for the least amount of complexity and cost. You absolutely do not need some massive, enterprise-level platform that requires a dedicated analyst to run.
Instead, a few key tools, used together, can give you a surprisingly powerful view of what's working.
Here’s a fantastic starting point:
- Google Analytics (GA4): This is non-negotiable. It’s free, and it's the bedrock for understanding who is coming to your website, how they got there, and what they do once they arrive.
- Your CRM's Built-in Analytics: Whether you're using HubSpot, Zoho, or something else, your CRM is a goldmine. It's where you can finally connect a specific marketing campaign to an actual closed deal.
- Native Social Media Analytics: Don't overlook the free tools built right into platforms like LinkedIn and Instagram. They offer incredibly deep insights into your audience, what content resonates, and how people are engaging with your brand.
This simple trio gives you a 360-degree view without breaking the bank. As you grow, you can layer in more specialized tools for things like SEO or heat mapping, but this is the perfect foundation.
How Do I Prove the ROI of My Content Marketing?
This one feels tricky, right? Content marketing's impact often builds slowly and indirectly. A blog post doesn't always lead to an immediate sale like a direct-response ad. The secret is to stop focusing on vanity metrics like page views and start connecting content to tangible business goals.
The biggest mistake I see is when teams judge content on last-touch attribution alone. Someone might read five of your articles over three months before they finally click an ad, but that ad gets 100% of the credit. You need a smarter way to look at it.
Here’s a practical, step-by-step way to calculate content ROI:
- Find Your Content-Sourced Leads: Dive into your analytics and identify how many people who first found your site through a piece of content (like a blog post) eventually became a lead (by downloading an ebook, signing up for your newsletter, etc.).
- Give Those Leads a Dollar Value: Sit down with your sales team and figure out the average value of a lead. Let's say 10% of leads become customers, and the average customer is worth $5,000 in their first year. Simple math tells you each lead is worth $500 in potential revenue.
- Do the ROI Math: If a single blog post cost you $500 to create and it generated 4 leads in six months, it has produced $2,000 in pipeline value. That's a 300% ROI.
This approach ties your content creation costs directly to potential revenue, giving you a powerful, defensible metric that proves your content is more than just words on a page—it's a revenue driver.
Ready to stop guessing and start knowing what drives your marketing success? marketbetter.ai uses predictive analytics to connect every campaign to real business outcomes, helping you optimize spend and prove your impact. See how our AI-powered platform can transform your measurement strategy at https://www.marketbetter.ai.